Bitcoin (BTC/USD) was under pressure early in today’s Asian session with the pair slumping to the 5289.24 level. Traders took the pair as high as the 5488.00 area during yesterday’s North American session before profit-taking took the pair to the 5213.06 level, just above the 76.4% retracement of the 5345.00 – 4778.00 range.
Chartists are keeping their eyes on the 5175.79 and 5079.35 areas, representing short-term technical Support related to the 4670.69 – 5488.00 range. Stops are expected below the 5103.32 area, representing the 23.6% retracement of the 3858.00 – 5488.00 range.
As noted again in our 10 April 2019 analysis, the 5265.70 level continues to be a technical focal point that we have written about extensively, representing the 50% retracement of the 7402.50 – 3128.89 range. Price activity continues to orbit this area.
Additional Buying pressure will spotlight key upside price objectives including 5733.84/ 5941.26/ 6393.93.
Price activity is nearest the 50-bar MA (4-hourly) at 5059.06 and the 50-bar MA (Hourly) at 5249.09.
Technical Support is expected around 4877.05/ 4582.91/ 4393.64 with Stops expected below.
Technical Resistance is expected around 5769.98/ 5941.26/ 6393.93 with Stops expected above.
On 4-Hourly chart, SlowK remains Bearishly below SlowD while MACD remains Bearishly below MACDAverage.
On 60-minute chart, SlowK remains Bearishly below SlowD while MACD remains Bearishly below MACDAverage.
Ethereum
Ethereum (ETH/USD) came off during the Asian session with early activity pushing the pair as low as the 169.52 area, not far above the 50-bar MA (4-hourly) which was then at 168.15. A possible Double Top is forming on a 4-hourly chart, thus chartists are very curious to see what develops between the 169.20 – 160.48 range.
Stops were elected below the 174.17 area during the move lower, representing the 23.6% retracement of the 130.64 – 187.62 range.
As we have been noting the 173.72 area remains technically relevant with the 169.94/ 166.80 areas also of technical importance.
Additionally, as noted in our 4 April 2019 analysis, the 172.88 level also represents the 38.2% retracement of the move from 322.16 – 80.60, and a break would technically open up a possible move to the 137.61 level.
Price activity is nearest the 50-bar MA (4-hourly) at 168.85 and the 100-bar MA (Hourly) at 175.85.
Technical Support is expected around the 168.47/ 160.62/ 151.69 levels with Stops expected below.
Technical Resistance is expected around the 183.35/ 191.40/ 201.38 levels with Stops expected above.
On 4-Hourly chart, SlowK is Bearishly below SlowD while MACD is Bearishly converging with MACDAverage.
On 60-minute chart, SlowK remains Bearishly below SlowD while MACD remains Bearishly below MACDAverage.
Litecoin
Litecoin (LTC/USD) showed some weakness early in the Asian session with the pair trading as low as the 86.63 area following an inability to get above the 91.99 area during yesterday’s North American session. The 50-bar MA (4-hourly) is around 85.64 and this may provide some short-term technical Support.
Stops were elected yesterday above the 89.18 and 90.85 levels, key retracement areas.
Price activity is nearest the 50-bar MA (4-hourly) at 85.64 and the 50-bar MA (Hourly) at 87.86.
Technical Support is expected around the 78.89/ 72.10/ 65.60 levels with Stops expected below.
Technical Resistance is expected around the 94.81/ 102.26/ 116.06 levels with Stops expected above.
On 4-Hourly chart, SlowK is Bearishly below SlowD while MACD is Bearishly below MACDAverage.
On 60-minute chart, SlowK remains Bearishly below SlowD while MACD remains Bearishly below MACDAverage.
Bitcoin Cash
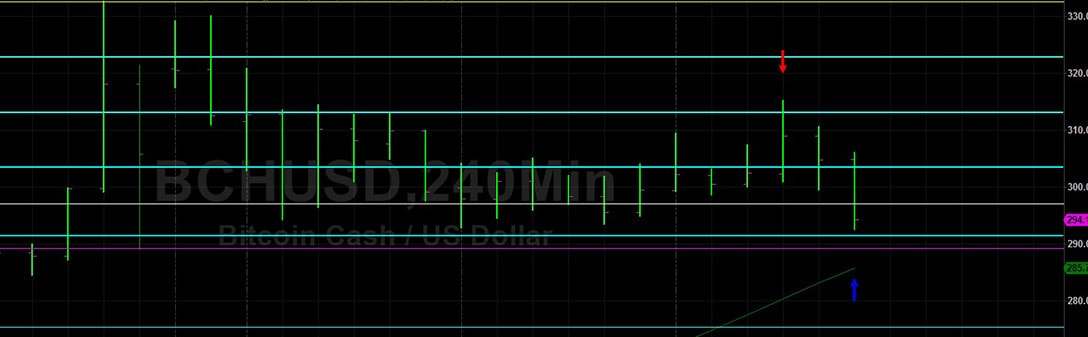
BCH/USD (Bitcoin Cash/ US dollar) depreciated during today’s Asian session with the pair reaching the 294.31 level after trading as high as the 315.14 area during yesterday’s North American session. Price activity is approaching the 291.39 area, representing the 23.6% retracement of the 659.00 – 73.22 range.
As noted in our 10 April 2019 analysis, a break of this current tight range will quickly spotlight the 289.18 level, representing the 38.2% retracement of the 638.55 – 73.22 range. If and when that level breaks, chartists will be eyeing the 275.42 area, representing the 23.6% retracement of the 929.99 – 73.22 range. Below this area, the 265.55 and 211.46 areas represent downside areas of possible technical Support.
Price activity is nearest the 50-bar MA (4-hourly) at 285.70 and the 50-bar MA (Hourly) at 301.05.
Technical Support is expected around the 289.18/ 258.91/ 229.49 levels with Stops below.
Technical Resistance is expected around the 322.78/ 332.55/ 355.89 levels with Stops above.
On 4-Hourly chart, SlowK has Bearishly crossed below SlowD while MACD remains Bearishly below MACDAverage.
On 60-minute chart, SlowK has Bearishly crossed below SlowD while MACD remains Bearishly below MACDAverage.