Bitcoin
Bitcoin (BTC/USD) reached a key upside price objective early in the Asian session when 5265.70 was reached, representing the 50% retracement of the 7402.50 – 3128.89 range. Stops were triggered and pushed the pair as high as the 5345.00 figure before profit-taking knocked the pair lower to the 4787.11 level, just above the 4761.41 area, representing the 38.2% retracement of the same range.
Today’s intraday high represents BTC/USD’s Highest level since 19 November 2018.
Chartists are eyeing the 5403.82 level, representing the 61.8% retracement of the 6810.00 – 3128.89 range.
Technical Support is expected around 4393.64/ 4137.46/ 3997.63 with Stops expected below.
Technical Resistance is expected around 5769.98/ 5941.26/ 6393.93 with Stops expected above.
On 240-minute chart, the 50-bar MA is around 4268.57. SlowK has Bearishly moved below SlowD while MACD and MACDAverage appear to be converging.
On 60-minute chart, SlowK is Bearishly below SlowD while MACD is Bearishly below MACDAverage.
Ethereum
Ethereum (ETH/USD) traded at its highest level since 18 November 2018 before depreciating sharply to the 150.52 level and then recovering back around the 164.50 area. In recent sessions, the pair has been orbiting the 172.88 level, representing the 38.2% retracement of the 322.16 – 80.60 range. During the intraday pullback, some Bids emerged around the 151.69 level, representing the 50% retracement of the move from 222.78 – 80.60 range.
Price activity is nearest the 50-bar MA, coming in around 145.51.
Technical Support is expected around the 142.02/ 134.91/ 130.29 levels with Stops expected below.
Technical Resistance is expected around the 191.40/ 201.38/ 217.55 levels with Stops expected above.
On 240-minute chart, SlowK is Bearishly below SlowD while MACD and MACDAverage are Bearishly converging.
On 60-minute chart, SlowK has Bullishly crossed above SlowD while MACD and MACDAverage are Bearishly diverging.
Litecoin
Litecoin (LTC/USD) extended recent gains and recorded its strongest showing since 19 June 2018, printing around the 99.89 area before coming off to the 73.03 level. During the pullback, today’s intraday Low of 73.03 was just above the 61.8% retracement of the 103.06 – 22.17 range.
Significant Stops were reached above the 88.68 level during the move higher, representing the 23.6% retracement of the 304.00 – 22.17 range.
Price activity is nearest the 50-bar MA (4-hourly), coming in around 65.07.
Technical Support is expected around the 72.10/ 62.62/ 53.07 levels with Stops expected below.
Technical Resistance is expected around the 109.93/ 116.06 /121.16 levels with Stops expected above.
On 240-minute chart, SlowK has Bearishly moved below SlowD while MACD remains Bullishly above MACDAverage.
On 60-minute chart, SlowK and SlowD appear to be converging while MACD remains Bearishly below MACDAverage.
Bitcoin Cash
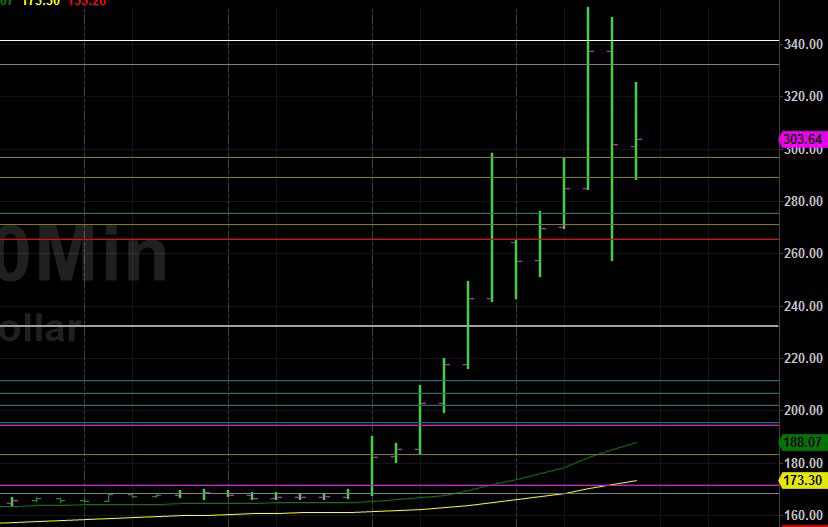
BCH/USD (Bitcoin Cash/ US dollar) has nearly doubled in value over the past several hours, as the pair reached the 354.17 level before rapidly pulling back to the 258.01 level. Major Stops were triggered above the 341.50 level during the ascent, representing the 23.6% retracement of the move from 1209.99 to 73.22. Today’s intraday High represents the pair’s strongest showing since November 2018.
Price activity is closest to the 50-bar MA (4-hourly) at 188.13 and 50-bar MA (Hourly) at 249.55.
Technical Support is expected around the 289.18/ 271.35/ 232.10 levels with Stops below.
Technical Resistance is expected around the 355.89/ 435.23/ 460.48 levels with Stops above.
On 240-minute chart, SlowK has Bearishly crossed below SlowD while MACD remains Bullishly above MACDAverage.
On 60-minute chart, SlowK has Bearishly crossed below SlowD while MACD remains Bearishly below MACDAverage.