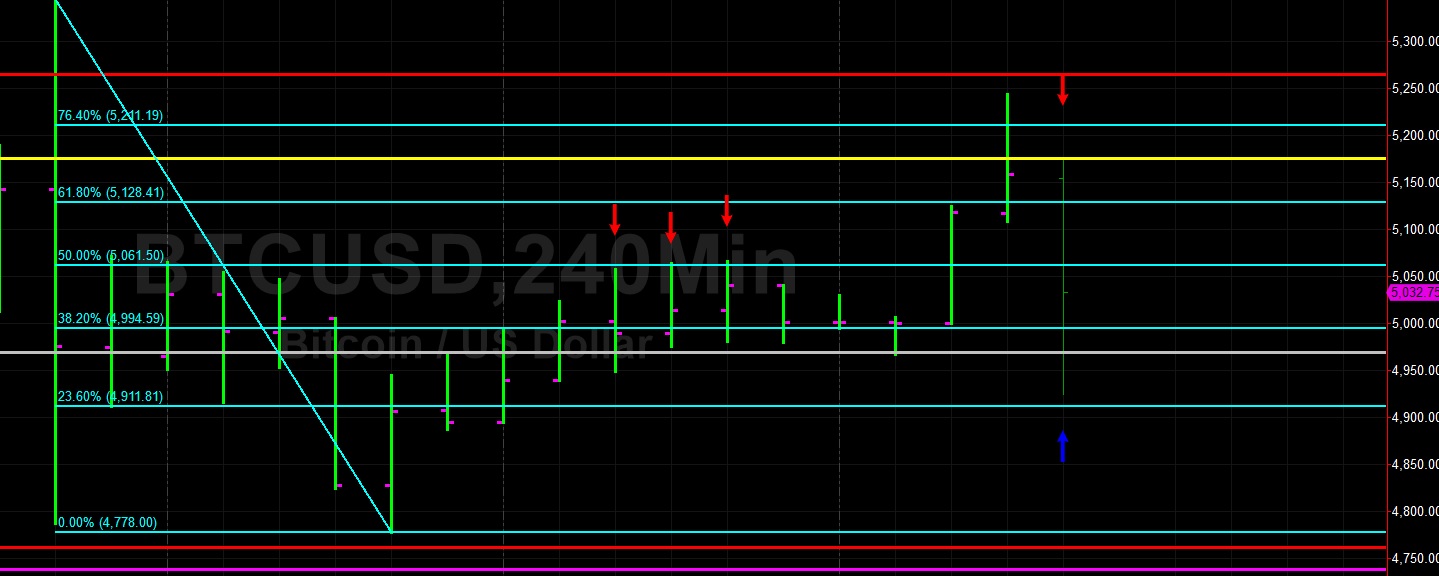
Bitcoin (BTC/USD) pushed higher during yesterday’s European session before weaker Longs exited their trades early in today’s Asian session. BTC/USD reached 5244.04 before coming off, representing the 50% retracement of the 7402.50 – 3128.89 range. During the pullback, traders tested the 5176.07 level, representing the 38.2% retracement of the 8488.00 – 3128.89 range. Bids emerged just ahead of the 4911.81 area, representing the 23.6% retracement of the move from 5345.00 – 4778.00 range.
Additional Buying pressure will spotlight key upside price objectives including 5733.84/ 5941.26/ 6393.93.
Price activity is nearest the 50-bar MA (4-hourly) at 4602.00 and the 50-bar MA (Hourly) at 5005.39.
Technical Support is expected around 4393.64/ 4137.46/ 3997.63 with Stops expected below.
Technical Resistance is expected around 5769.98/ 5941.26/ 6393.93 with Stops expected above.
On 4-Hourly chart, SlowK Bearishly moved below SlowD while MACD remains Bearishly below MACDAverage.
On 60-minute chart, SlowK remains Bearishly below SlowD while MACD has just Bullishly crossed above MACDAverage.
Ethereum
Ethereum (ETH/USD) tested major technical Resistance early in today’s Asian session, as the pair reached the 169.20 level and encountered key areas of technical congestion that we identified in our 6 April 2019 analysis. The 168.48 level represents the 61.8% retracement of the 222.78 – 80.60 range and as noted in our 4 April 2019 analysis, the 172.88 level also represents the 38.2% retracement of the move from 322.16 – 80.60.
On Hourly charts, today’s pullback after testing 173.19 saw the 100-bar MA (164.35) and 50-bar MA (163.60) levels tested.
Price activity is nearest the 50-bar MA (4-hourly) at 154.05 and the 100-bar MA (Hourly) at 164.43.
Technical Support is expected around the 144.66/ 134.91/ 130.29 levels with Stops expected below.
Technical Resistance is expected around the 180.10/ 191.40/ 201.38 levels with Stops expected above.
On 4-Hourly chart, SlowK is Bearishly converging with SlowD while MACD just Bullishly crossed above MACDAverage.
On 60-minute chart, SlowK has Bearishly crossed below SlowD while MACD is Bearishly converging with MACDAverage.
Litecoin
Litecoin (LTC/USD) raced higher and tested the 97.88 level during Saturday’s North American session as Bulls elected Stops above the 95.28 level, representing the 76.4% retracement of the 99.89 – 80.37 range. As noted in our 6 April 2019 analysis, the 92.43 level was also an upside price objective, representing the 61.8% retracement of the same range, and this is why Stops were also triggered above this area, temporarily pushing the pair to the 93.94 area.
Buying power receded during today’s Asian session and the ensuring depreciation pushed the pair back to the 88.12 level, just below the 23.6% retracement of the 304.00 – 22.17 area as noted in our 4 April 2019 analysis.
Price activity is nearest the 50-bar MA (4-hourly) at 74.42 and the 50-bar MA (Hourly) at 88.37.
Technical Support is expected around the 78.48/ 72.10/ 62.62 levels with Stops expected below.
Technical Resistance is expected around the 102.26/ 116.06 /121.16 levels with Stops expected above.
On 4-Hourly chart, SlowK is Bearishly converging with SlowD while MACD is Bullishly converging with MACDAverage.
On 60-minute chart, SlowK remains Bearishly below SlowD while MACD remains Bullishly above MACDAverage.
Bitcoin Cash
BCH/USD (Bitcoin Cash/ US dollar) powered higher early in today’s Asian session and tested a major area of technical Resistance, reaching the 332.64 area. The 332.55 level represents the 50% retracement of the 591.88 – 73.22 range, thus today’s intraday High was almost a perfect test of this key price objective.
The pair then fell back to the 289.00 level during the Asian session, just below the 289.18 level, representing the 38.2% retracement of the 638.55 – 73.22 range. As noted in our 6 April 2019 analysis, the 303.39 level was upside technical Resistance, representing the 38.2% retracement of the 354.17 – 272.00 range. Stops were elected above the 303.39/ 313.09/ 322.78 levels during the spin higher.
Another important level as noted in our 4 April 2019 analysis will remain the 341.50 level, representing the 23.6% retracement of the move from 1209.99 to 73.22.
Price activity is nearest the 50-bar MA (4-hourly) at 231.21 and the 50-bar MA (Hourly) at 293.37.
Technical Support is expected around the 258.91/ 229.49/ 200.06 levels with Stops below.
Technical Resistance is expected around the 355.89/ 400.51/ 435.23 levels with Stops above.
On 4-Hourly chart, SlowK remains Bullishly above SlowD while MACD remains Bearishly below MACDAverage.