Bitcoin
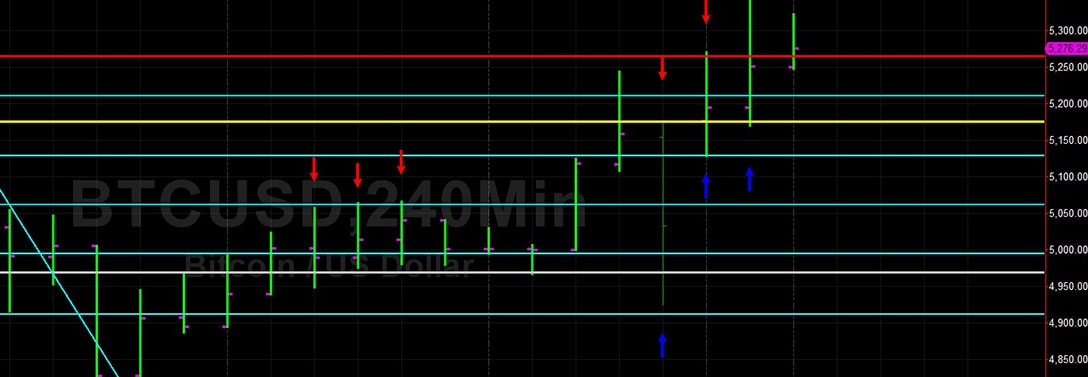
Bitcoin (BTC/USD) extended its recent surge higher, testing the 5352.50 level early in the Asian session before profit-taking emerged after the pair reached its highest level since 19 November 2018. Trading over the past several days has been very technically-driven. As noted in our 7 April 2019 analysis, the 5244.04 area remains a key technical level, representing the 50% retracement of the 7402.50 – 3128.89 range, and traders were able to elect Stops above this area.
During the pullback, Bids emerged just below the 5176.07 area, representing the 38.2% retracement of the 8488.00 – 3128.89 range, a key level also identified in our 7 April 2019 analysis. Chartists and technicians are interested to see if the 5244.04 and 5176.07 levels can become technically constructive.
Additional Buying pressure will spotlight key upside price objectives including 5733.84/ 5941.26/ 6393.93.
Price activity is nearest the 50-bar MA (4-hourly) at 4671.16 and the 50-bar MA (Hourly) at 5051.99.
Technical Support is expected around 4877.05/ 4582.91/ 4393.64 with Stops expected below.
Technical Resistance is expected around 5769.98/ 5941.26/ 6393.93 with Stops expected above.
On 4-Hourly chart, SlowK Bullishly crossed above SlowD while MACD has Bullishly crossed above MACDAverage.
On 60-minute chart, SlowK remains Bearishly below SlowD while MACD remains Bullishly above MACDAverage.
Ethereum
Ethereum (ETH/USD) scored major gains and traded as high as the 187.62 level, the pair’s strongest showing since 14 November 2018. After initially testing the 177.17 level, a shallow pullback emerged and technical Bids emerged around the 173.95 level, just above the 76.4% retracement of the 180.10 – 153.50 range. Also, as noted in our 4 April 2019 analysis, the 172.88 level also represents the 38.2% retracement of the move from 322.16 – 80.60.
Decent Stops were elected above the 183.33 level, representing the 23.6% retracement of the move from 515.88 to 80.60.
Additional upside technical Resistance is expected around 191.40/ 213.84/ 217.55.
Price activity is nearest the 50-bar MA (4-hourly) at 156.34 and the 100-bar MA (Hourly) at 166.98.
Technical Support is expected around the 173.45/ 164.69/ 155.19 levels with Stops expected below.
Technical Resistance is expected around the 191.40/ 201.38/ 213.84 levels with Stops expected above.
On 4-Hourly chart, SlowK has Bullishly crossed above SlowD while MACD remains Bullishly above MACDAverage.
On 60-minute chart, SlowK has Bearishly crossed below SlowD while MACD remains Bullishly above MACDAverage.
Litecoin
Litecoin (LTC/USD) has not been participating in the strength seen today in some of the crypto complex, with the pair generally pressured after establishing its recent high of 97.88. The pair has since been orbiting the 91.19 level, representing the 38.2% retracement of the 80.37 – 97.88 range, and the 92.02 area, representing the 23.6% retracement of the 73.03 – 97.88 range.
A break lower of the recent trading range will open up the 89.78 area, representing the 23.6% retracement of the 57.06 – 99.89 range, below which technical Bids are expected around the 86.32 level, representing the 23.6% retracement of the 42.40 – 99.89 range.
Price activity is nearest the 50-bar MA (4-hourly) at 76.27 and the 50-bar MA (Hourly) at 89.49.
Technical Support is expected around the 87.06/ 78.89/ 72.10 levels with Stops expected below.
Technical Resistance is expected around the 102.26/ 116.06 /121.16 levels with Stops expected above.
On 4-Hourly chart, SlowK is Bearishly below SlowD while MACD is Bearishly below MACDAverage.
On 60-minute chart, SlowK remains Bearishly below SlowD while MACD remains Bearishly below MACDAverage.
Bitcoin Cash
BCH/USD (Bitcoin Cash/ US dollar) is searching for technical direction during the Asian session, as traders have been unable to move the pair above the 329.90 level to again test the 332.55 level that represents the 50% retracement of the 591.88 – 73.22 range.
Bids have kept BCH/USD supported around the 311.04 area in the Asian session.
As noted in our 6 April 2019 analysis, the 303.39 level was previously technical Resistance, and chartists are interested to see if this may become technical Support.
Another important level as noted in our 4 April 2019 analysis remains the 341.50 level, representing the 23.6% retracement of the move from 1209.99 to 73.22.
Price activity is nearest the 50-bar MA (4-hourly) at 240.06 and the 50-bar MA (Hourly) at 298.53.
Technical Support is expected around the 295.32/ 258.91/ 229.49 levels with Stops below.
Technical Resistance is expected around the 355.89/ 393.75/ 422.59 levels with Stops above.
On 4-Hourly chart, SlowK Bullishly crossed above SlowD while MACD remains Bearishly below MACDAverage.
On 60-minute chart, SlowK remains Bearishly below SlowD while MACD has converged with MACDAverage.