Bitcoin
Bitcoin (BTC/USD) continued to trade extremely technically but was generally confined to a relatively tight range, with volatility accounts awaiting the pair’s next clues. Technical Resistance has kept BTC/USD on the defensive around 5242.39, representing the 50% retracement of the 5352.50 – 5132.28 range. That level is being challenged early in today’s Asian session with chartists eyeing the 5268.38 and 5300.53 levels as next upside targets. As we noted in our 8 April 2019 analysis, chartists and technicians are interested to see if the 5244.04 and 5176.07 levels can become technically constructive.
The 5265.70 level continues to be a technical focal point that we have written about extensively, representing the 50% retracement of the 7402.50 – 3128.89 range.
Additional Buying pressure will spotlight key upside price objectives including 5733.84/ 5941.26/ 6393.93.
Price activity is nearest the 50-bar MA (4-hourly) at 4940.96 and the 50-bar MA (Hourly) at 5226.80.
Technical Support is expected around 4877.05/ 4582.91/ 4393.64 with Stops expected below.
Technical Resistance is expected around 5769.98/ 5941.26/ 6393.93 with Stops expected above.
On 4-Hourly chart, SlowK remains Bearishly below SlowD while MACD remains Bearishly below MACDAverage.
On 60-minute chart, SlowK remains Bullishly above SlowD while MACD has Bullishly crossed above MACDAverage.
Ethereum
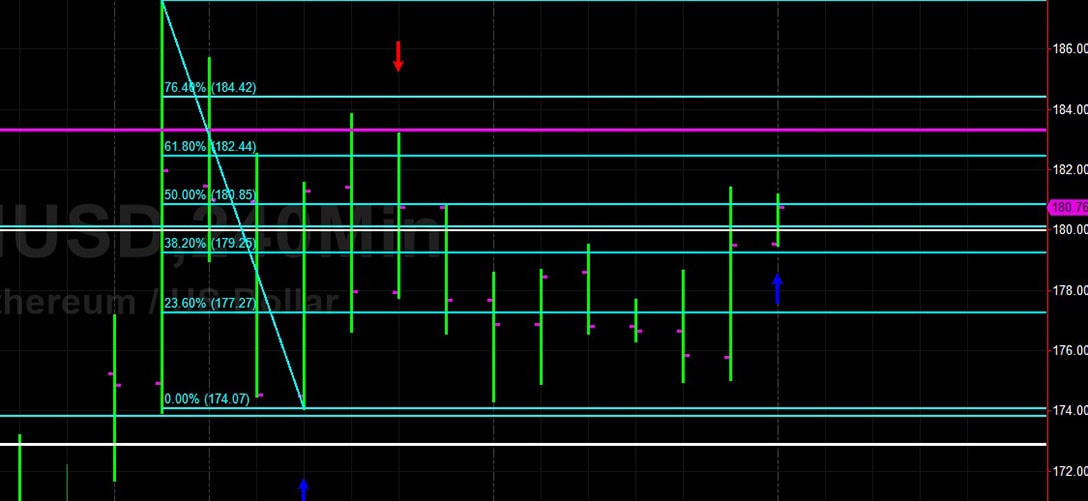
Ethereum (ETH/USD) found a Bid during the Asian session today as traders tested the 180.85 level, representing the 50% retracement of the 187.62 – 174.07 range. A flurry of Bids emerged around the 179.25 level during today’s price action, and further upside pressure could see the 182.44 and 184.42 areas challenged with Stops likely situated above.
Technicians are also continuing to eye technical Resistance around the 183.33 level, representing the 23.6% retracement of the 515.88 to 80.6 range and an area that we spotlighted in our 8 April 2019 analysis. If ETH/USD is unable to gain much upward traction, the 173.72 area will become increasingly relevant with the 169.94/ 166.80 areas also of importance.
Additionally, as noted in our 4 April 2019 analysis, the 172.88 level also represents the 38.2% retracement of the move from 322.16 – 80.60, and a break would technically open up a possible move to the 137.61 level.
Additional upside technical Resistance is expected around 191.40/ 213.84/ 217.55.
Price activity is nearest the 50-bar MA (4-hourly) at 165.07 and the 50-bar MA (Hourly) at 178.83.
Technical Support is expected around the 168.47/ 160.62/ 151.69 levels with Stops expected below.
Technical Resistance is expected around the 191.40/ 201.38/ 213.84 levels with Stops expected above.
On 4-Hourly chart, SlowK is Bearishly below SlowD while MACD is Bearishly converging with MACDAverage.
On 60-minute chart, SlowK remains Bearishly below SlowD while MACD remains Bullishly above MACDAverage.
Litecoin
Litecoin (LTC/USD) continues to orbit the technically-important 88.68 level, representing the 23.6% retracement of the 304.00 – 22.17 range. Some Bids were seen during today’s Asian session with the 88.95 level challenged before the European session opened. The 89.18 level remains short-term technical Resistance, representing the 38.2% retracement of the recent move from 97.88 to 83.81.
A break of that level would open up possible tests of the 92.51 and 94.56 areas.
Price activity is nearest the 50-bar MA (4-hourly) at 82.83 and the 550-bar MA (Hourly) at 88.07.
Technical Support is expected around the 78.89/ 72.10/ 65.60 levels with Stops expected below.
Technical Resistance is expected around the 94.81/ 102.26/ 116.06 levels with Stops expected above.
On 4-Hourly chart, SlowK is Bullishly above SlowD while MACD is Bearishly below MACDAverage.
On 60-minute chart, SlowK remains Bullishly above SlowD while MACD remains Bullishly above MACDAverage.
Bitcoin Cash
BCH/USD (Bitcoin Cash/ US dollar) continued to trade in a relatively tight range as Bulls were challenged by the 303.09 area, representing the 38.2% retracement of the 354.17 – 202.00 range. Technical Support has emerged around the 292.95 area during the last several hours, representing the 23.6% retracement of the 659.00 – 73.22 range.
A break of this current tight range will quickly spotlight the 289.18 level, representing the 38.2% retracement of the 638.55 – 73.22 range. If and when that level breaks, chartists will be eyeing the 275.42 area, representing the 23.6% retracement of the 929.99 – 73.22 range. Below this area, the 265.55 and 211.46 areas represent downside areas of possible technical Support.
Price activity is nearest the 50-bar MA (4-hourly) at 272.23 and the 50-bar MA (Hourly) at 303.39.
Technical Support is expected around the 289.18/ 258.91/ 229.49 levels with Stops below.
Technical Resistance is expected around the 322.78/ 332.55/ 355.89 levels with Stops above.
On 4-Hourly chart, SlowK has Bullishly crossed above SlowD while MACD remains Bearishly below MACDAverage.
On 60-minute chart, SlowK has Bullishly crossed above SlowD while MACD remains Bullishly below MACDAverage.