Bitcoin’s Short-Squeeze Rebound: Why $63K Still Needs Real Spot Demand

Bitcoin’s rebound into the $63K area looks and feels like a classic short squeeze. It relieved pressure, grabbed headlines, and cooled funding pockets — but it didn’t automatically fix the demand problem.
On June 5, Bitcoin traded around $63,629 during a pullback that coincided with heavy ETF redemptions, according to CoinDesk. The key question now is whether real spot buyers will step in, or if price drifts as the squeeze tailwind fades.
Below, we break down what drove the bounce, how ETF flows shape price elasticity, the on-chain tells to monitor, and practical ways to position around $63K without overcommitting to a narrative.
| Point | Details |
|---|---|
| Short-squeeze vs. real demand | Rallies driven by forced buying can fade if new spot bids don’t appear; watch spot-led metrics to confirm trend health. |
| ETF outflows reset psychology | U.S. spot Bitcoin ETFs saw 13 straight net-outflow days (May 15–Jun 3) totaling ≈$4.4B; a small inflow arrived Jun 4 (CoinDesk). |
| AUM compression | Reported BTC ETF assets slid from about $104.29B to ≈$80.40B by Jun 4 as price and redemptions combined (CoinDesk). |
| Muted spot internals | Glassnode flagged a negative All‑Exchange Spot CVD bias and ~27% 30‑day realized volatility in May, hinting at fragile spot demand (Glassnode Research). |
| What confirms $63K | Consistent net ETF creations, improving spot CVD, deeper order books, and healthier basis/funding — not just liquidations. |
Why $63K Needs Bids, Not Just Liquidations
Short squeezes are dramatic because they force traders who bet against price higher to buy back quickly. That mechanical demand is transient. It doesn’t reflect a durable shift in investor preference unless it’s followed by steady spot accumulation.
When Bitcoin pops on a squeeze, you’ll often see brisk liquidations, funding resetting toward neutral, and open interest cooling. What sustains the level is whether real-money accounts — ETFs, corporates, treasuries, family offices, and unlevered retail — keep absorbing supply on pullbacks.
As of June 5, Bitcoin hovered near $63,629 while ETF flows had only just turned a corner after a long redemption streak (CoinDesk). Without a meaningful spot bid, the $63K zone remains vulnerable to chop or giveback.
| Feature | Short‑squeeze rally | Spot‑led rally |
|---|---|---|
| Primary driver | Forced buying from shorts/liquidations | Organic demand from unlevered buyers |
| Footprint | Sharp wicks, funding resets, OI washouts | Higher lows, spot CVD uptrends, steady ETF creations |
| Durability | Fades without follow‑through | More sustainable with improving depth/liquidity |
ETF Flows and Why They Matter for Price Elasticity
Spot ETFs are a dominant gateway for U.S. investors. Creations and redemptions translate into direct buy/sell pressure on underlying coins through authorized participants (APs). The result is heightened price elasticity: flows can move spot markets faster than before.
From May 15 through June 3, 2026, U.S. spot Bitcoin ETFs posted 13 consecutive trading days of net outflows totaling roughly $4.4 billion; the streak finally ended with a modest $3.05 million inflow on June 4 (CoinDesk). That run of redemptions compressed sentiment and liquidity provision, while reported total Bitcoin ETF assets fell from about $104.29 billion at the streak’s start to roughly $80.40 billion by June 4 (CoinDesk).
The mechanics matter. During redemptions, APs either source coins in the market or deliver inventory back to issuers, which can reduce order book depth and discourage passive liquidity providers. Inflows, by contrast, are accretive to market depth and can compress spreads. The stickiness of these flows influences whether a squeeze morphs into an accumulation trend.
What to monitor daily: net ETF creations/redemptions, intraday discounts/premiums of ETF shares versus NAV, and whether net inflows persist for multiple sessions or reverse on minor volatility.
A Spot Demand Scorecard You Can Track Weekly
Use a simple checklist to test whether the $63K area is being defended by genuine demand.
- ETF flows: Are there multiple consecutive days of net creations across the largest issuers?
- Spot CVD (cumulative volume delta): Is the all‑exchange spot CVD rising — not just futures CVD?
- Order book depth: Is top‑of‑book depth thickening on major USD pairs during U.S. hours?
- Coinbase/Binance basis: Are spot prices holding small premiums to perps, implying buyers lifting offers rather than funding chasing?
- Funding and basis: Has funding normalized and is term basis positive but not overheated?
- Stablecoin power: Is stablecoin float on major exchanges expanding, signaling dry powder?
- Supply overhang: Are known seller cohorts (e.g., short‑term profit takers) showing moderation rather than spikes in distribution?
Green flags: consistent ETF creations, improving spot CVD, growing resting bids. Yellow flags: flat-to-negative CVD, one‑off ETF inflow days, depth that disappears into rallies. Red flags: renewed ETF outflow streaks and persistent basis/funding froth with weak spot prints.

On-chain Internals: CVD and Realized Volatility
On-chain and market microstructure data can help separate narrative from flow. In May, Glassnode’s Week On‑chain highlighted weakening spot internals: the All‑Exchange Spot CVD bias stayed negative into the pullback, while Bitcoin’s 30‑day realized volatility sat near 27% — relatively muted for a major leg higher (Glassnode Research).
Why it matters: a negative spot CVD suggests sellers dominated executed spot trades despite headline price swings. Low realized volatility, when paired with negative CVD, often points to range‑bound conditions where leverage, not spot, is doing the heavy lifting. For a new uptrend, you want to see spot CVD shift positive and realized vol expand moderately as genuine buying forces price to discover higher levels.
Keep the read simple: if on-chain and exchange‑level spot flows don’t turn, squeezes are likely to fade into supply. If they do turn, shallow dips should attract bids and realized vol can rise in a healthier way.
Liquidity, Order Books, and Squeeze Mechanics
Thin books amplify moves. In periods of ETF redemptions and hesitant market‑making, top‑of‑book depth can lighten up, narrowing the liquidity corridor. When shorts stack on top of one another in that environment, relatively modest buy pressure triggers stop cascades and forced covers — the squeeze.
After the squeeze, order books often remain patchy. Spoofed liquidity (fake orders quickly canceled) can bait momentum traders. Meanwhile, large sellers wait above obvious levels, making it harder for price to hold unless real buyers step up.
Pro tip: Instead of chasing green candles, watch whether pullbacks refill with limit bids that persist for hours. Durable bids are usually visible across multiple venues and time zones, not just a single exchange print.
What Comes Next? Three Scenarios to Plan For
- Follow‑through on real spot demand. Consecutive ETF inflows, positive spot CVD, and thicker order books. Expect higher lows and tighter intraday ranges between expansions. Strategy: scale into spot on pullbacks, avoid high leverage.
- Range with fading squeezes. Mixed ETF prints and flat CVD keep price oscillating around $63K. Strategy: focus on mean‑reversion, reduce chase trades, and be disciplined with stops outside the range.
- Downside retest on renewed outflows. If ETF redemptions re‑accelerate and spot CVD stays negative, liquidity can gap lower. Strategy: preserve capital; wait for capitulation footprints (e.g., large redemptions met with strong dip absorption) before adding risk.
Across all paths, remember that the prior 13‑day ETF outflow streak and AUM compression to about $80.40B by June 4 left a psychological and liquidity scar (CoinDesk). It can take time for APs and desks to rebuild inventory and comfort in warehousing risk.
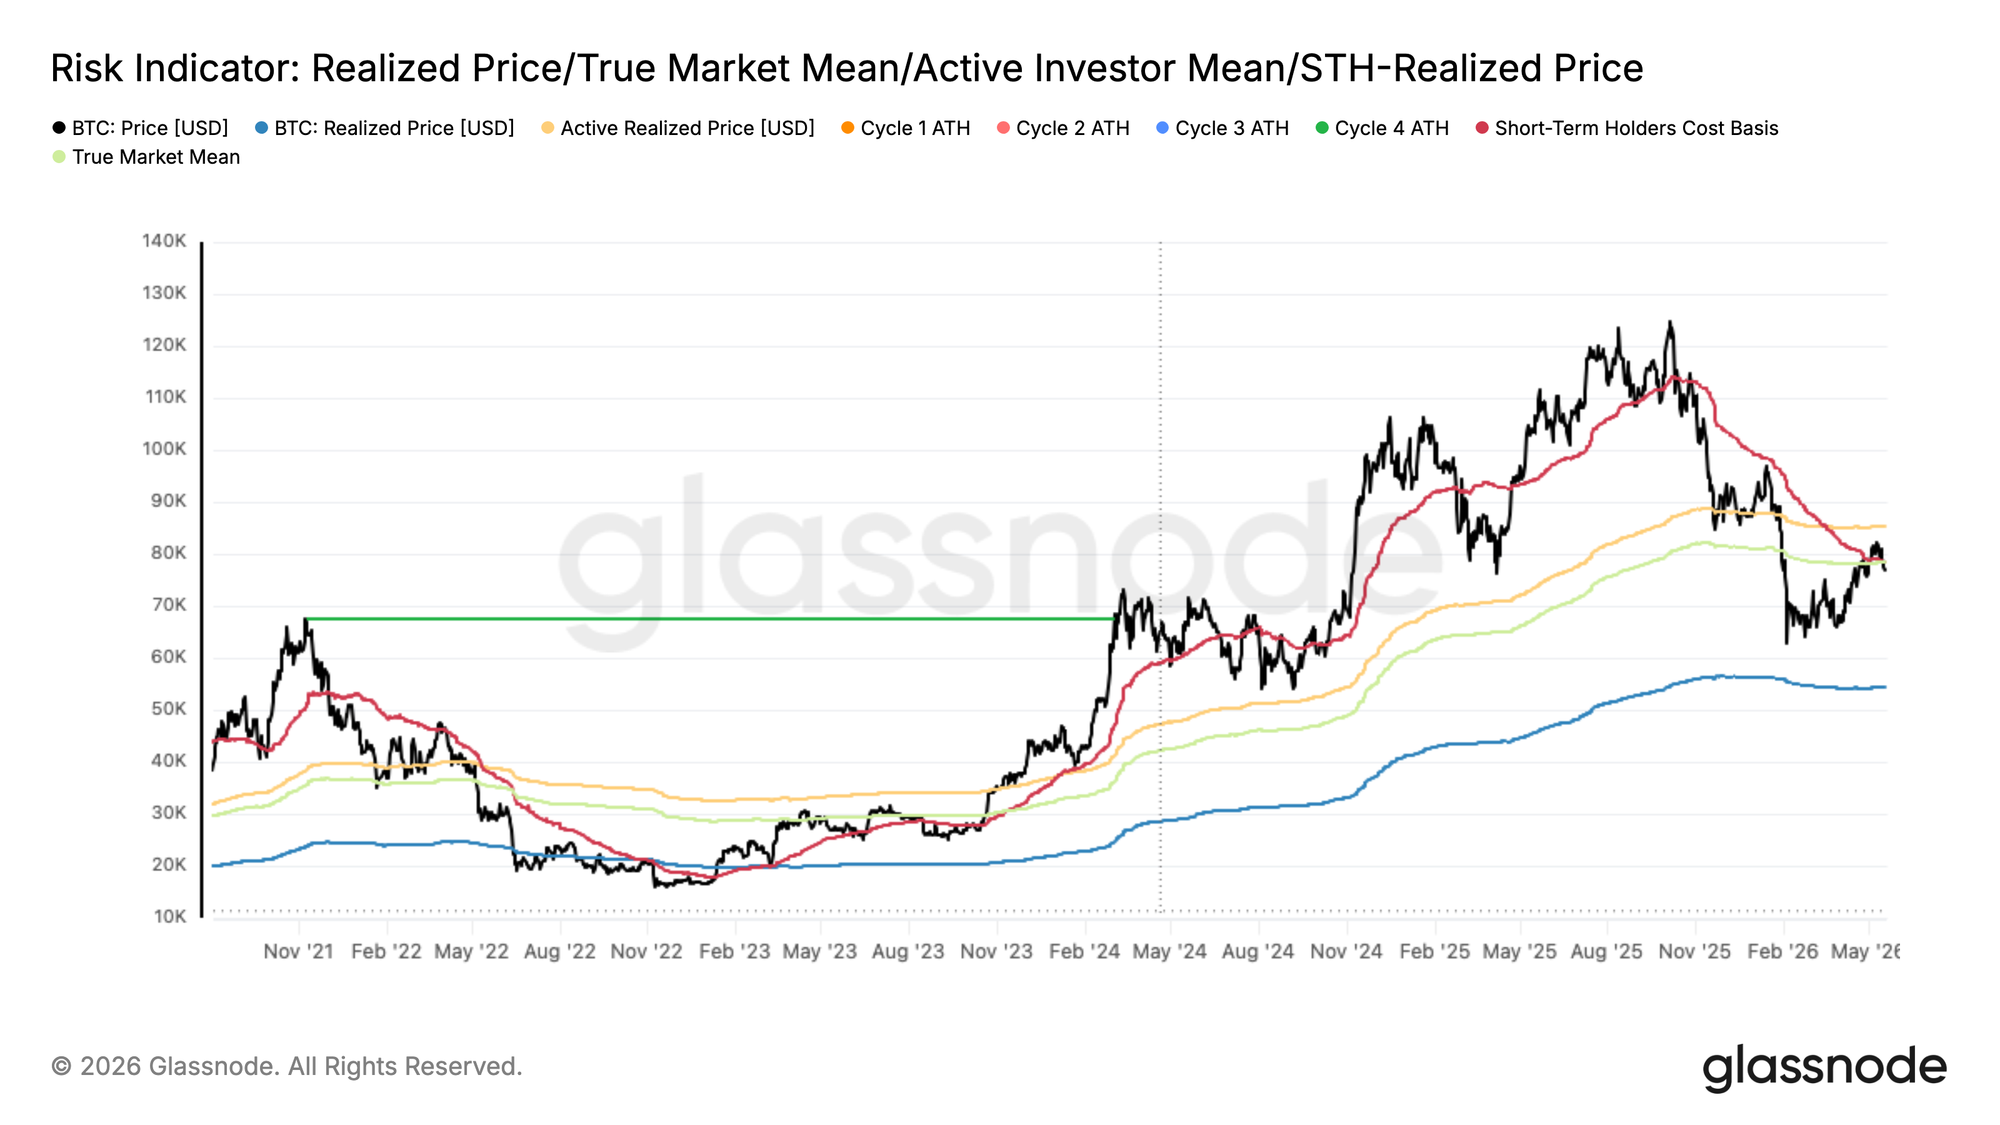
Glassnode chart (Week On‑chain, May 20, 2026) showing realized price / True Market Mean and related on‑chain indicators — illustrates that the recent rebound failed to sustain above the market’s True Mean, supporting the argument that the $63K move lacked broad spot demand. — Source: Glassnode Research
Position Sizing and Execution in a Fragile Tape
- Size down and lengthen horizons. In elastic markets dominated by flow, smaller positions with wider invalidation reduce the odds of being chopped out.
- Favor spot or low leverage. Let the market prove it has staying power via spot metrics before layering on leverage.
- Execute with limits near liquidity. Use resting bids around visible depth rather than market orders into thin books.
- Stage entries. Leg into positions over multiple sessions to average execution and read follow‑through.
- Define invalidation, not targets. Decide what flow or price behavior would tell you the thesis is wrong — then act on it.
- Mind calendar catalysts. Macro prints, listing changes, and product launches can shift flows abruptly; avoid maximum exposure into binary events.
None of this is financial advice. Crypto markets are volatile and subject to smart‑contract, custody, regulatory, and venue risks. Only risk what you can afford to lose.
Common Mistakes Traders Make After a Short Squeeze
- Confusing liquidation spikes with sustainable demand. A squeeze shows shorts covering, not necessarily new investors buying.
- Ignoring ETF flow direction. One green day after a long redemption streak isn’t a trend.
- Over‑reading derivatives. Funding flipping positive is less meaningful than spot CVD turning higher.
- Chasing thin books. Market orders in illiquid moments can move the tape against you by more than expected.
- Forgetting execution costs. Slippage and spread widen during volatility — budget for them.
- Anchoring to round numbers. Levels like $63K matter less than whether buyers actually absorb supply there.
If you want steady, market‑structure‑first coverage of crypto flows, Crypto Daily’s desks monitor ETF prints, liquidity shifts, and on‑chain context across sessions. You can follow our reporting at Crypto Daily.
Frequently Asked Questions
Does a short squeeze mean the bottom is in?
No. A squeeze removes bearish positioning but doesn’t create lasting demand. For a more reliable bottoming process, look for sustained ETF inflows, improving spot CVD, and thicker order books that hold during pullbacks.
Which ETF flow signals matter most?
Consecutive days of net creations across the largest issuers, shrinking ETF share discounts to NAV, and consistent end‑of‑day inflows. A single small inflow after a long outflow streak is encouraging but inconclusive.
How does All‑Exchange Spot CVD help?
Spot CVD aggregates net buying versus selling across exchanges. A rising profile during up‑moves suggests real spot demand. Glassnode highlighted a negative bias into May’s pullback, a cautionary sign until it reverses (Glassnode Research).
Why did ETF AUM drop so sharply?
Price declines and net redemptions both reduce AUM. During May 15–June 3, reported BTC ETF assets fell from about $104.29B to roughly $80.40B by June 4, reflecting both effects (CoinDesk).
Is low realized volatility bullish or bearish here?
Context matters. Around $63K, low 30‑day realized vol (~27% in May per Glassnode) with weak spot CVD can indicate distribution or range‑trading rather than accumulation. If spot demand improves, a measured rise in realized vol often accompanies healthier uptrends.
What’s a simple way to manage risk around $63K?
Trade smaller, prefer spot or low leverage, place limits near visible depth, and pre‑define invalidation. Avoid adding size into binary macro or regulatory events that can shock flows.
Disclaimer: This article is provided for informational purposes only. It is not offered or intended to be used as legal, tax, investment, financial, or other advice.

Related Stories