Bitcoin About to Confirm Major Trendline Breakout After $64K Dip: Upside Next?
 Laurie Dunn

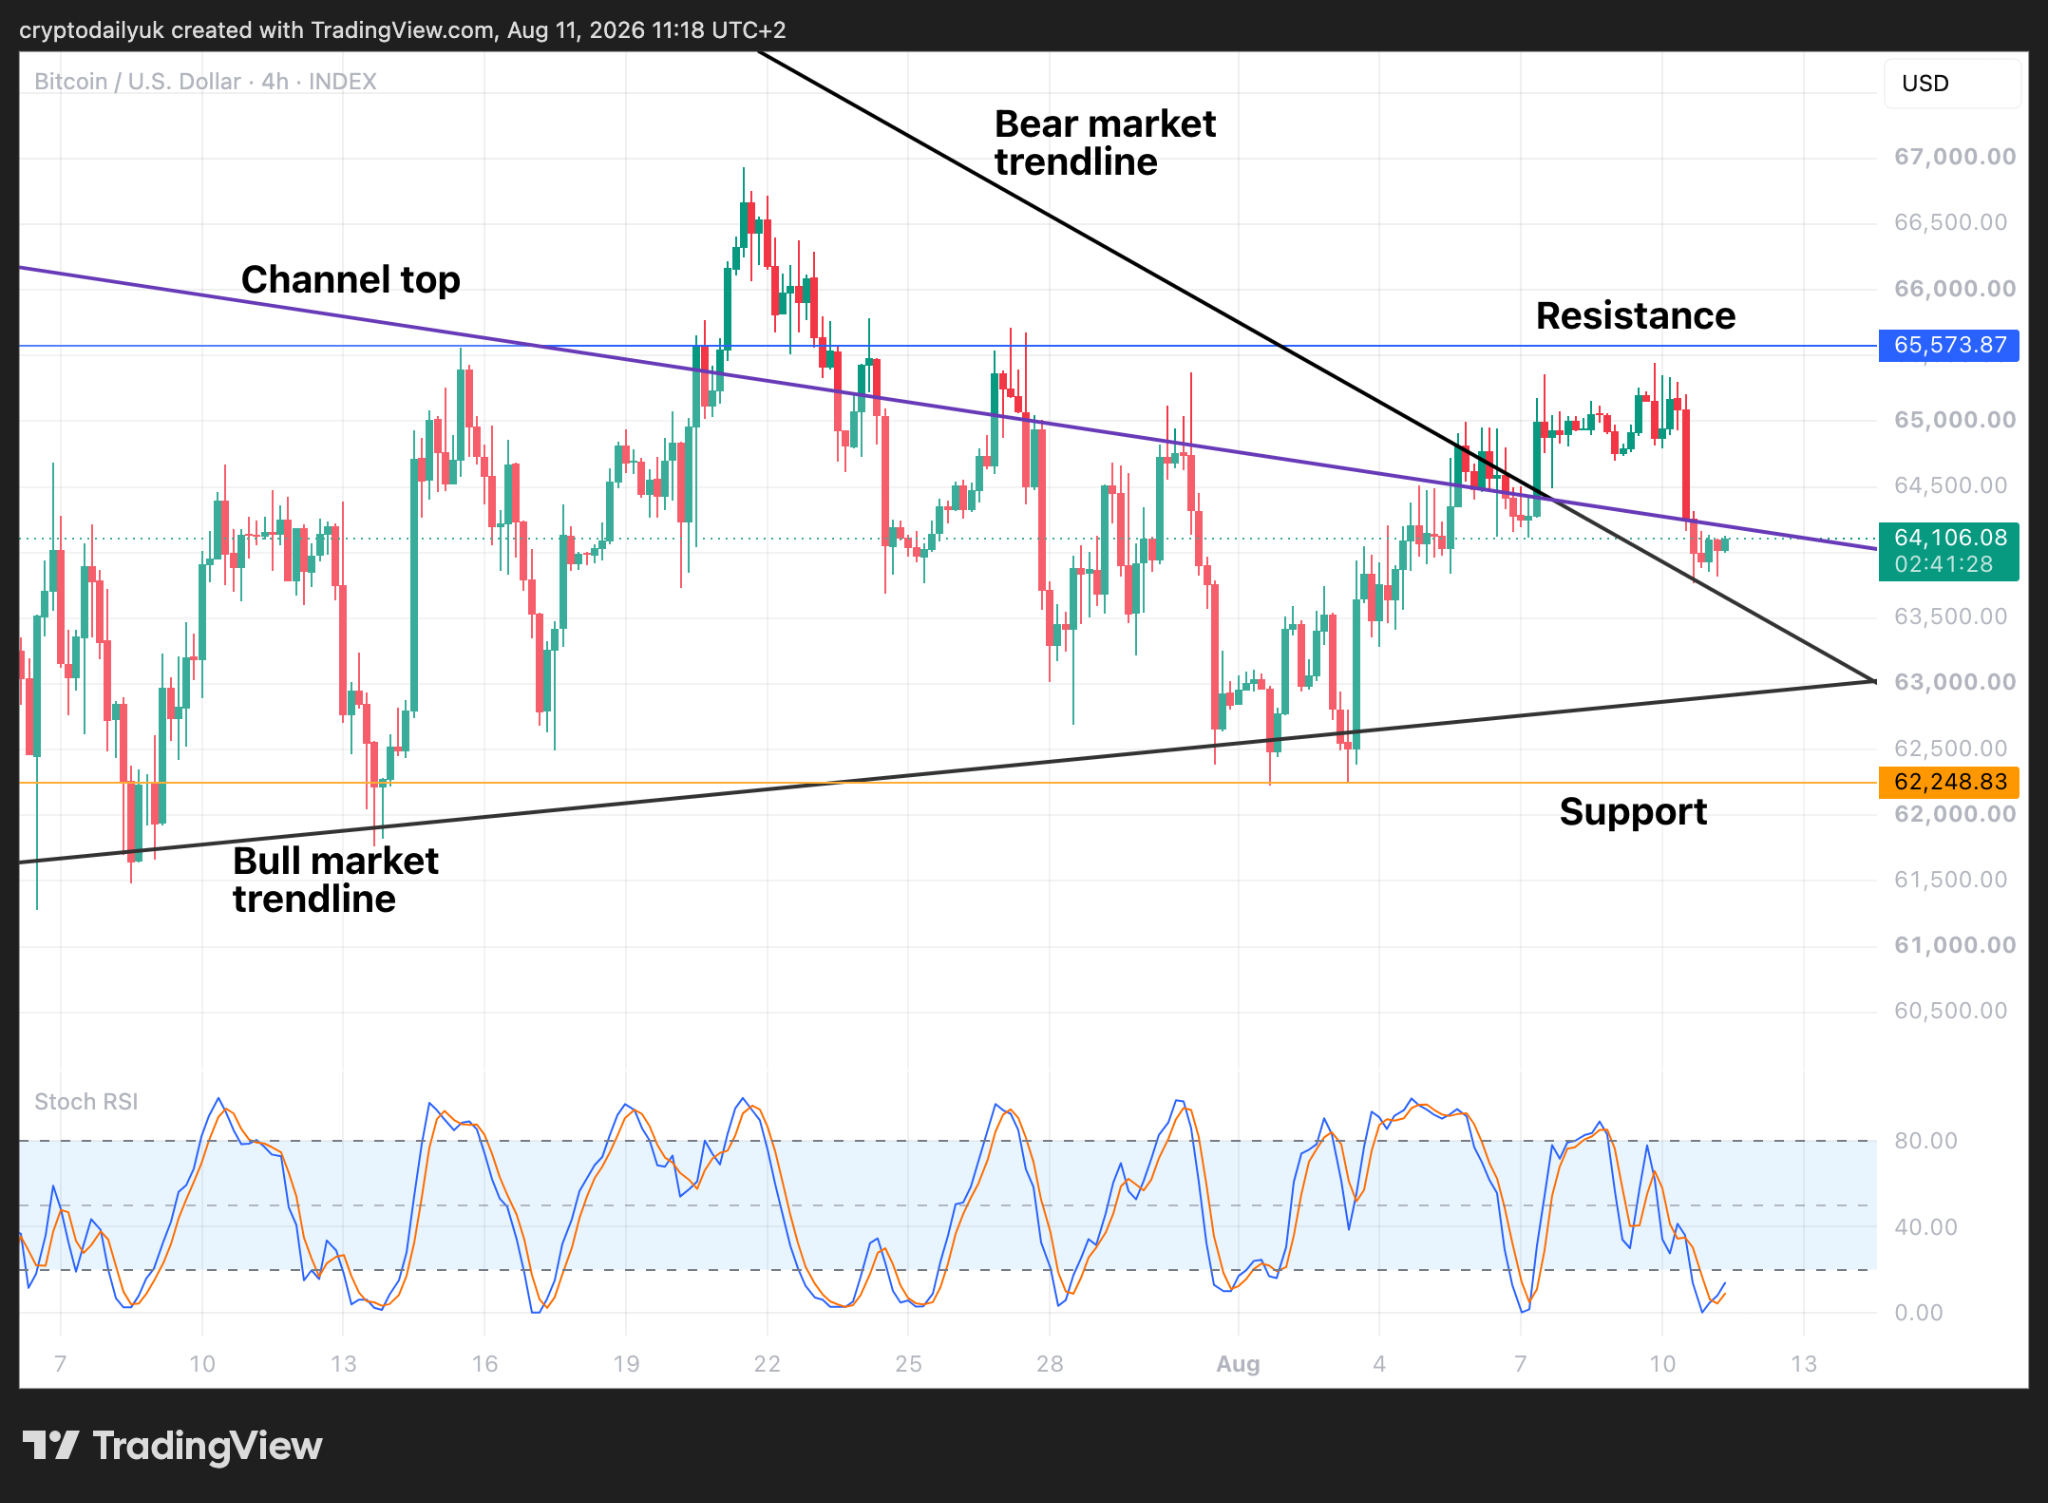
Stopping just short of the major $65,600 horizontal resistance level, the $BTC price briefly dipped below $64K before steadying on top of the bear market trendline. If this trendline breakout is confirmed in the daily time frame, we might expect a return to the upside and a potential breakout of the major overhead resistance.
Source: TradingView
From the recent local top down to just tag and confirm the bear market trendline as support, the $BTC price fell 2.5%, equating to around $1,650, so a fairly reasonable correction. The 4-hour and 8-hour Stochastic RSI indicator lines have reached bottom and are in the process of bouncing back. All would seem set for a return to the extremely important $65,600 horizontal resistance.
A clue to whether the bulls might manage to break the resistance this time round is if this bounce is a strong one. If the bounce is fairly weak and drifts off sideways before or as it reaches the resistance, we might see yet another failed attempt at this level.
Inverse head and shoulders bottoming pattern?
Source: TradingView
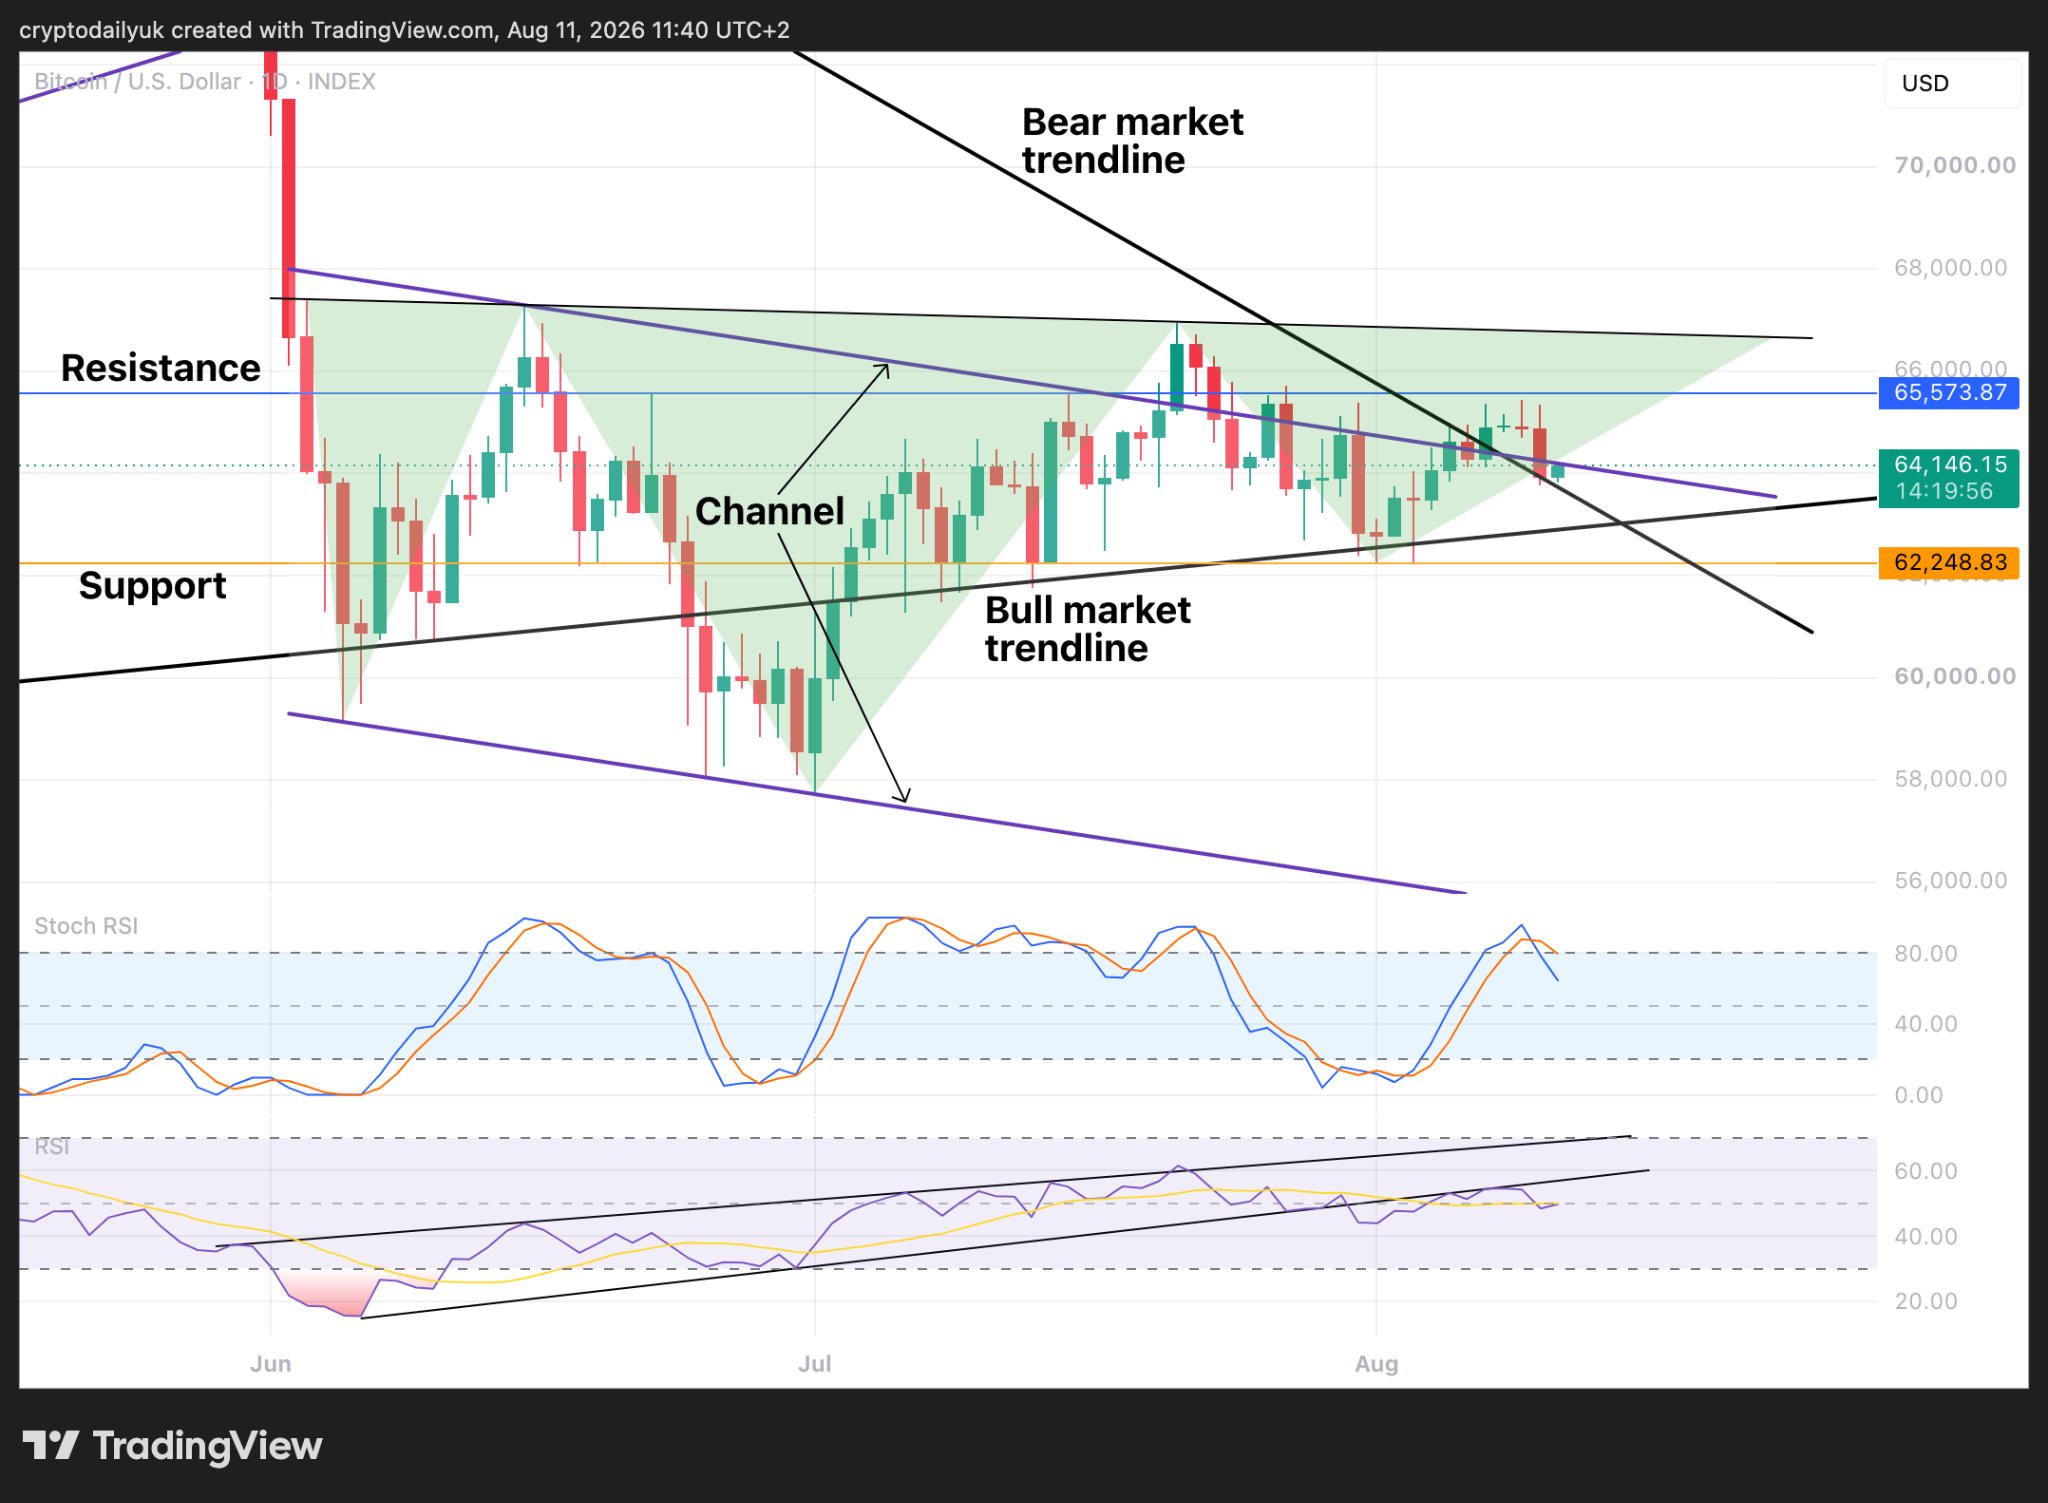
The daily chart reveals that an inverse head and shoulders pattern is still intact. This is a bullish pattern at the best of times, but if it is found at the foot of a big downturn it could be a reasonably reliable bottoming pattern. Of course, the pattern still needs to be completed, and this would be if the $BTC price came up to the neckline and formed the right shoulder. A break above with a confirmation might then lead to a recovery that becomes the beginning of the next bull market.
However, there are obstacles to overcome. Firstly, the price needs to get back above the top of the descending channel, and then the problematic resistance level at $65,600.
The bottom of the chart illustrates that the daily Stochastic RSI indicators have turned down, and in the RSI, the indicator line has been unable to get back into the rising wedge. The indicator line is generally still climbing though.
We have a breakout!
Source: TradingView
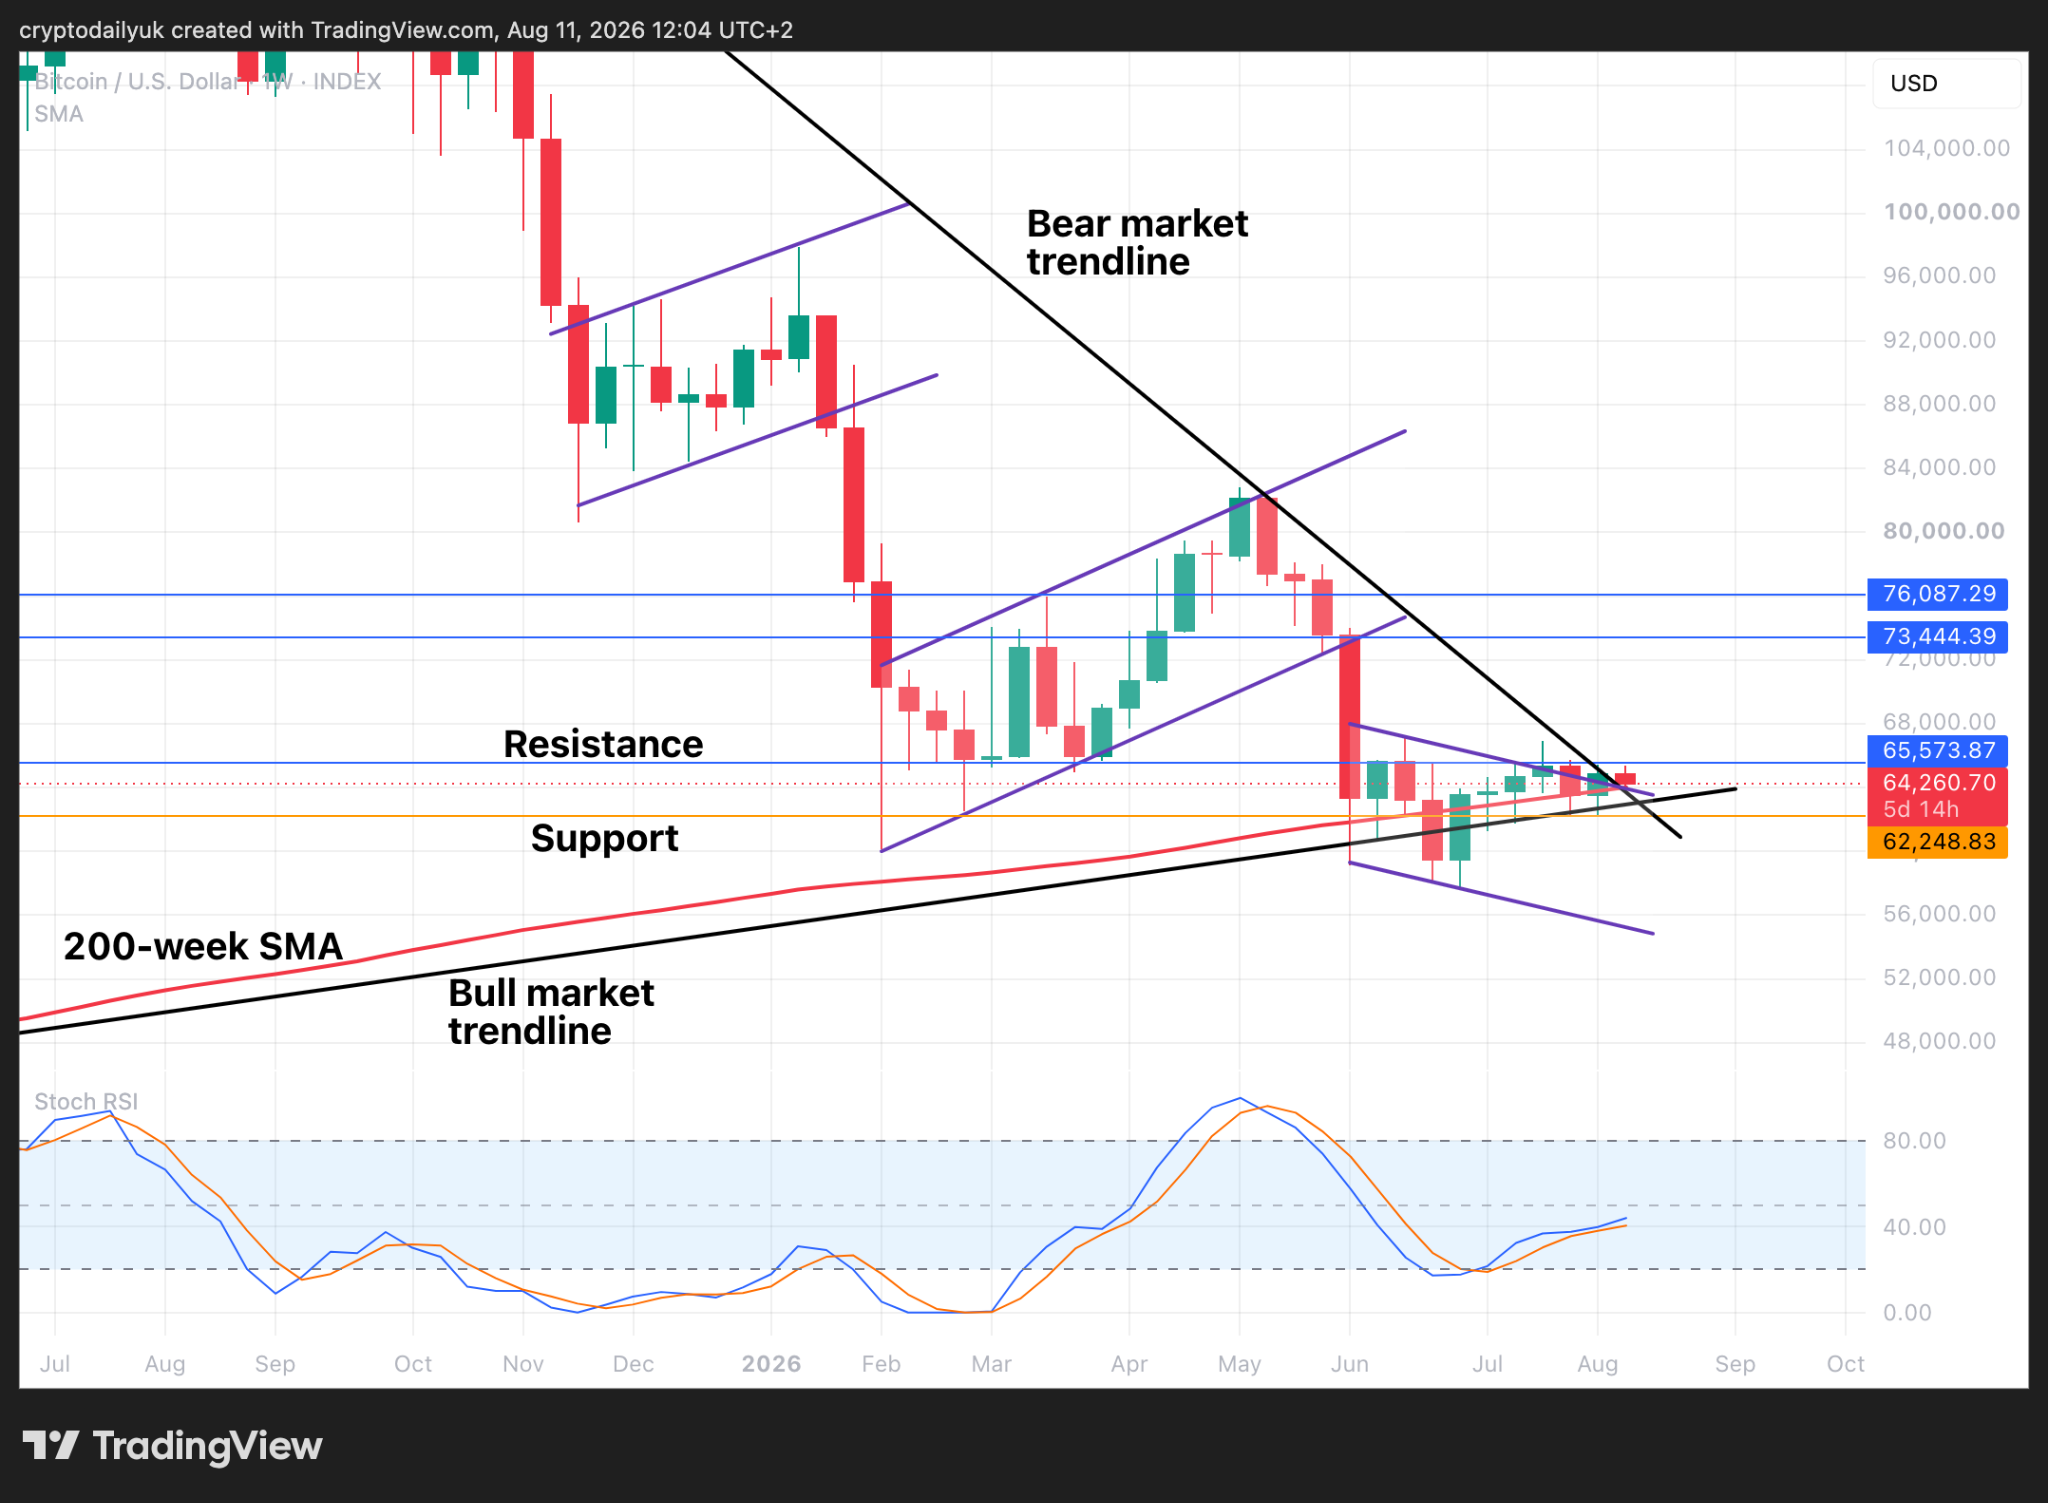
The weekly chart shows us that we have the breakout - at least the first breakout which is of the bear market trendline. The next really important one is that stubborn $65,600 resistance level. If this can become support, it should open the range high to at least $73,400.
The last high at $83K would be a target, that if attained and held above, would probably spell the end of the bear market, although officially this would not happen until the high at $97K was overcome.
Can the $BTC price get above the major horizontal resistance by the end of this week? If it does, perhaps fireworks might finally start going off.
Disclaimer: This article is provided for informational purposes only. It is not offered or intended to be used as legal, tax, investment, financial, or other advice.
Related Stories