Can Bitcoin Escape the Bear Market? The Moment of Truth Has Arrived
 Laurie Dunn

Just over 300 days since the bear market began at the $126K top, the $BTC price has another chance to pierce through the bear market trendline. Do the bulls have enough in the tank for the breakout, or could a rejection send the bulls home to think again?
A breakout in the next hour or so?
Source: TradingView
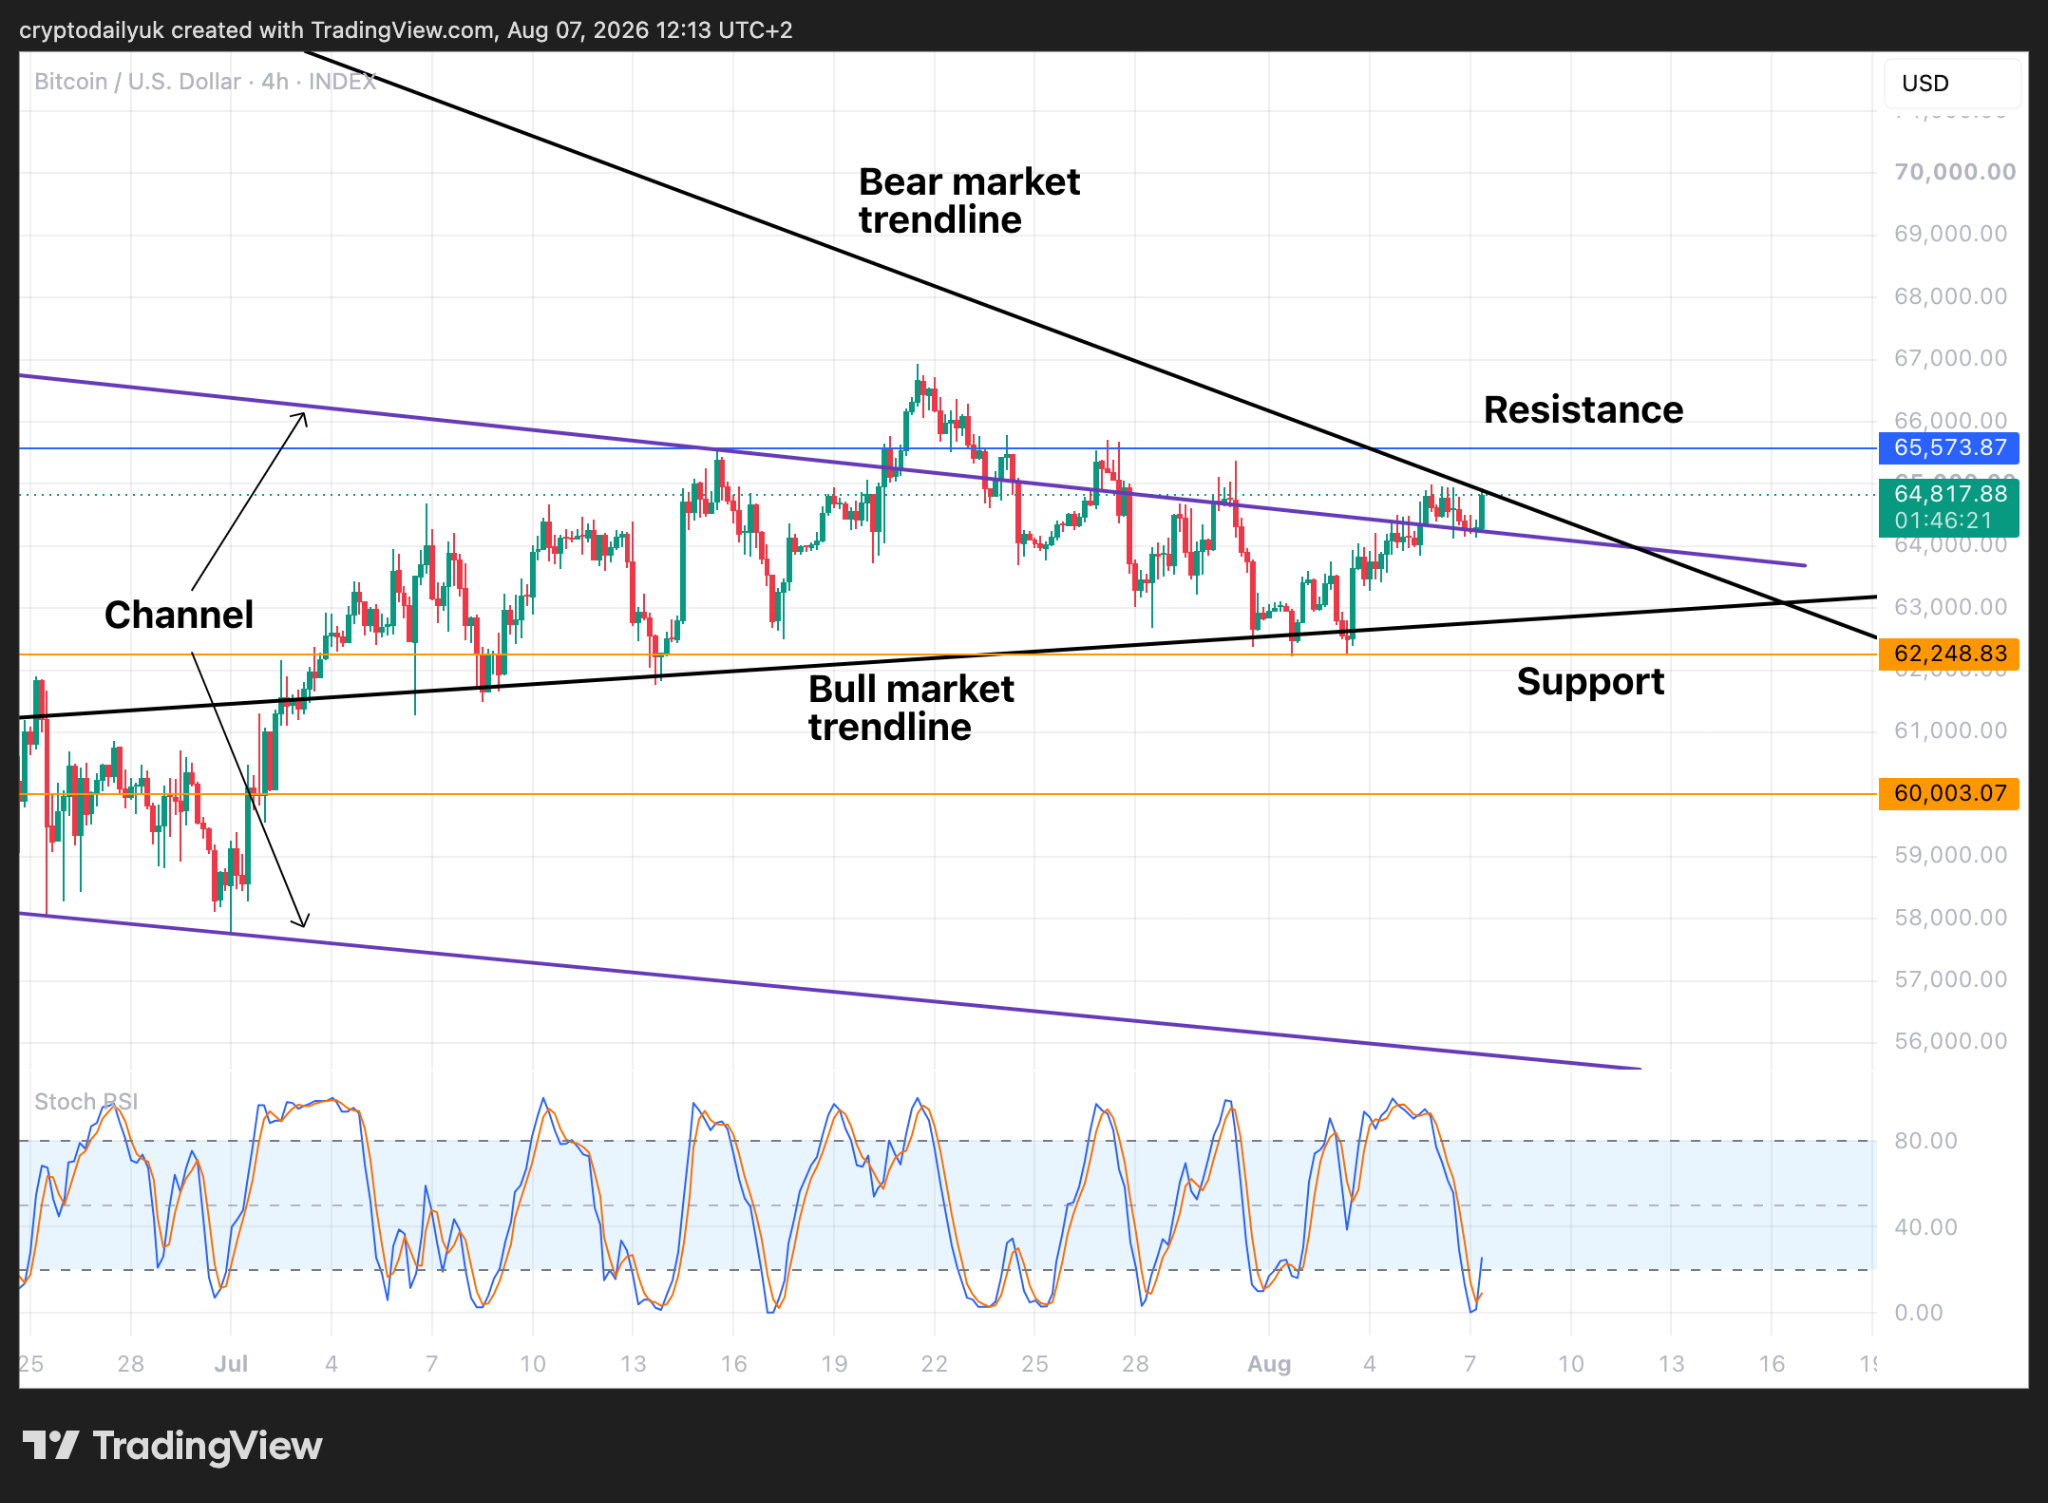
The short-term time frame reveals how the bear market and the bull market trendlines have arrived at a meeting point which would have the $BTC price forced to the upside or downside by mid-August. However, it can be seen that the price is currently right up against the bear market trendline. Within the next hour or so a breakout could occur, with a new 4-hour candle on the other side of the trendline.
The Stochastic RSI indicator lines are at the bottom, have crossed up, and are about to add upside price momentum.
Inverse head and shoulders bottoming pattern still to complete
Source: TradingView
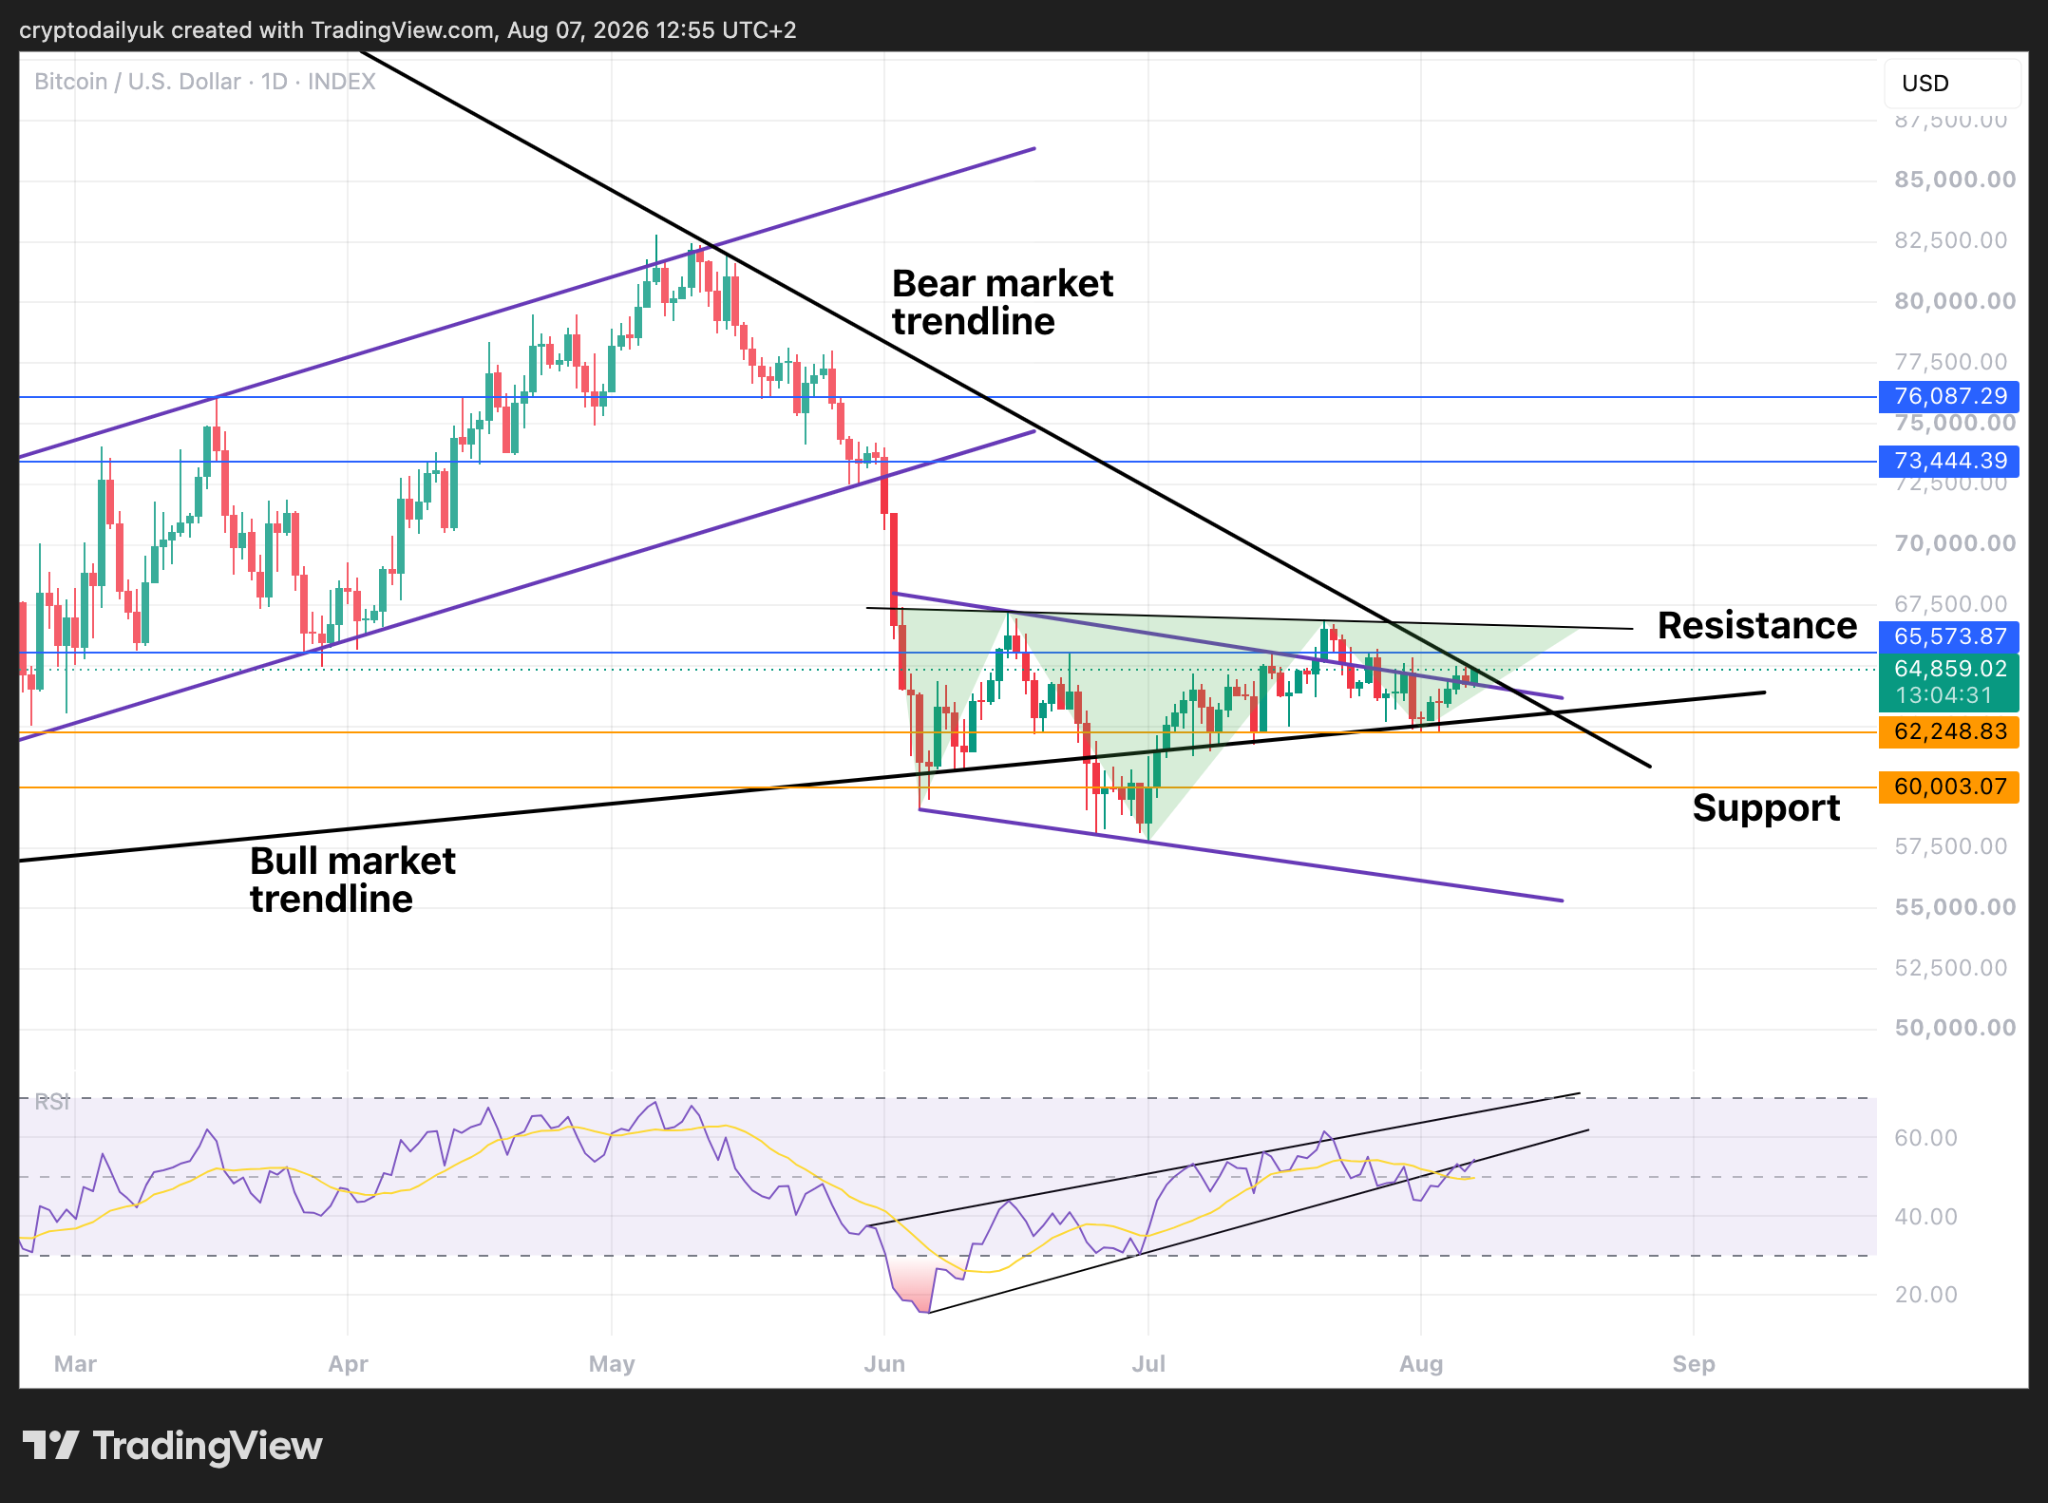
The daily chart shows how the inverse head and shoulders pattern is still in the process of playing out. Breaking through the bear market trendline will be absolutely essential for the pattern to complete. It’s just a case of waiting for that right shoulder to reach the neckline. If the $BTC price is rejected from here, there is still the possibility that the right shoulder could develop into a bigger one and still form the pattern. This remains to be seen.
At the bottom of the chart the rising wedge pattern in the RSI is also at a critical stage. The indicator line dropped out of the bottom, but has since come back to the underside of the wedge. If it pushes back inside, the breakout in the price action is a good probability. If it is rejected, the price action is likely to suffer the same fate.
This weekend is critical
Source: TradingView
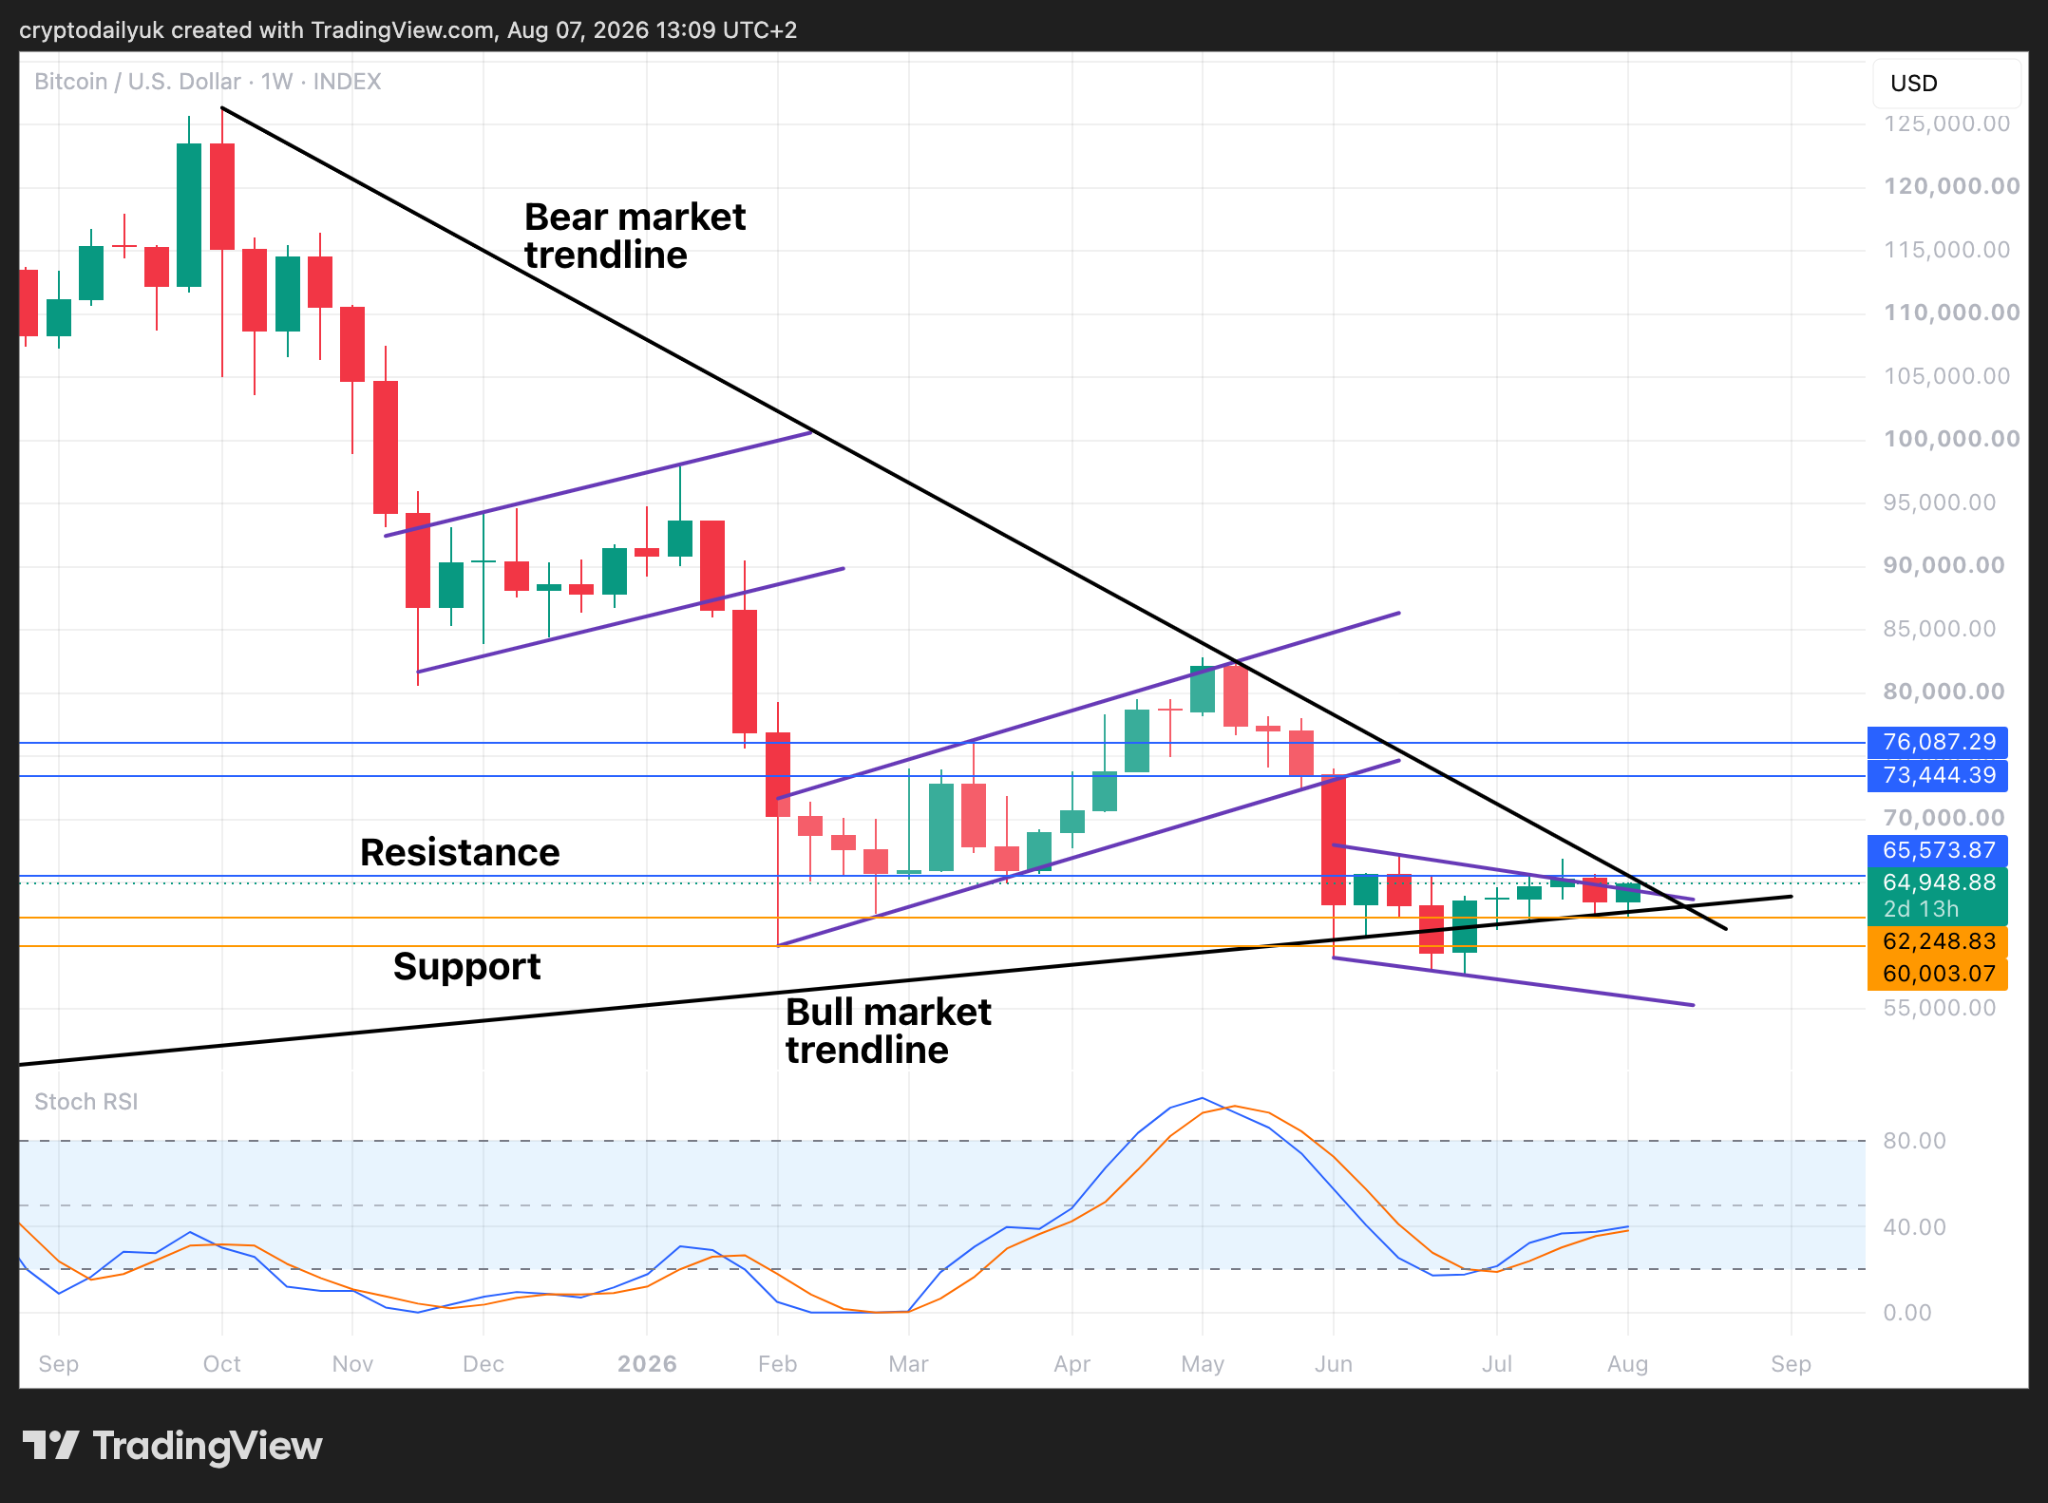
Are we looking at the bottom of this bear market in the above weekly chart? If the $BTC price stays at its current level until the end of the week, the following weekly candle is going to be on the other side of the trendline, and the breakout will have taken place.
If on the other hand the price sinks instead, there is still the possibility of one more weekly candle before the big breakout happens, whether that is to the up or downside.
To sum up, at the beginning of this week things were looking bearish indeed as a sweep down to $62K left the bears looking pretty smug. Notwithstanding, a rally back to the top of the channel and the possibility to break out of this bear market is back on the table. This weekend could be critical.
Disclaimer: This article is provided for informational purposes only. It is not offered or intended to be used as legal, tax, investment, financial, or other advice.
Related Stories