Polkadot Price Analysis: DOT Struggles To Reclaim $7.50 As Bears Push Back

The Polkadot (DOT) price registered a sharp drop on Tuesday after a strong showing over the weekend, culminating in DOT reaching a high of $7.78 on Monday.
DOT has seen a considerable uptick in recent sessions, but the bullish momentum has been insufficient to break the resistance at $7.50, and we could see a short-term consolidation before another uptick.
Polkadot (DOT) Eyes $7.50 Again
Looking at the Polkadot (DOT) price chart, we can see that DOT registered a sharp increase on Monday (20th), going from $6.92 to $7.58, with support building at the 20-day SMA. This price increase also saw DOT surge past the 50- and 200-day SMAs. Tuesday saw a highly volatile session as sellers looked to control the session. However, the price held firm above the 200-day SMA, registering a marginal increase of 0.53%.
However, selling pressure increased exponentially on Wednesday (22nd) as DOT fell by 2.10% to $7.46 but managed to stay above the 200-day SMA. This level was broken on Thursday as sellers pushed DOT to as low as $6.91, taking it below four crucial levels. However, DOT was able to make a recovery of sorts and climb back above $7, eventually settling at $7.20. Friday saw another volatile session, but with the 50-day SMA acting as support and buyers entering the market at this level, DOT was able to register an increase of 0.69%, breaking the bearish momentum.
The weekend saw DOT extend its gains as it rose by 2.34% on Saturday and 1.75% on Sunday to end the weekend at $7.55. The weekend also saw DOT push above the 200-day SMA. DOT continued its bullish momentum on Monday in yet another volatile session that saw the price drop below the 200-day SMA before recovering and settling at $7.63, bringing it to a crucial resistance level.
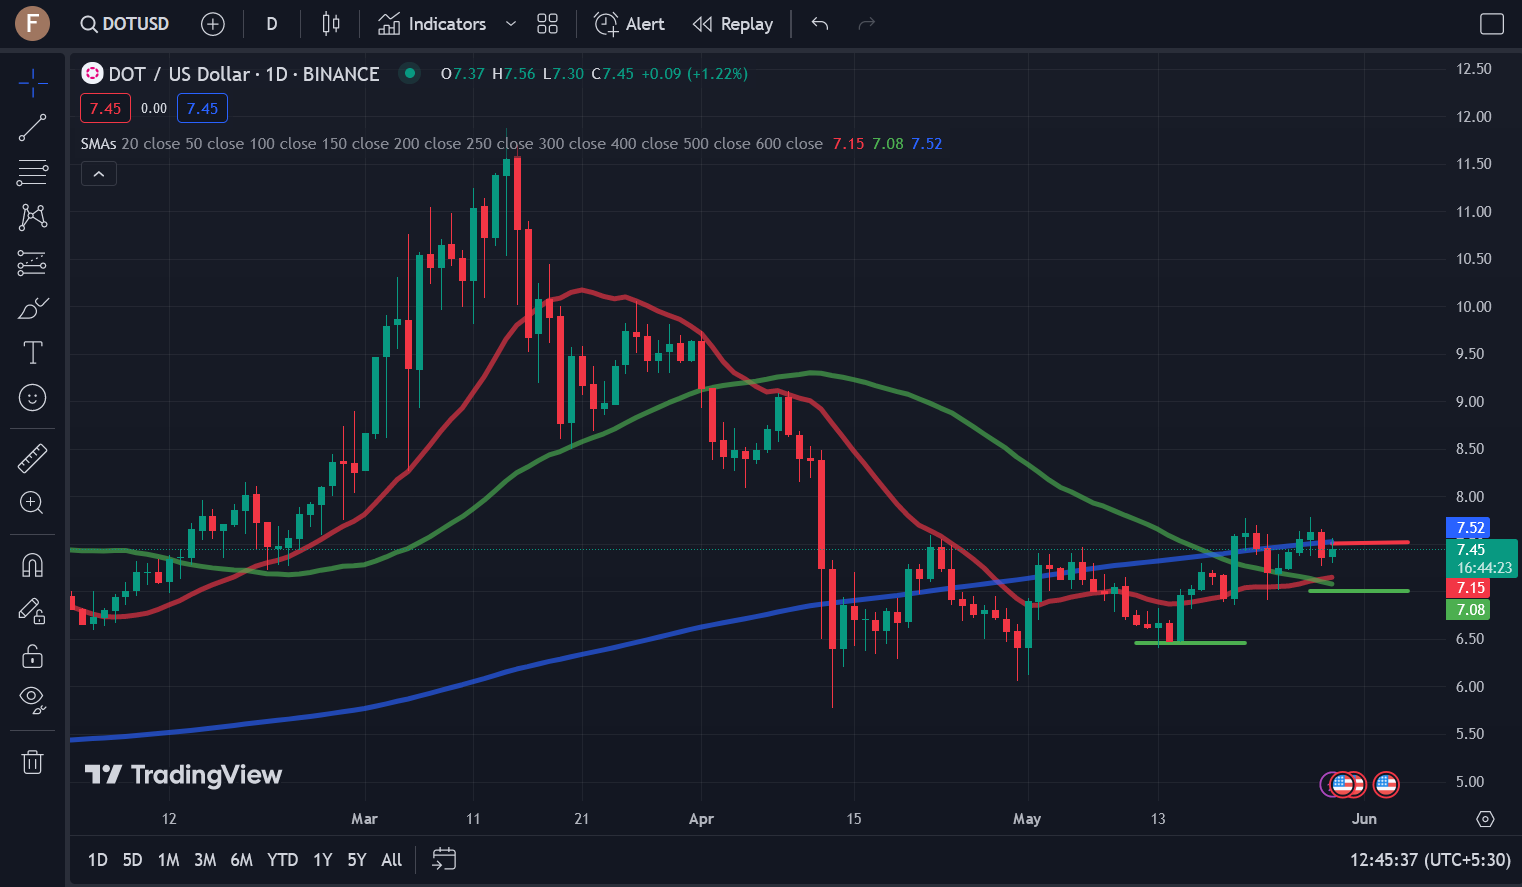
Source: TradingView
However, as it had done in the previous week, DOT was unable to break past this level and fell by 3.54% on Tuesday. It went back below the 200-day SMA and settled at $7.36. In the current session, DOT is trading at $7.44 as buyers look to retest the resistance at the $7.50 level.
An Imminent Breakout Or Waning Bullish Momentum?
Looking at the Polkadot (DOT) price chart, we can see the levels of support and resistance. DOT retains strong support at $6.40, which is responsible for a considerable resurgence in demand. There is also support building at $7, with strong resistance at $7.50, where the 200-day SMA is currently positioned. The DOT price chart indicates that DOT could test this resistance level again. If DOT can break past this level, we could see bullish sentiment persist, with DOT potentially rising to $8.
However, if buyers face challenges and are unable to move past this level, we could see a period of sideways consolidation coupled with marginal rejections before we see any decisive price movements. If DOT sees a decline, we could see the price drop to $7.10 in the short term. At the time of writing, DOT has moved to $7.49 as buyers look to test $7.50 once again.
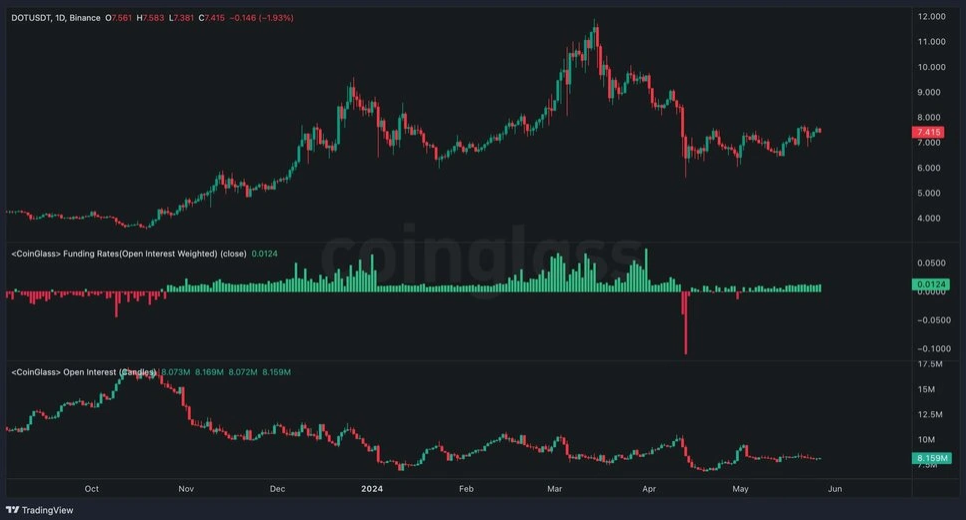
Looking at the funding rate and open interest chart, we can see that despite DOT’s bullish momentum, open interest and funding rates have not significantly increased, indicating the possibility of a consolidation correction and suggesting that market participants have not increased their long positions significantly. This could indicate that DOT may enter a period of sideways consolidation if it is unable to break past $7.50 before establishing its next decisive price movement.
Disclaimer: This article is provided for informational purposes only. It is not offered or intended to be used as legal, tax, investment, financial, or other advice.

Related Stories