Bitcoin (BTC) Price Analysis: Higher Lows Add to Bullish Bias – 8 November 2023
Bitcoin (BTC) Price Analysis: Higher Lows Add to Bullish Bias – 8 November 2023
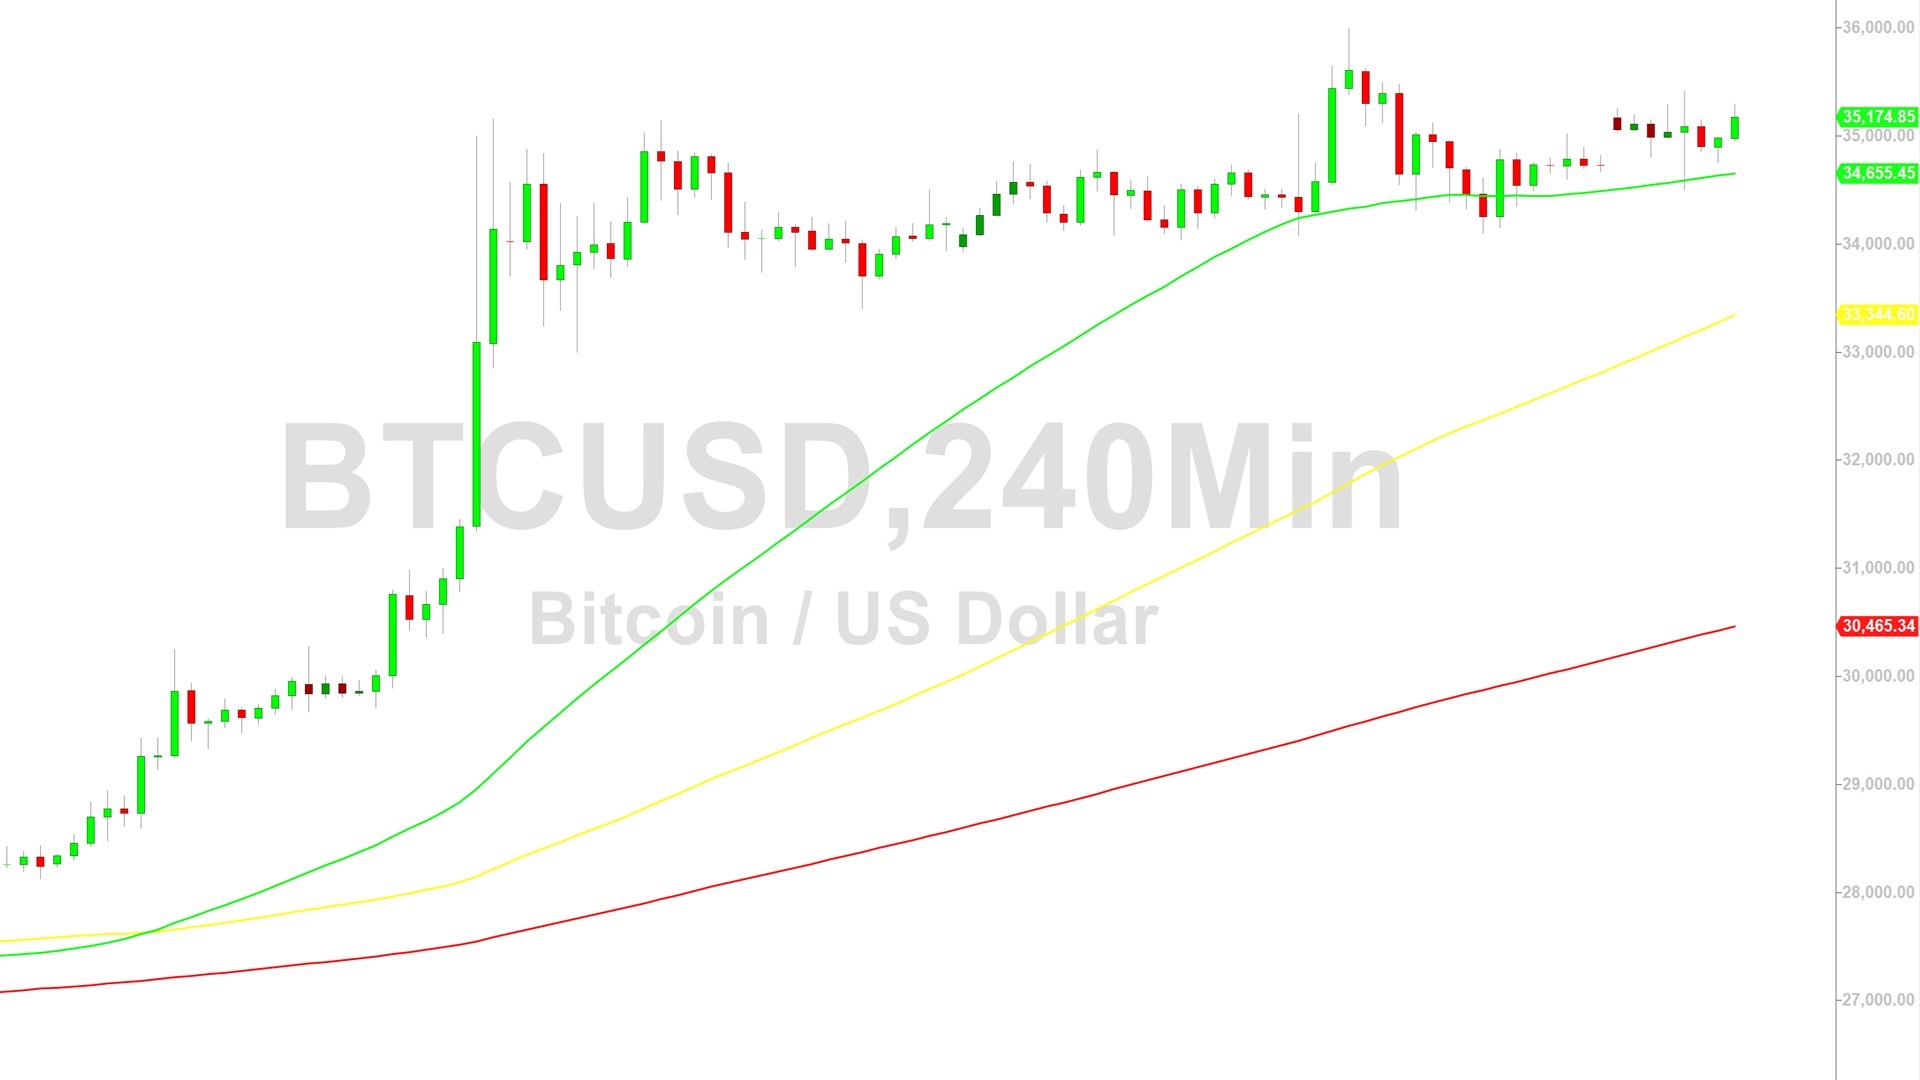
Bitcoin (BTC/USD) retained a positive technical bias early in the Asian session as the pair continued to trade above the 34129.25 area, representing the 23.6% retracement of the appreciating range from 28122.57 to 35997.80. A series of recent higher lows suggests positive range expansion may continue above recent 18-month highs around the 35997.80 level, its strongest print since May 2022. BTC/USD’s recent long-term high around this area represented a test of an upside price objective related to recent buying pressure around the 28122 and 32525 areas. The recent high also represented a test of the 50% retracement of a historical depreciating range from 69000 to 15460, and also represented a test of the 61.8% retracement of the depreciating range from 48240 to 15460.
Stops were also elected above the 34190.77 area during the ongoing appreciation to multi-month highs, a previous significant downside price objective related to historical selling pressure around the all-time high of 69000 and 59249 levels. Additional upside price objectives include the 36115, 36541, 36798, 37239, 37890, 38409, 38561, 38584, 39636, 40549, 40743, 40837, 41402, 43841, 43860, and 44269 levels. Following the surge higher, areas of technical support and potential buying pressure include the 33761, 33378, 32377, 31758, 31259, and 30448 levels. Traders are observing that the 50-bar MA (4-hourly) is bullishly indicating above the 100-bar MA (4-hourly) and above the 200-bar MA (4-hourly). Also, the 50-bar MA (hourly) is bullishly indicating above the 100-bar MA (hourly) and above the 200-bar MA (hourly).
Price activity is nearest the 50-bar MA (4-hourly) at 34661.93 and the 50-bar MA (Hourly) at 34923.27.
Technical Support is expected around 31238.97/ 30028.62/ 28818.26 with Stops expected below.
Technical Resistance is expected around 36541.57/ 37239.15/ 38584.16 with Stops expected above.
On 4-Hourly chart, SlowK is Bearishly below SlowD while MACD is Bullishly above MACDAverage.
On 60-minute chart, SlowK is Bullishly above SlowD while MACD is Bullishly above MACDAverage.
Sally Ho’s Technical Analysis
View Yesterday’s Trading Analysis
Disclaimer: Sally Ho’s Technical Analysis is provided by a third party, and for informational purposes only. It does not reflect the views of Crypto Daily, nor is it intended to be used as legal, tax, investment, or financial advice.

Related Stories