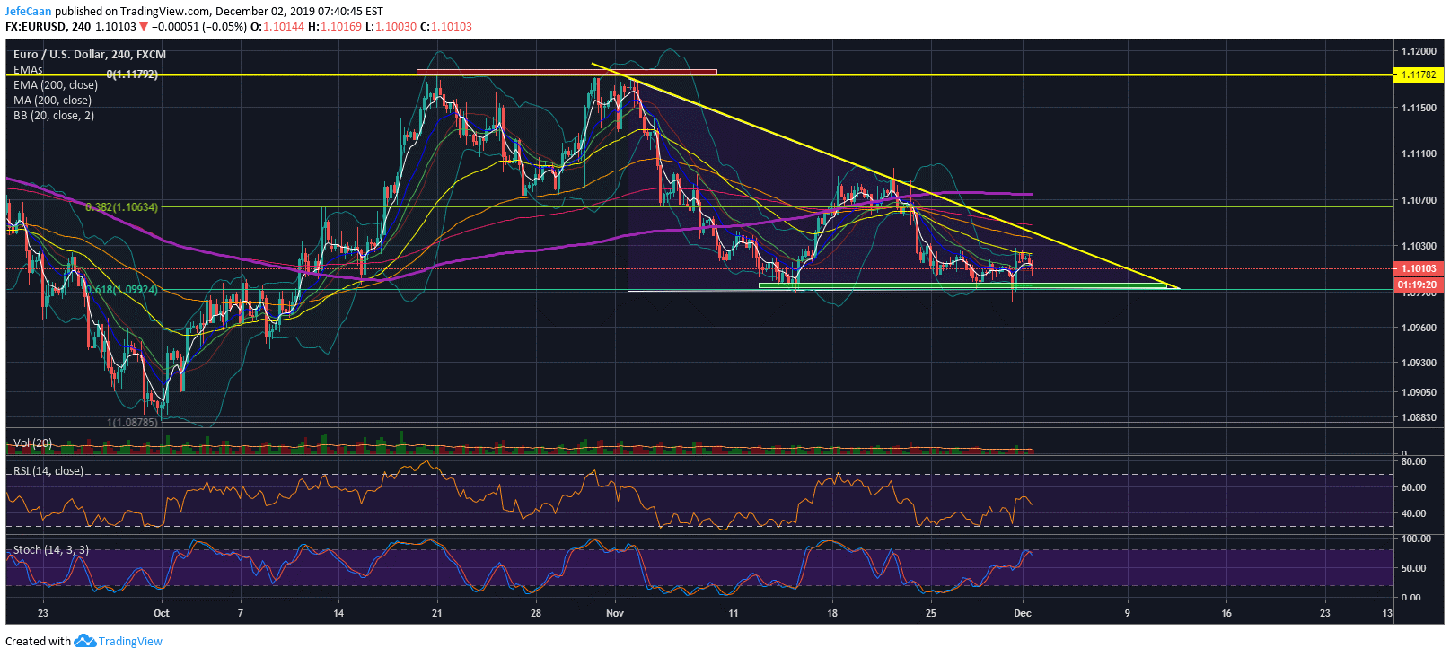
The Euro recent made a double bottom against the US Dollar which has now increased the probability of a move to the upside. However, as we can see on the 4H chart for EUR/USD, the pair is also trading within a descending triangle which could be broken to the downside. Descending triangles have a history of leading to further downside and if it happens in this case, we might see a decline below the 61.8% fib extension level which would be a very bearish development for BTC/USD. However, until that happens, there is the strong probability of a move towards the top of the descending triangle. We could also see a fake out that might see the descending triangle break to the upside followed by a decline below the 61.8%.

EUR/USD has had a strong impact on the price of Bitcoin (BTC) for as long as it has been around. Previously, this pair did not seem to affect BTC/USD much because Bitcoin (BTC) would make a lot of wild moves on its own. However, now that this market is maturing, we are seeing a strong correlation between this market, the EUR/USD forex pair and the S&P 500 (SPX). Movements on smaller time frames may not be affected as much but longer trends for BTC/USD are heavily influenced by movements in EUR/USD. The Euro usually serves as a leading indicator for Bitcoin (BTC). We have recently seen many instances of how BTC/USD has followed movements in the EUR/USD forex pair. It makes sense because Bitcoin (BTC) is paired to the US Dollar on the majority of exchanges. So, a rise or fall in the strength of the US Dollar directly affects Bitcoin (BTC).
If the EUR/USD forex pair trades between the 38.2% and the 61.8% fib levels, we would see similar sideways movement in BTC/USD as well. However, if EUR/USD breaks the descending triangle to the upside, we can expect a move towards the 200 MA in BTC/USD which would be slightly above $8,000. On the other hand, if EUR/USD breaks the descending triangle to the downside, we can expect a similar move in Bitcoin (BTC) down to the bottom of the falling wedge.
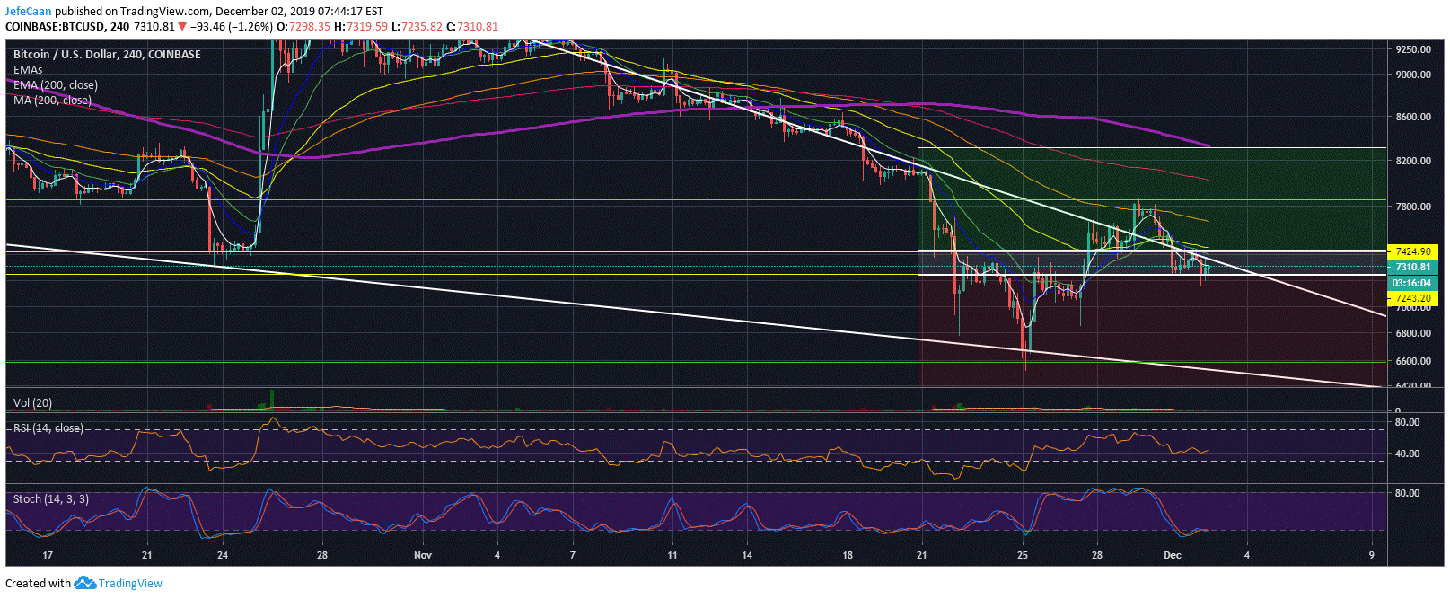
The 4H chart for BTC/USD shows that Bitcoin (BTC) is now very close to making that decision. Considering that the price has found support above $7,243 and has already completed a short term correction, we expect it to continue higher from current levels towards $8,000. However, we would have to wait for a confirmation of a break out of the falling wedge before entering any positions. If the price declines below the $7,000 mark, that would be a sign to look for bearish entries as it might decline to the bottom of the falling wedge before any bullish reversal.