Bitcoin hits bear market trendline – Rejection or New Bull Market Breakout?
 Laurie Dunn

The $BTC price just tagged the critical trendline that has kept the entire bear market below since the all-time high in October 2025. Do the bulls have what it takes to break through and confirm above, or is this perhaps the first run at a wall that will prove hard to break?
$BTC price arrives at breakout point
Source: TradingView
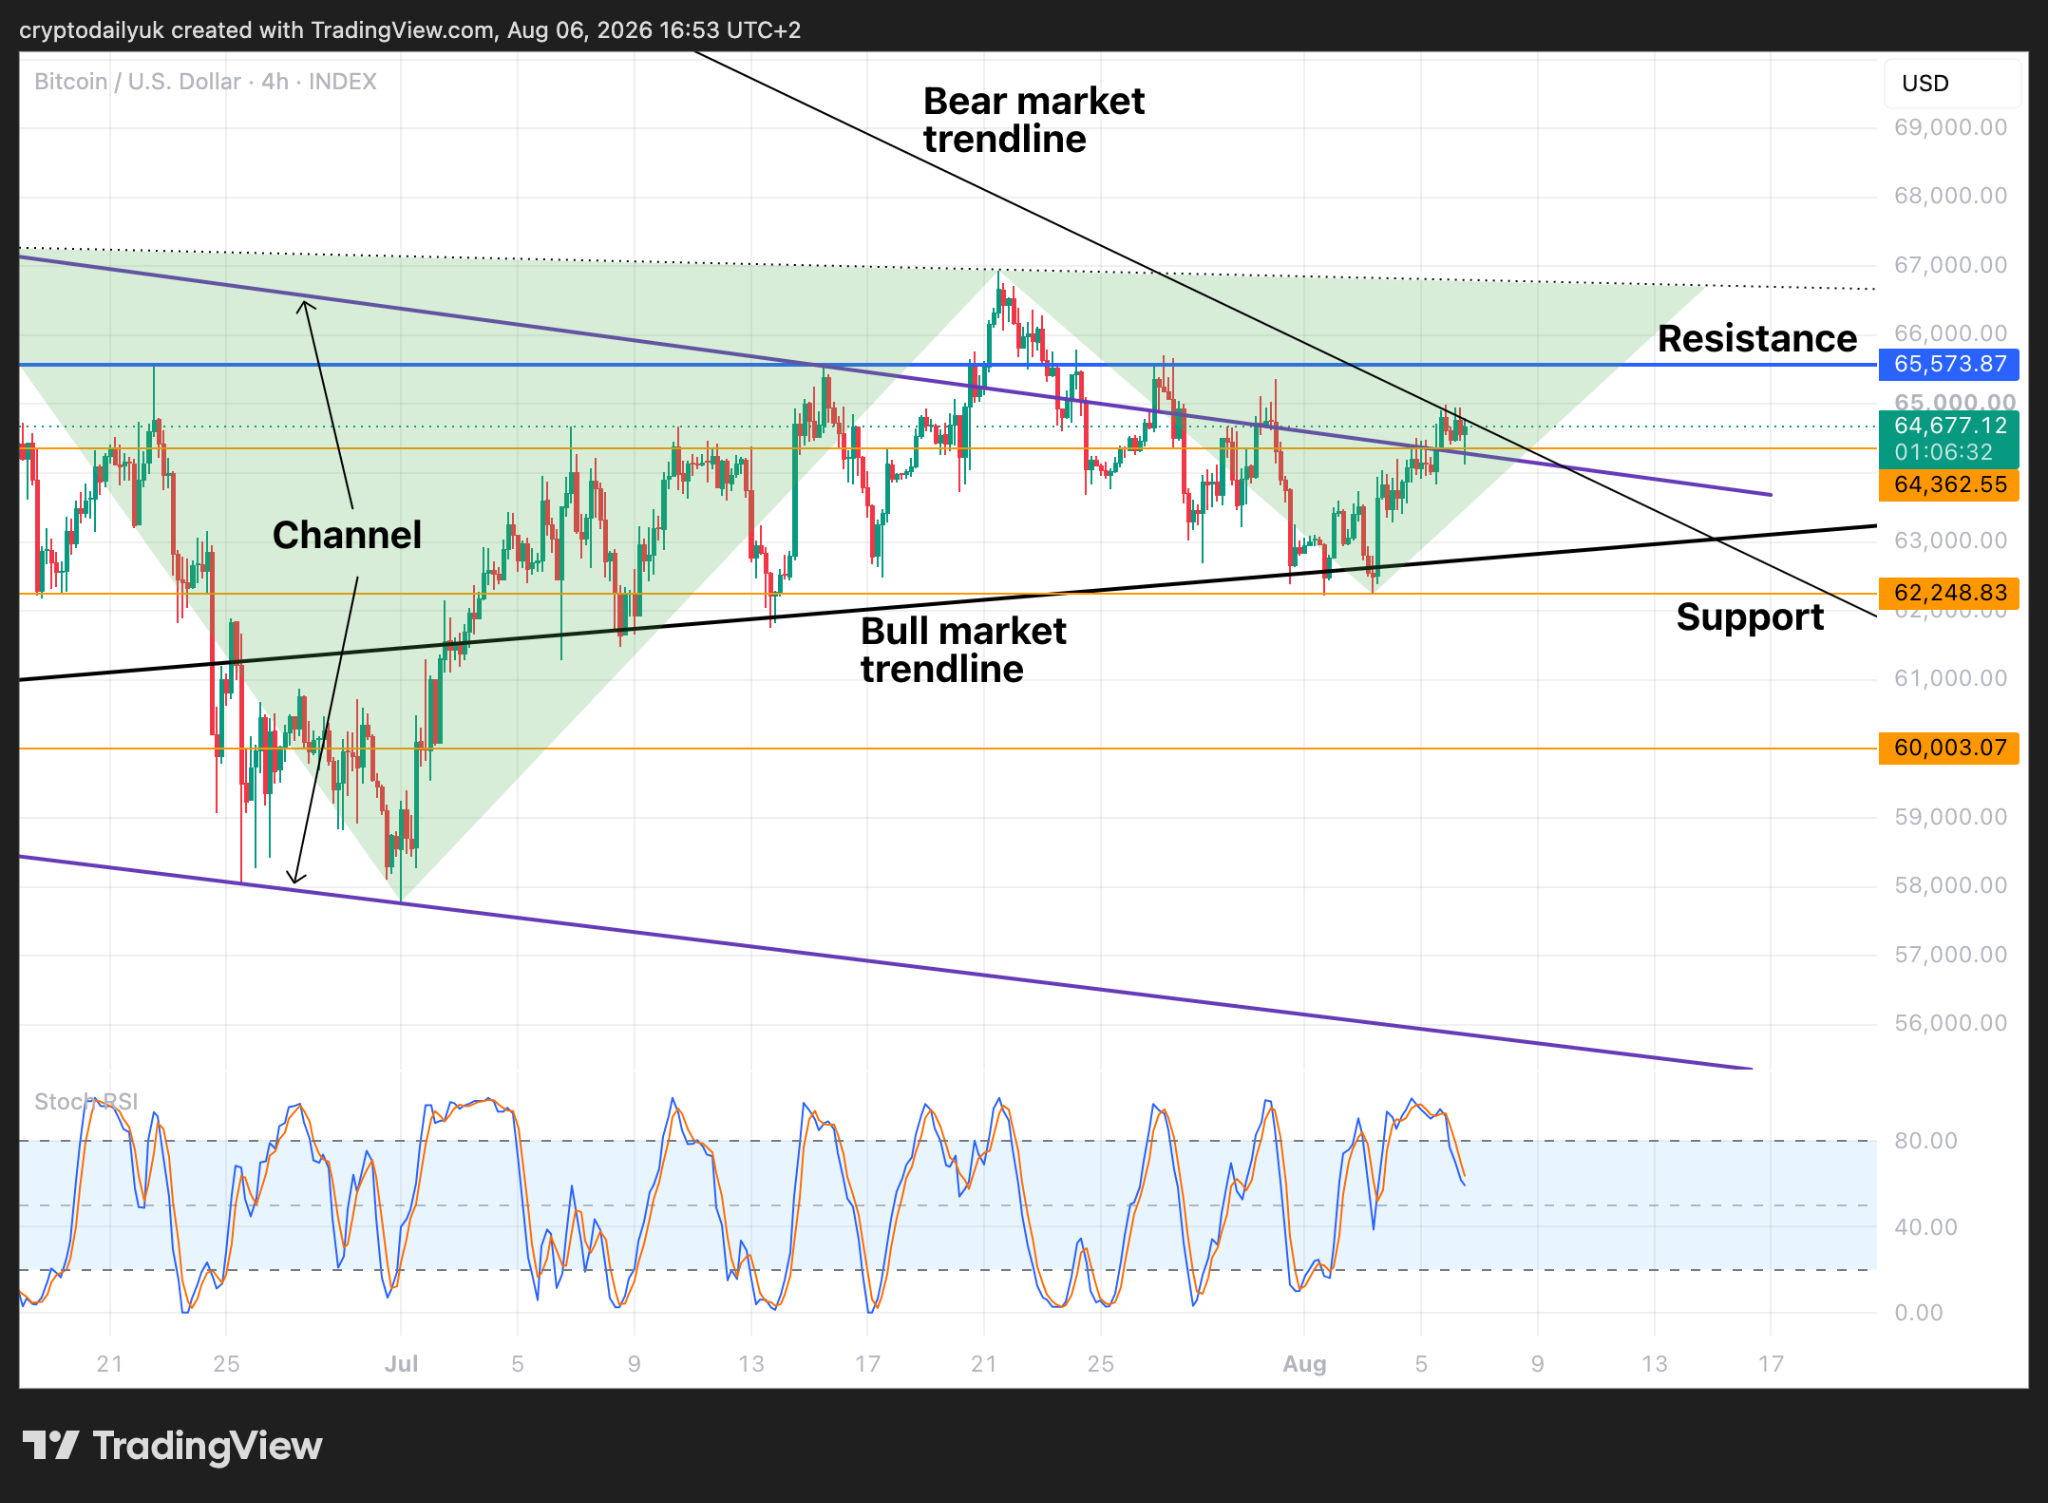
In the 4-hour time frame it can be observed that the $BTC price is right up against the bear market trendline. So far the price has bunched up underneath the trendline but has not broken through. Can the top of the descending channel plus the $64,360 horizontal level support the price enough to enable the breakout? This remains to be seen, but it shouldn’t be long before we find out.
If this major trendline does break to the upside, this could provide the momentum for the price to hit the big $65,600 resistance level. The $BTC price would not then be far from the neckline of the inverse head and shoulders pattern, and the completion of the right shoulder.
All that being said, shorter term price momentum is starting to top out. It may be that a rejection and a period of downward and sideways may be needed in order for the price momentum to turn to the upside again and have a better chance of breaking through.
A glorious new bull market beckoning?
Source: TradingView
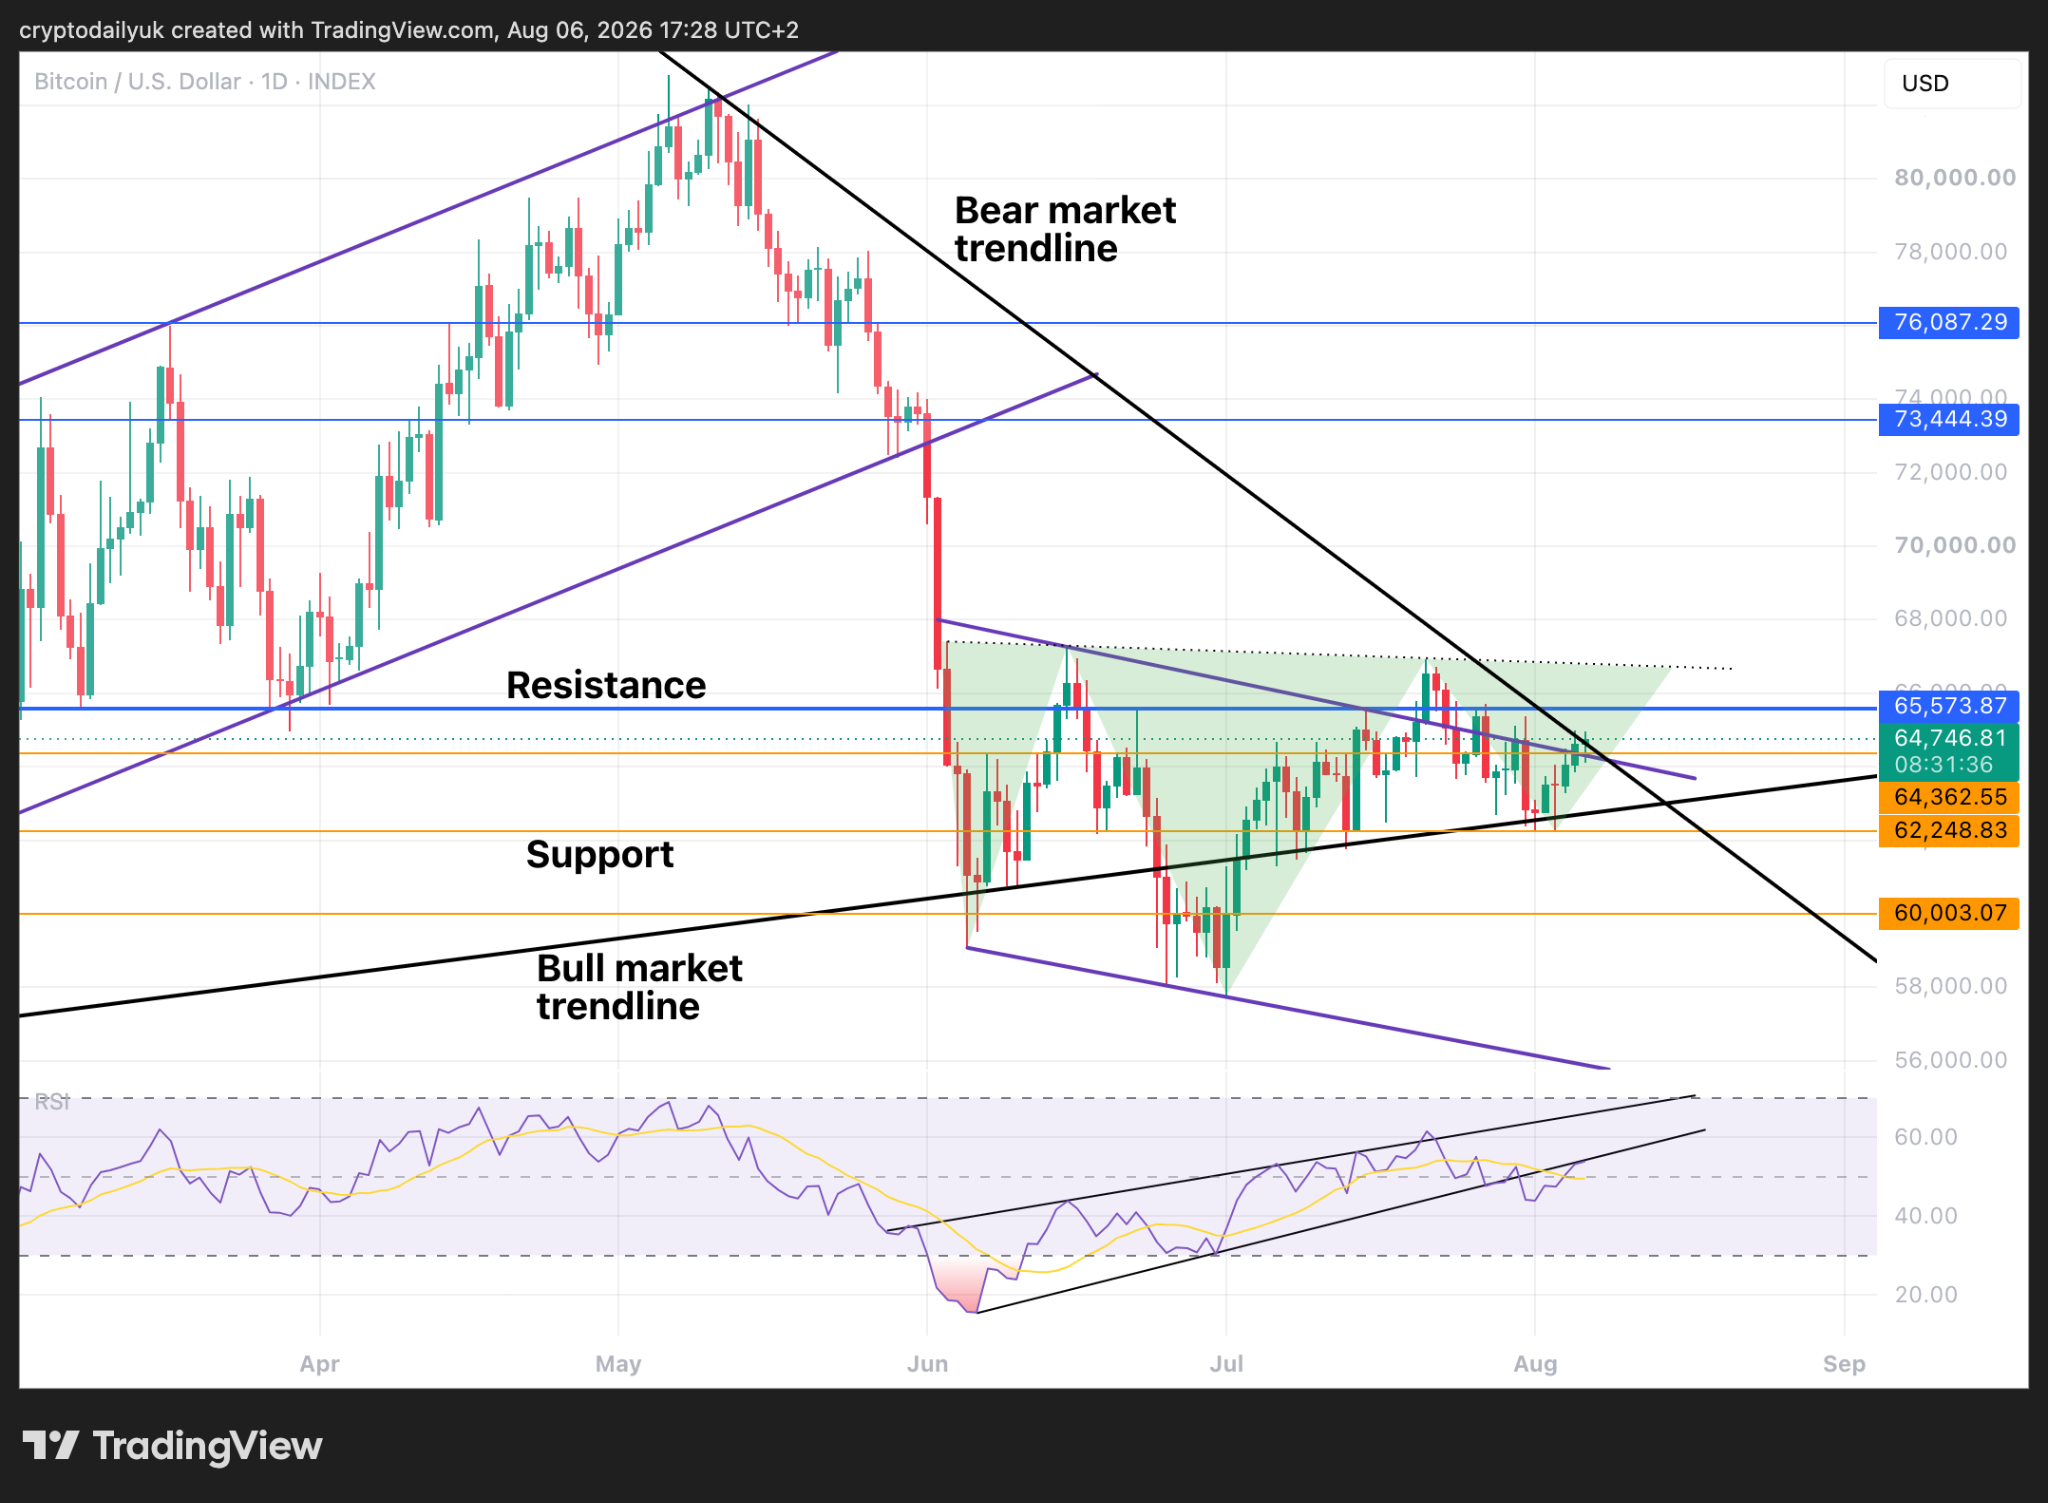
The daily chart reveals that the last touch of the bear market trendline was back in early May, when over the following days the bulls tried to break out, but to no avail. Once the breakout became a rejection, a full-on price collapse ensued which led all the way down to the $60K bottom.
Here we are around 3 months later and the $BTC price is up against this major trendline once more. Is a glorious new bull market beckoning if this trendline can be broken and the inverse head and shoulders is able to play out?
Below in the Relative Strength Index (RSI) the indicator line has arrived back at the bottom of the rising wedge it fell out of previously. Is this to force its way back inside, or is this more likely a confirmation of the breakdown, and a signal that the $BTC price is about to go lower again?
Extension of bear market or new bull market?
Source: TradingView
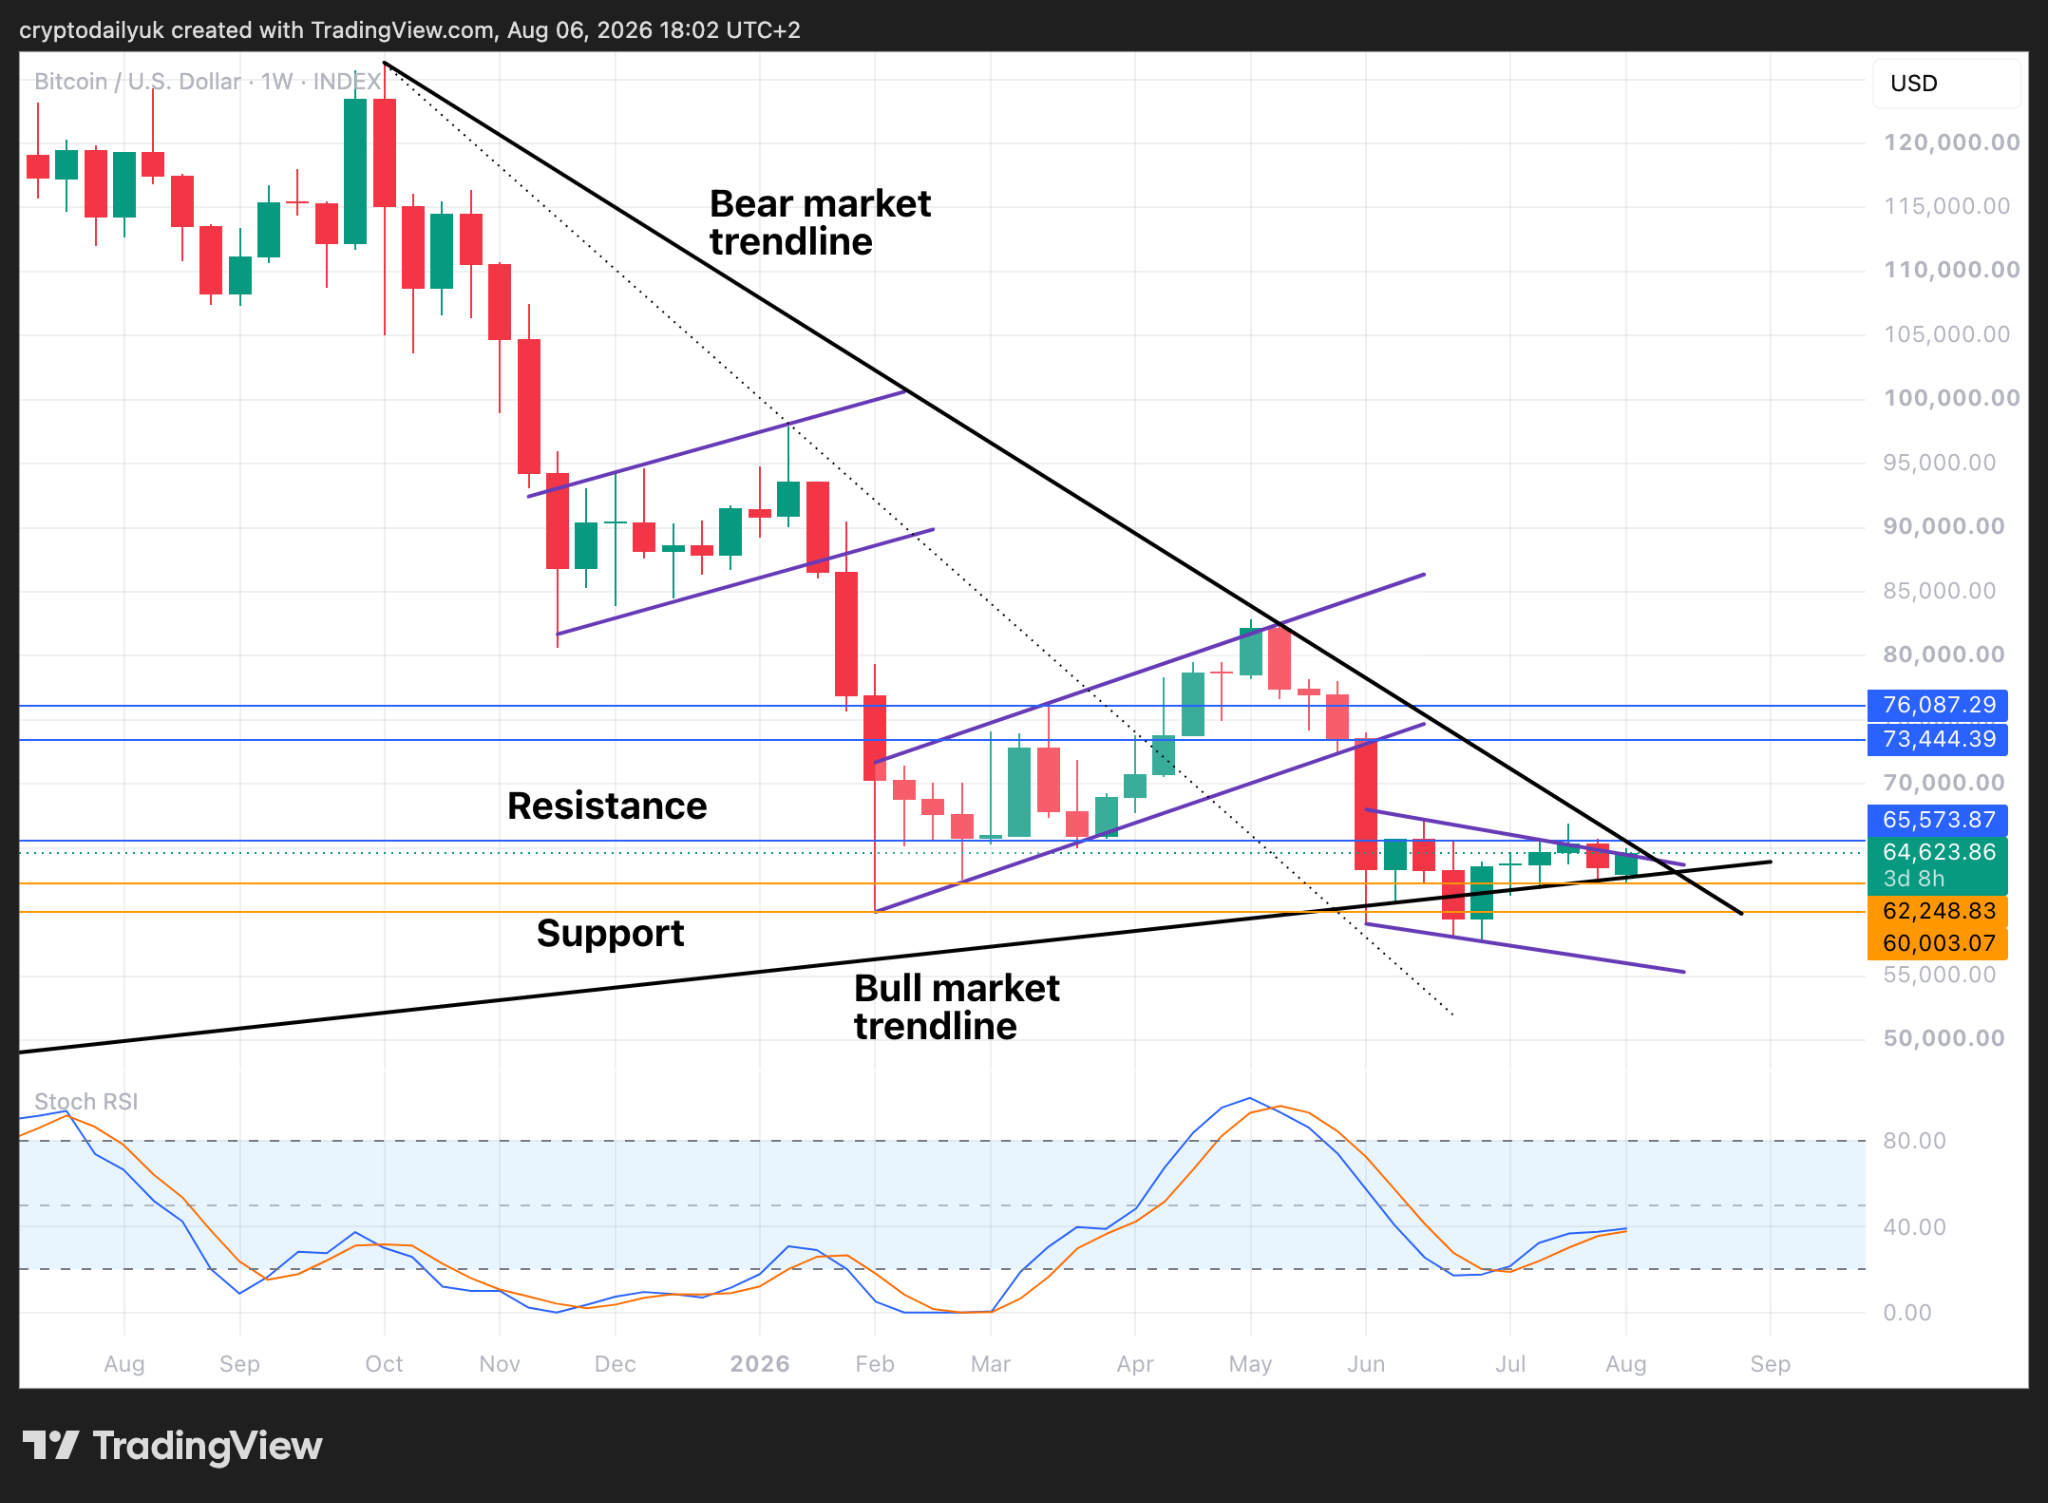
The weekly chart shows a faint line which was the first possibility for the bear market trendline. This held until midway through the second bear flag. It is probably still a valid trendline because the $BTC price came back to test it at the $60K bottom.
However, the main trendline is now the one that is drawn across the top of the second bear flag and the end of that big bear market rally. The price has reached that trendline again, and what happens next will either extend the bear market, or potentially launch the $BTC price into the next bull market.
At the bottom of the chart, the Stochastic RSI indicator lines are separated, meaning that the chances of a cross-down have slightly diminished, although this could easily change by the end of the week.
This week and the next will probably supply the main macro direction for price over the coming weeks. Which way will it be?
Disclaimer: This article is provided for informational purposes only. It is not offered or intended to be used as legal, tax, investment, financial, or other advice.
Related Stories