Bitcoin (BTC)’s Rally Towards $12,300 Still On The Table As FOMO Rises Again
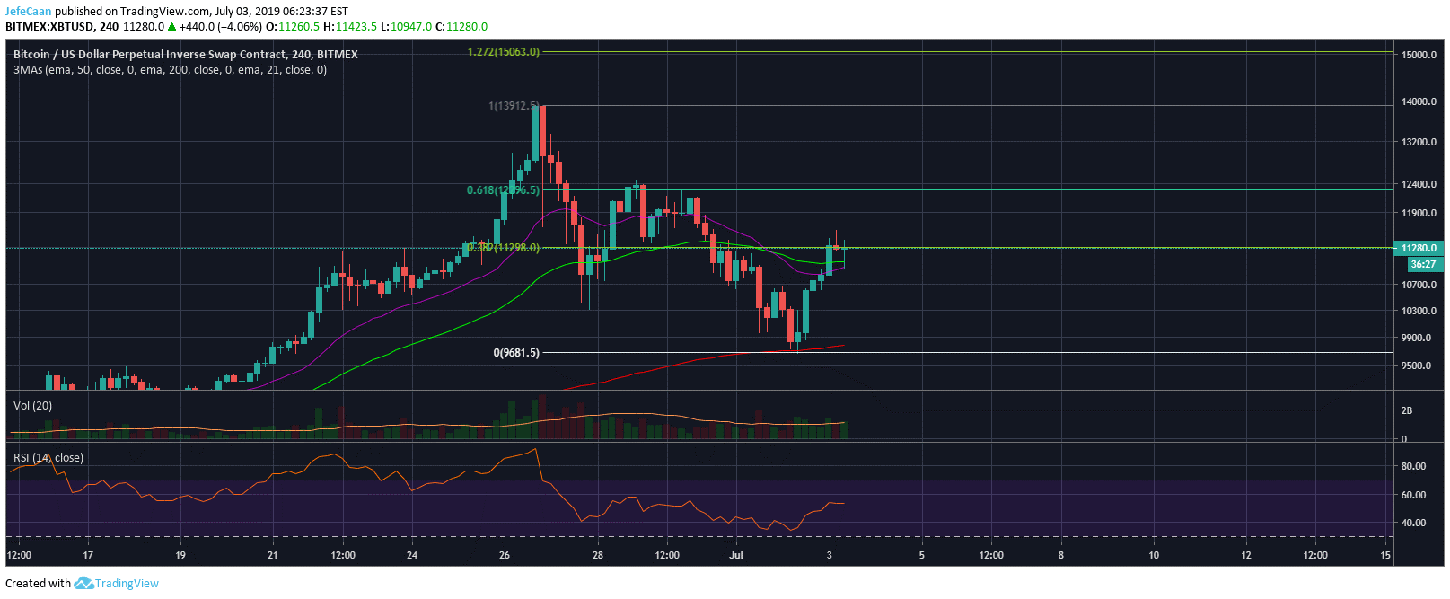
Bitcoin (BTC) is determined to keep moving up after it found temporary support at $9,681. This move was very powerful considering BTC/USD broke above a falling wedge. However, it has run into the 38.2% fib retracement level from the recent high (around $13,912). This has left investors wondering if a move towards higher levels is still on the table. Soon as Bitcoin (BTC) started to rise from $9,681 we saw most big accounts on Crypto Twitter turn to full FOMO again and they are now calling for price targets of $20,000 and $40,000 in complete oblivion to what happened on larger time frames. It is unfortunate that they are using 4H charts to make all-time high predictions. Some of them are not naïve enough to really believe that but they say it nonetheless because it is the popular opinion that gets them more views and more followers.
The corruption and manipulation in this market is something I have personally not seen anywhere. I have traded penny stocks for a long time and I’m no stranger to big pumps and dumps but the kind of greed, manipulation, fraud and corruption in this market is unprecedented. Maybe because this is because the market is so unregulated which attracts all kinds of people. Small time scammers in this market use fake Twitter accounts and ask for your BTC deposits in return for double the amount or something like that, but the big scammers in here are doing it legally and they get away with it. They have Twitter accounts with large following and they work closely with each other to build certain narratives. If you look at some of their tweets, you would find the timing quite peculiar.
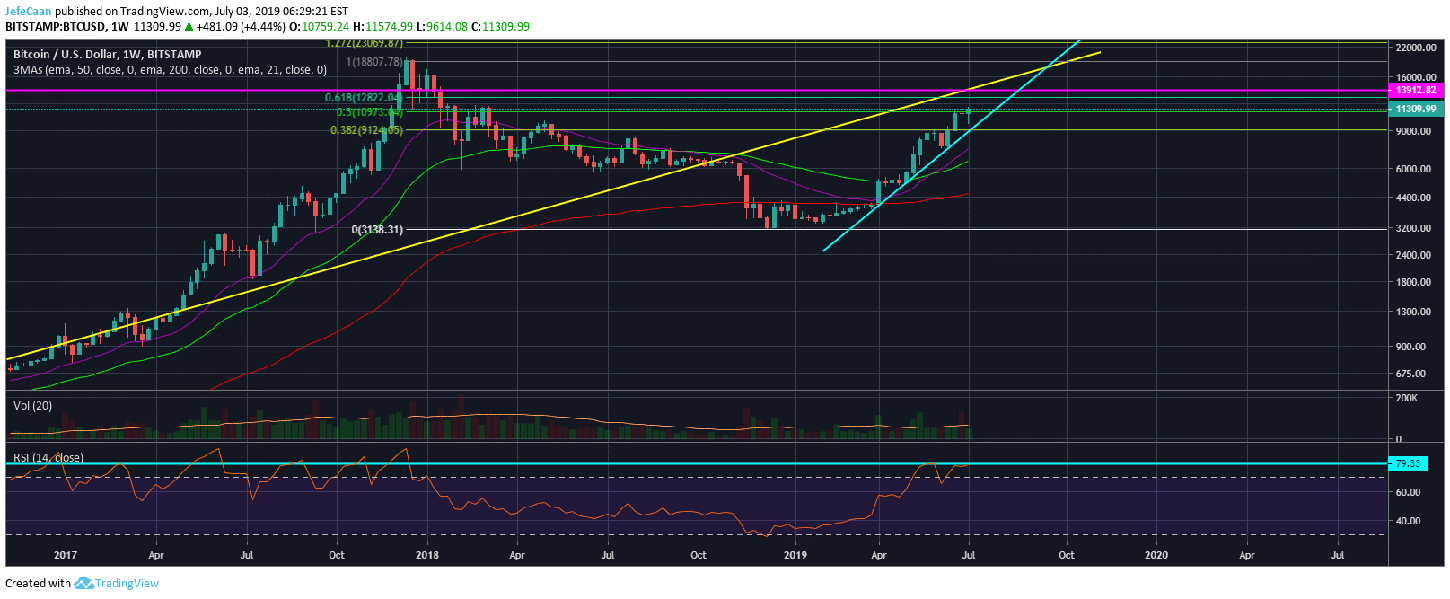
My observations are based on facts and looking at this weekly chart for BTC/USD, it is off the top of my head how anyone would draw a line or a curve to $20,000 without ignoring the clear warnings on this chart. First of all, there is a strong trend line support turned resistance (shown in yellow). This goes back to 2011 and was recently broken in November, 2018. Now, those with even some basic knowledge of technical analysis and chart analysis would know that a trend line that had been tested as support since 2011 and was broken in November, 2018 is not going to be just breached in a big move to the upside.

If we look closely at the weekly chart, we can see that there is a reason last week’s candle closed like that and formed an extremely bearish gravestone doji. The price rejected from a confluence of horizontal and trend line resistance levels and has declined back into the rising wedge. It is only a matter of time before this wedge is broken to the downside. When the price was at a similar point in 2014, we saw it trade sideways for a few weeks before it started to decline. We can see that BTC/USD still has room to do that this time until it breaks below the rising wedge. It is important to note though that this decline is going to be extremely devastating and the price will decline below $3,000 before it bottoms out.