Bitcoin Recovers Above $63K: Could a Rally Be Next?
 Laurie Dunn

Despite bearish price action more or less throughout last week, the $BTC price has started brightly on Monday, recovering some of the lost gains, and getting back above the key bull market support trendline. Could we be in for a rally into the low $70K region as Bitcoin potentially takes advantage of its trendline breakout?
$BTC price regains bull market trendline
Source: TradingView
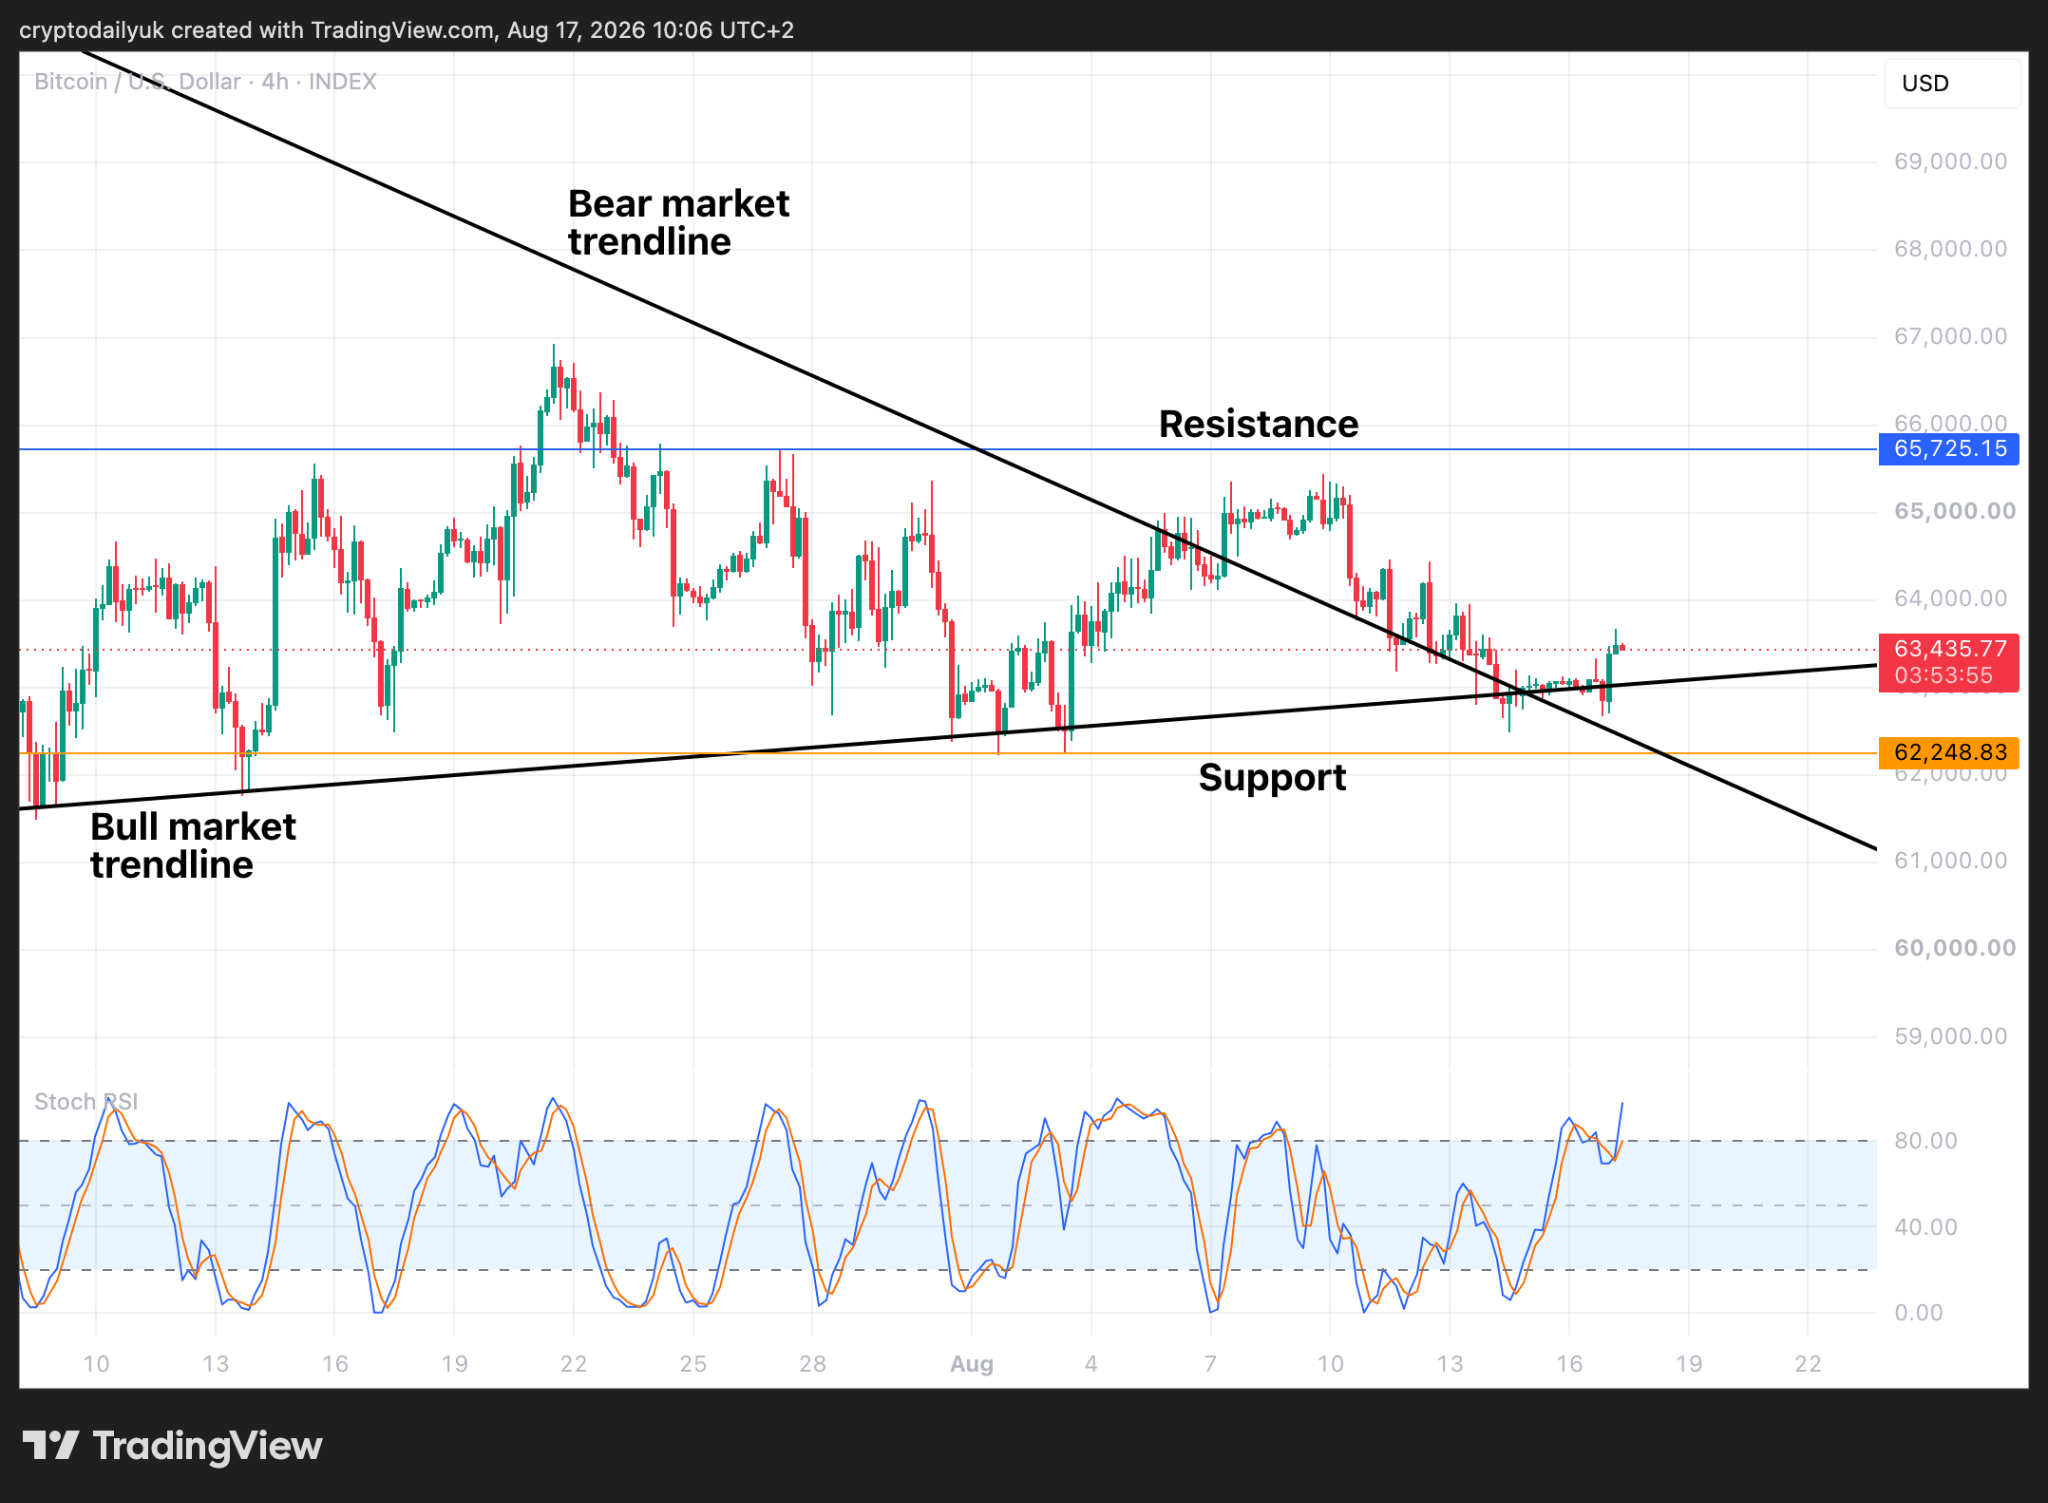
What we notice when looking at the 4-hour time frame for the $BTC price is that after the correction down to $62,500 the price shot back up to hold above the bull market trendline once again, just as happened on previous occasions.
As things stand, the price is above both bear and bull market trendlines - a good place to be. That said, it may be that the price chops sideways some more, but as long as higher lows continue to be recorded, a strong base is being built ready for a potential rally to the upside.
Inverse head and shoulders pattern still a possibility
Source: TradingView
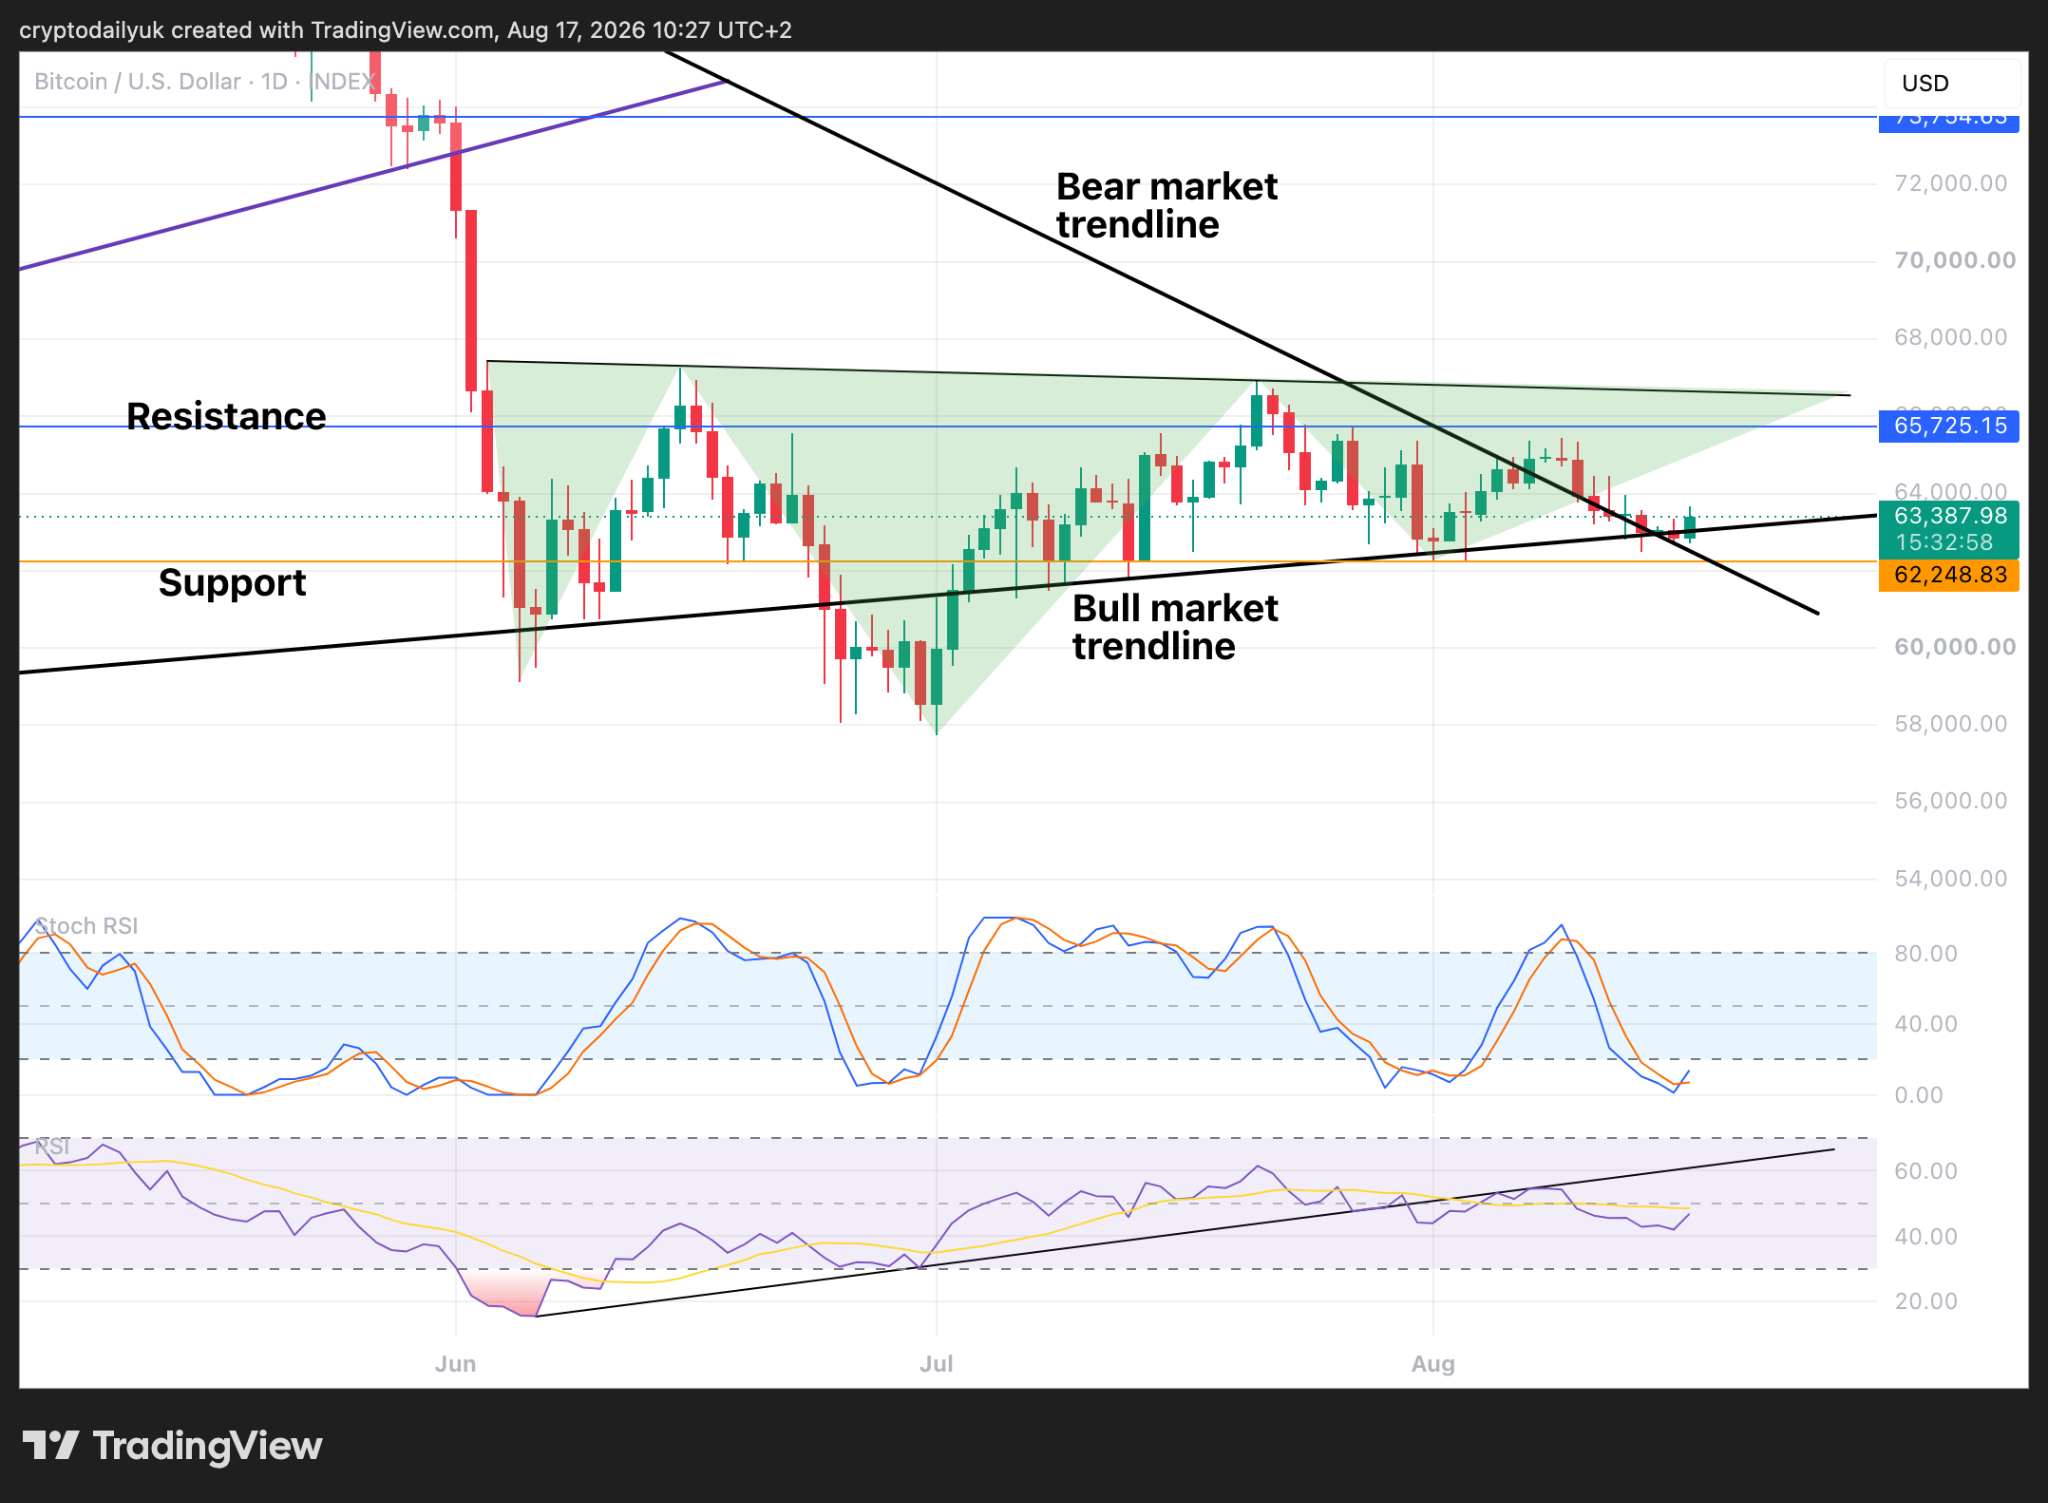
The daily time frame shows us that the inverse head and shoulders pattern is still forming, although the right shoulder is becoming rather stretched. Unless the $BTC price moves to the neckline a bit quicker, it could be that this pattern fizzles out. If the pattern does complete, the measured move to the upside would be to $76K.
What is becoming clearer though is that 76 days of sideways price action does either suggest the accumulation period that comes with a potential bottoming pattern, or the complete opposite where time was needed to digest the last big crash from $82K to $60K, before the next leg down.
That said, things do perhaps favour the bulls more now. The breakout of the bear market trendline instead of a rejection lends more to the thesis of an impending rally. It’s probably just a case of waiting for this rally to now build momentum.
At the bottom of the chart, the Stochastic RSI is certainly leaning towards the bullish thesis, while the RSI indicator is also heading back up. Could it now rise to retest the ascending trendline?
Bull market trendline and 0.618 Fibonacci perfect supports
Source: TradingView
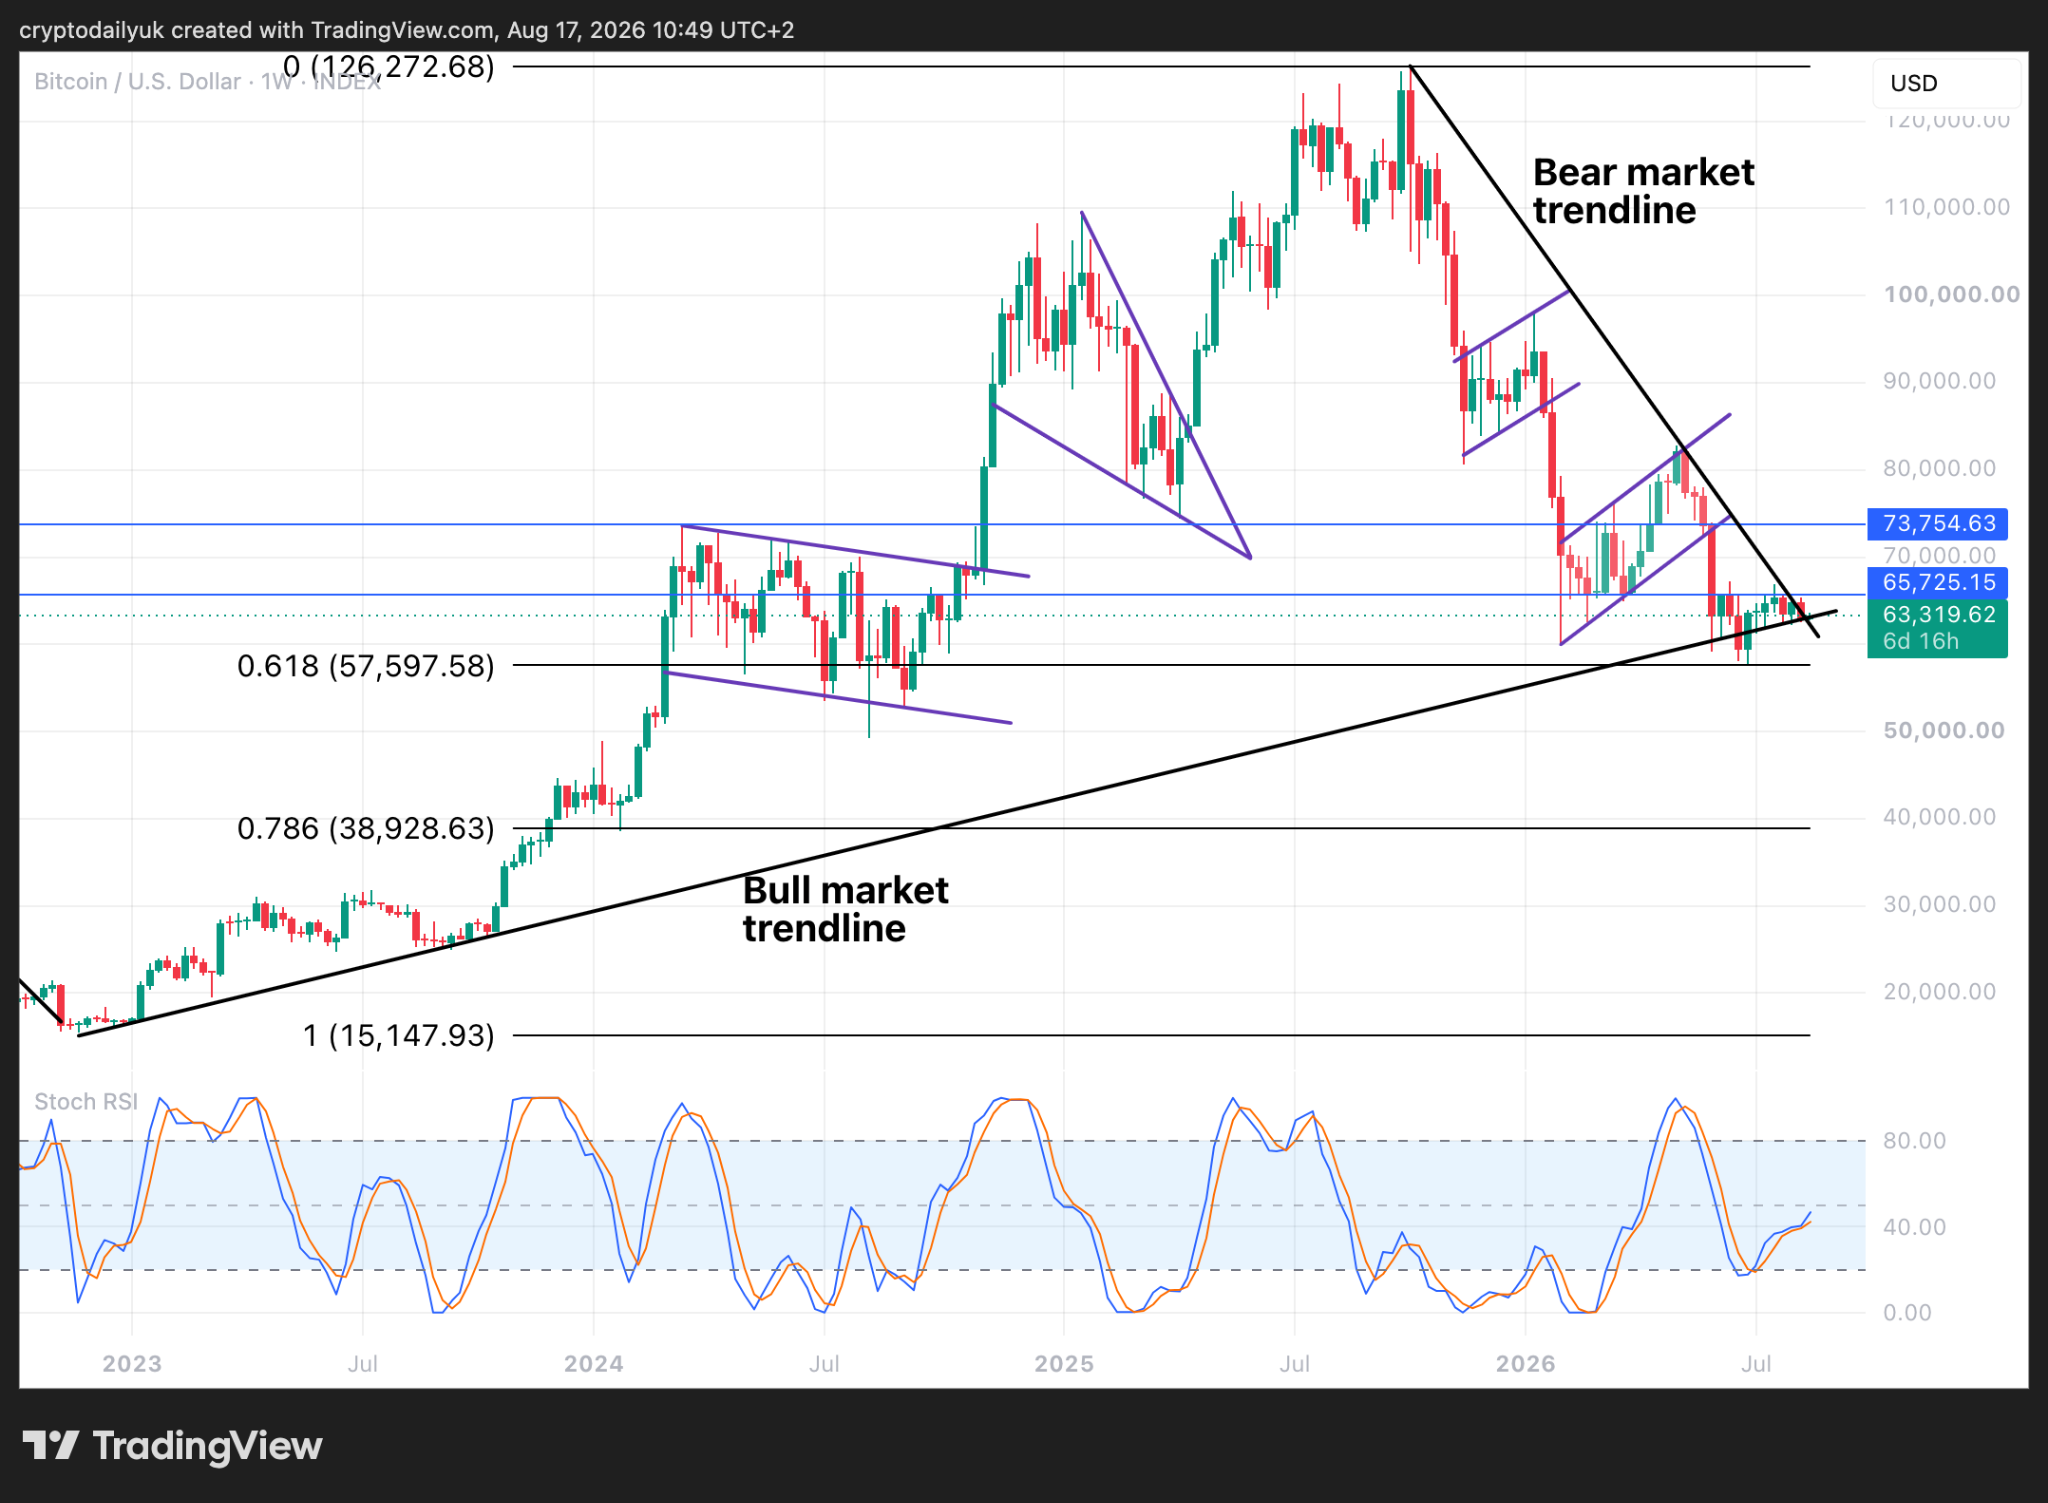
Zooming right out into the weekly time frame the mathematical accuracy of technical analysis comes into view. Not only has the $BTC price broken out beyond the bear market trendline, which appears to have been suppressing the price ever since the bull market top, but also the Fibonacci sequence lines show that the price came down to tap on the $57,600 low, which matches perfectly to the 0.618 golden Fibonacci level.
Yes, if one looks lower to the 0.786 Fibonacci level, it can be observed that this also matches up accurately with the support level at $40K, which many across social media have often pointed to as a potential bottom.
Nonetheless, the current price action has not only come down to retest the golden 0.618 Fibonacci level, but has also managed to hold above the bull market trendline. Until these major supports are broken, we can assume that the bottom is in.
The Stochastic RSI indicator lines are pointed upwards, so expect some upside price momentum to get behind a price rally at some point. It just remains to be seen how far a potential rally could go? $65,725 is the first big hurdle to be overcome.
Disclaimer: This article is provided for informational purposes only. It is not offered or intended to be used as legal, tax, investment, financial, or other advice.
Related Stories