Has Bitcoin (BTC) Topped Out Yet?
Bitcoin (BTC) has yet to show any signs of a slowdown as the price keeps on rising, printing one parabolic rally after another. A lot of retail traders have become optimistic to the point of complacence. Most already expected that the bear market was over and now that the price has shot up past $10,000 that belief has strengthened. Meanwhile, the bears are running scared trying to defend their shorts. As always, only those that are patient and disciplined will be able to profit off the next downtrend, but the question is, “Has the price topped out yet?” Well, the short answer is that it is very likely that it has by the look of things, but the long answer is that we never know and it does not matter.
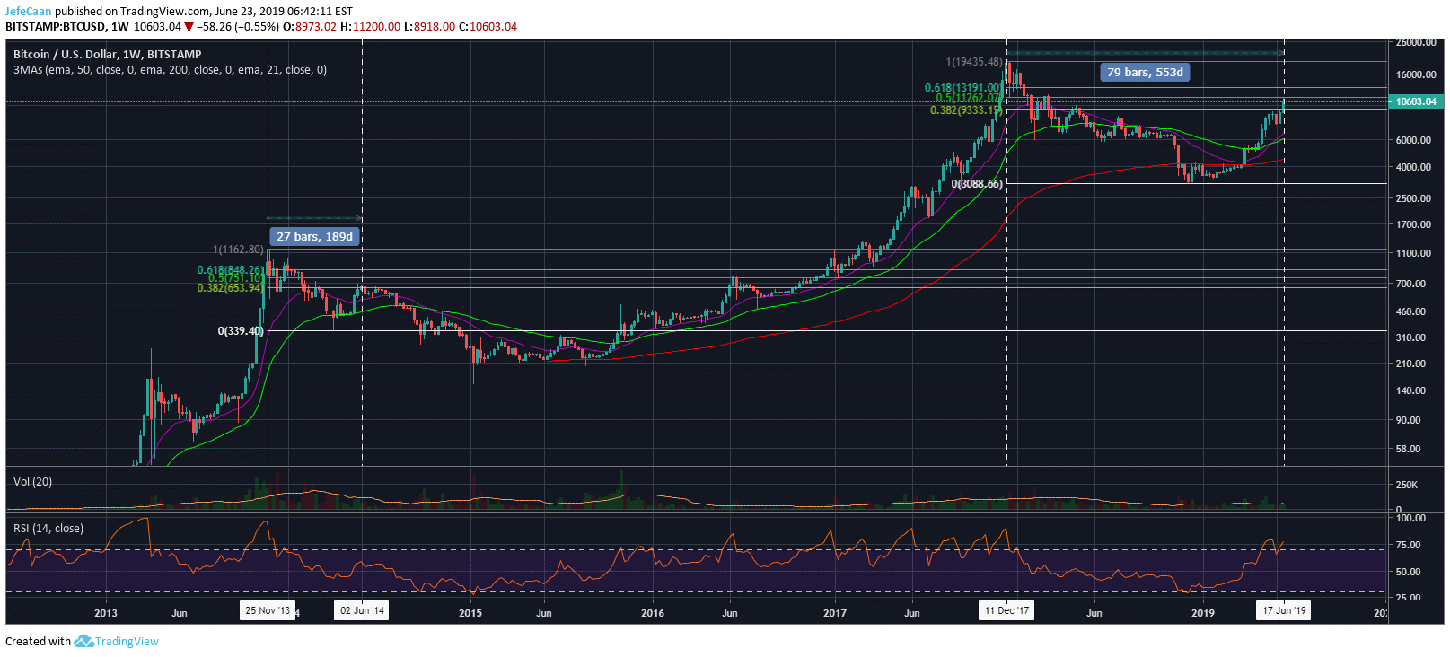
Most successful traders are fond of the Rothschild 80/20 rule. This rule states that you can take 20% of the top and 20% of the bottom and I’ll take everything in between. This is how good traders consistently generate steady profits while those that are greedy keep on trying to sell ‘tops’ or ‘bottoms’ and they end up losing money most of the time because it is extremely difficult to call tops or bottoms. If we look at the weekly chart for BTC/USD, we can see that the price just tested the 50% fib retracement level from all-time high but has now declined significantly from there. If we compare this with the previous cycle during 2014, we can see that during both cycles the price ended up rising above the 38.2% fib retracement level. However, this time it rallied tested the 50% fib retracement level and is now likely to begin its downtrend from here.
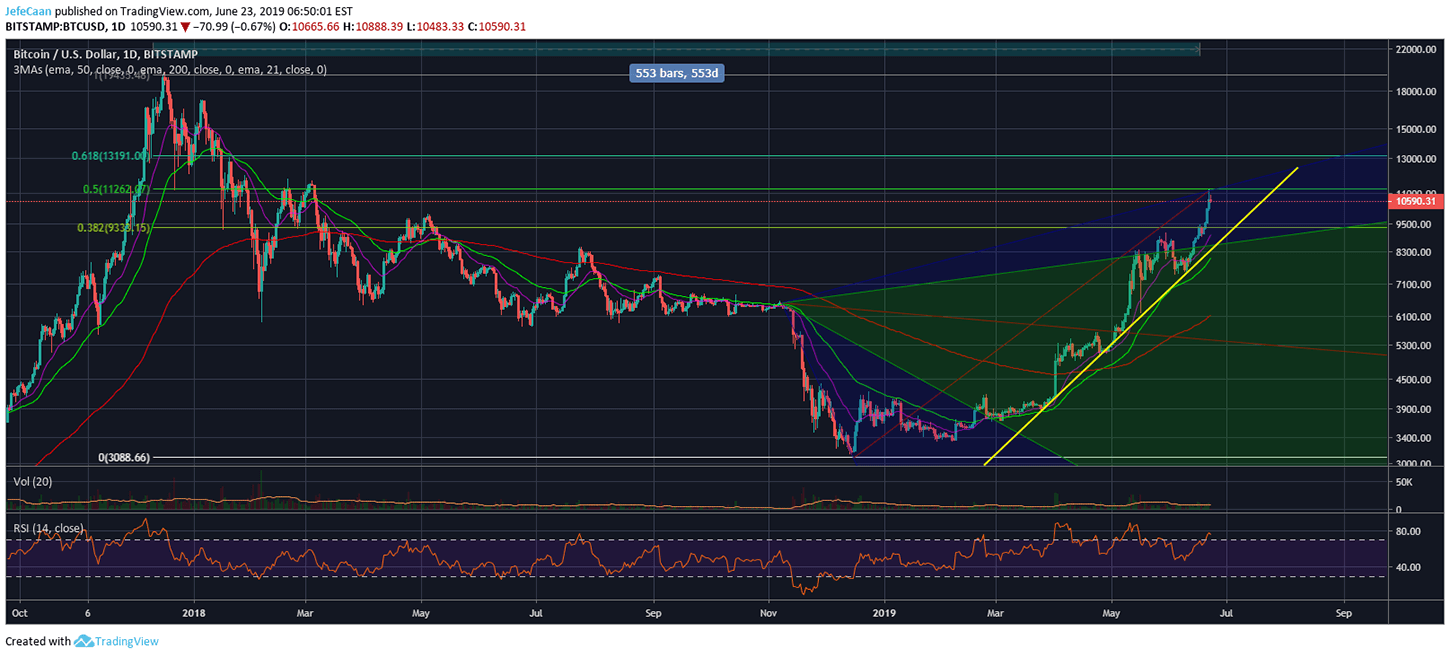
If we look at the daily chart for BTC/USD, we can see that the price ended up shooting straight through the 38.2% fib retracement level after a minor resistance. Based on the 2014 cycle, a lot of traders expected the price to face rejection at that point but it did the exact opposite of what most traders expected and rallied towards the 50% fib retracement level at $11,262. Doing this, BTC/USD has left some big gaps for CME Bitcoin Futures along the way. Sooner or later, these gaps get filled. BTC/USD found support on a key trend line for its parabolic advances. Even if the price is to rise to the 61.8% fib retracement level short term, it will still have to decline towards this trend line support again.

However, the most likely scenario is that BTC/USD will break below this trend line during its next inevitable correction. This will set the ground for a decline towards the 50 day exponential moving average which is likely to be somewhere around $8,500 during that time. The price will be expected to rally towards $10,000 after that and it will face a strong rejection at the same trend line which was support and would then have become resistance. After that rejection, the price will be all set to decline towards $3k. We expect the bottom to be around $1,800 or lower but the price is expected to find a temporary bottom at $3k close to the upcoming halvening.