Bitcoin
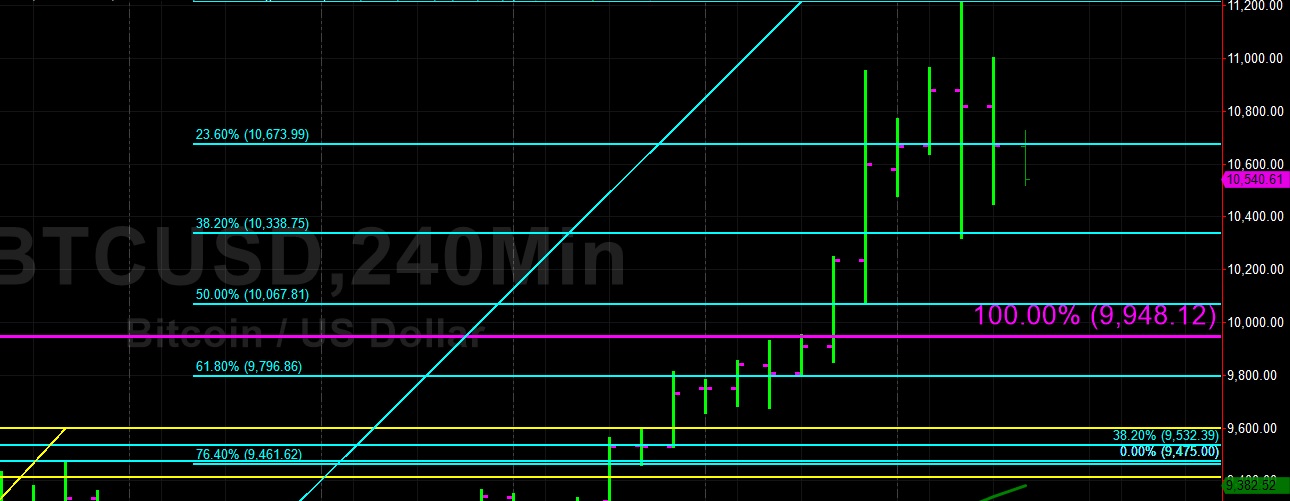
Bitcoin (BTC/USD) took a break from its massive surge higher early in today’s Asian session as the pair hovered around the 10673.99 area, representing the 23.6% retracement of the move from 8919.72 to 11215.89. Late in yesterday’s European session, the pair reached its strongest level since early March 2018 following massive gains earned during yesterday’s Asian session when Stops were elected above the 10427.91 area, a key upside extension price objective related to the 10 June low of 7508.77.
Additional Stops were elected above the 11116.83 area, a related key upside extension price objective related to the same range before profit-taking emerged during yesterday’s North American session. The market then came off to the 10321 area before staging a recovery back above the important 10427.91 area. Above current market activity, the 11969 level is an important area and upside price objective. Below current market activity, the 10338 and 10067 areas represent technical Support, as does the 9796 area.
Price activity is nearest the 50-bar MA (4-hourly) at 9384.51 and the 50-bar MA (Hourly) at 10182.73.
Technical Support is expected around 10338.75/ 10067.81/ 9796.86 with Stops expected below.
Technical Resistance is expected around 11116.83/ 11969.22/ 13347.06 with Stops expected above.
On 4-Hourly chart, SlowK is Bearishly below SlowD while MACD is Bullishly above MACDAverage.
On 60-minute chart, SlowK is Bearishly below SlowD while MACD is Bearishly below MACDAverage.
Ethereum
Ethereum (ETH/USD) slumped early in today’s Asian session as the pair fell to the 303.40 area after peaking around the 315.54 area during yesterday’s North American session. Stops were elected above the 302.20 area during the move higher, previously a relative high, and then Stops were triggered above the 314.00 figure, representing the 50% retracement of the move from 547.40 to 80.60. The 302.67 area now represents the 23.6% retracement of the move from 261.00 to 315.54.
Today’s high was just below the 316 area, representing an important upside price extension objective related to the recent low of 226.35. Above this area, the 337 level is an important upside price extension objective related to the same range. Below current market activity, chartists are anticipating Bids around the 294 – 298 range with some additional technical Support expected around the 281.84 area. Additional Buying pressure is expected between the 271 – 275 areas.
Price activity is nearest the 50-bar MA (4-hourly) at 275.17 and the 50-bar MA (Hourly) at 294.70.
Technical Support is expected around 282.63/ 278.50 / 274.37 with Stops expected below.
Technical Resistance is expected around 316.12/ 322.84/ 337.33 with Stops expected above.
On 4-Hourly chart, SlowK is Bearishly below SlowD while MACD is Bullishly above MACDAverage.
On 60-minute chart, SlowK is Bearishly below SlowD while MACD is Bearishly below MACDAverage.