ETH's Path Back to $2,300 Runs Through Ether Funds That Lost $215M in Two Days
 Alex Carter

Three Things to Know
- US spot Ether funds shed roughly $215 million in two sessions as ETH slid to a three-month low.
- Daily momentum sits deep in oversold territory, yet sellers still control the trend.
- A nearby floor is the last charted support, and nothing is mapped beneath it.
Investors pulled money from US spot Ethereum funds for a second straight day this week. The exits came as Ether fell to its weakest level since mid-August.
Those outflows matter because fund demand helped carry ETH through earlier rallies. Without it, the token has little fuel to climb back toward its moving averages. Traders now face one question. Can an oversold bounce hold if regulated buyers stay on the sidelines?
Ether Funds Bleed $215M as ETH Hits a Three-Month Low
US spot Ethereum funds lost $145 million on Nov. 11. Another $70.5 million left the next day. Investors who bought Ether through regulated products are heading for the exit.
The selling hit as ETH dropped to a 24-hour low near $1,905 on Nov. 13. That was its weakest level since August 18. The token now sits about 61% below its all-time high of $4,946.
XRP fans have revived talk of a market-value flip. The gap remains wide. Ethereum's market value stands near $235 billion. That is about 3.6 times XRP's $64.6 billion. XRP traded near $1.02 on Nov. 13. It would need about $3.70 to match. That target sits above its own record of $3.65.
Ether funds also keep a large cushion. They hold $11.5 billion in net inflows and $11.2 billion in assets, SoSoValue data show. XRP ETFs hold $1.79 billion in net inflows and $1.16 billion in assets. Sam Daodu, a crypto analyst, said an XRP overtake by 2030 looks unlikely.
ETH Trades Under Both Averages After a 21% Monthly Slide
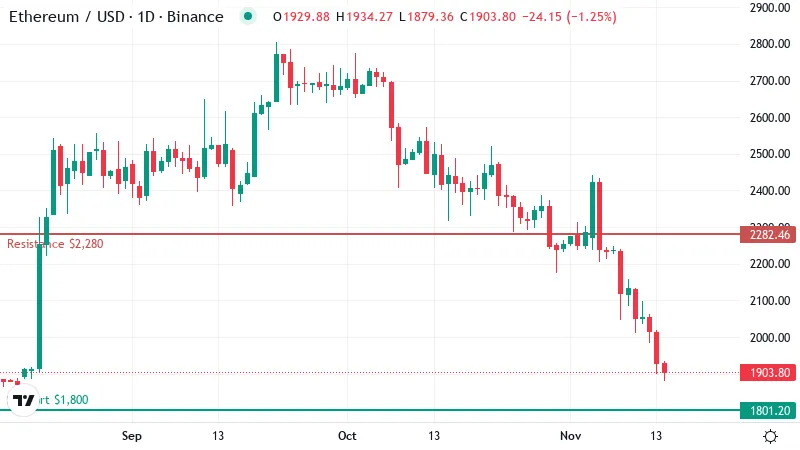
Ether changed hands near $1,900 on Friday, down about 1% over the past day. The smaller daily move hides a steeper trend. The token has lost about 21% over the past month, and most of that damage came recently.
Selling sped up over the last seven days, with ETH down roughly 15% in that span. Now it sits close to the bottom of its 30-day range, and buyers have yet to show up in size.
Two moving averages frame the problem. A moving average smooths out daily swings to show the broader trend. The 50-day average sits near $2,300. The 200-day average is close by, at about $2,290. Both now hang well above the current price.
When price trades under these lines, they tend to act as a ceiling. Traders who bought near those levels often sell into any bounce to break even.
A move back toward that cluster would put ETH right into its strongest overhead resistance.
Reclaiming that band would be the real test of a turn. Closing a day above both averages would suggest sellers have lost control. Until then, rallies toward that area look more like chances to sell than signs of a new uptrend.
Oversold Readings Have Not Stopped the Sellers Yet
RSI, a 0 to 100 gauge of momentum, sits near 23 on the daily chart. Readings under 30 count as oversold. That means sellers have pushed price down faster than usual, and a short relief bounce often follows.
An oversold reading alone does not mark a bottom. Coins can stay stretched for days while the decline grinds on. RSI shows how hard the selling has been, not when it ends.
Other signals still favor the bears. Momentum indicators keep pointing down. Trend strength readings confirm a real downtrend, and sellers lead it.
That mix makes any pop look fragile. A quick rebound could squeeze out short sellers and lift ETH for a session or two. Without fresh money returning to the spot funds, such a move would likely fade before it threatens the overhead averages.
$1,800 Is the Floor With Nothing Mapped Beneath It
On the daily chart, the nearest support sits around $1,800. Buyers need to defend it to keep the decline orderly.
A break would leave ETH with no charted support below. Price could then drop quickly, because few obvious levels exist where buyers might step in.
Overhead, the first resistance stands near $2,280. That mark sits just under the moving-average cluster, so sellers have stacked supply in one tight zone. Clearing it on a daily basis would mark the first real crack in the downtrend.
The next hurdle comes around $2,400. Clearing that level would confirm a recovery rather than a short relief rally.
What Flips the Next 72 Hours Either Way
The oversold bounce and the fund flows will likely set the next move.
- Bullish: A relief bounce from oversold levels lines up with a pause in spot fund outflows. That combination could carry ETH back to the first resistance just under the moving averages. A close above it would put the next hurdle in play. A break of the support floor would cancel this view.
- Bearish: Redemptions keep coming and the support floor gives way. With no mapped level below, sellers would face little in their path. A reclaim of first resistance would invalidate this case.
Fund Flows Hold the Key to Any Rebound
Oversold momentum can spark a bounce. Lasting gains need buyers in the spot funds to return. Until daily flows turn positive, a climb back to the averages stays unlikely.
The downside carries its own danger. With no charted floor below current support, a break could turn into a fast drop.
Disclaimer: This article is provided for informational purposes only. It is not offered or intended to be used as legal, tax, investment, financial, or other advice.
Disclaimer: This article is provided for informational purposes only. It is not offered or intended to be used as legal, tax, investment, financial, or other advice.
Related Stories