ETH Price Prediction: Deeper Correction Possible as a Fed Hike Pushes It Below $2,000
 Alex Carter

Three Things to Know
- The Fed raised rates again, adding fresh pressure to an ether market already losing fund support.
- Ether's daily chart shows deeply oversold momentum, yet sellers still control a strong downtrend.
- One support floor stands between ether and a chart with no clear landing spot below.
Ether slipped below $2,000 this week after the Federal Reserve lifted its benchmark rate. Investors also pulled money from US spot Ethereum ETFs during the month.
Tighter money hits speculative tokens first, and ether has few buyers left to absorb the blow. The chart looks stretched to the downside, so a short bounce could come. Traders now want to know whether the nearest floor will hold or the correction has further to run.
A Fed Hike and ETF Outflows Land on an Already Bruised Ether
On Nov 12, the Fed raised the upper end of its target range to 4% from 3.75%. Higher rates make cash and bonds more attractive. That tends to drain money from speculative assets like ether.
Institutional demand was already cooling. Cumulative net inflows into US spot Ethereum ETFs fell to about $11.5 billion by Nov 12. A month earlier they stood near $13.1 billion. That drop means fund holders pulled money out over the month instead of adding to positions.
Longer-range views remain more upbeat. A forecast generated by Claude, Anthropic's AI model, puts ether's 2030 base case near $5,200. Its bull case sits around $10,500.
The same model sketches a bear case of $1,500 by 2030. In 2027, it sees a possible low near $1,100. Its main worry is that fee revenue keeps leaking to layer 2 networks and rival chains. It flags an ETH/BTC ratio below 0.0200 as the clearest warning sign.
Those long-range targets offer little comfort to traders facing tighter money and fading fund flows.
Both Key Averages Now Sit Far Above the Price
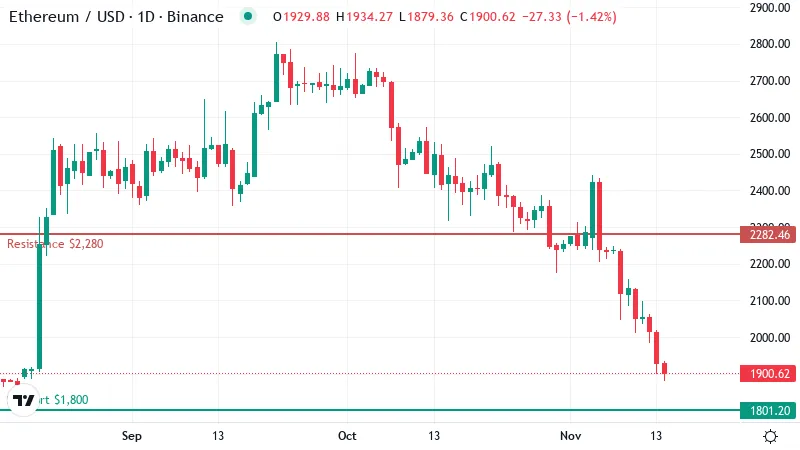
Ether trades near $1,900, about 1% lower over the past day. That small daily move hides a much heavier slide. The token is down roughly 15% this week and about 21% this month.
Those numbers describe a grind lower, with sellers in steady control and buyers stepping back each time.
Moving averages help show that trend. A moving average smooths out daily noise by tracking the average closing price over a set number of days. The 50-day line reflects the past few months, while the 200-day line captures the longer picture.
Ether now sits below both. The 50-day average is near $2,300. The 200-day average sits just below it, around $2,290. The two lines have nearly merged into one band overhead.
That overlap matters. When short and long averages bunch together above the price, they tend to act as a single thick ceiling. Rallies often stall as they approach that zone, because traders who bought higher use the bounce to get out.
The gap also measures the work ahead for bulls. Ether would need to climb roughly 20% just to touch those averages again. Reclaiming them, and holding above, would be the first real sign the downtrend has broken.
Oversold Readings Have Not Stopped the Sellers
RSI, a 0 to 100 gauge of momentum, now sits near 23 on the daily chart. Readings below 30 count as oversold. That means sellers have pushed the price down faster than usual, and markets in that state often see a short relief bounce.
A bounce would still fall short of a reversal. Momentum keeps pointing down, and the MACD line sits below its signal line. That tells traders the selling pressure has not yet faded.
Trend strength adds to the caution. The indicator that tracks how forceful a move is shows a real trend in place, and sellers are the ones leading it. Strong trends tend to persist longer than most traders expect.
That is the trap in oversold signals. In a seller-led market, RSI can stay pinned low for days or weeks while the price keeps slipping. Buyers who step in on the reading alone often get caught early.
The $1,800 Floor Stands Between Ether and Open Air
Support sits at that level on the daily chart. That level has caught buyers before, and it is the closest place where demand could show up again.
The problem is what lies below it. The data shows no clear support level under that floor. A close beneath it would leave ether without an obvious landing spot. Losses could then speed up as stop orders trigger.
Overhead, the first resistance sits near $2,280. That level lies just under the band of moving averages described earlier. A move back above it would be the first sign that buyers are starting to repair the damage.
Clearing that hurdle would still leave work to do. The next resistance stands near $2,400. A push through that level would put ether above its averages and its nearest ceiling at the same time.
For now, the price sits much closer to the floor than to either ceiling.
What Would Flip the Next Three Days
- Bullish: The oversold reading sparks a relief bounce, and ether posts a daily close above first resistance. That would open a run toward the next ceiling just above the moving averages. A slide back under the support floor would cancel this setup.
- Bearish: A daily close below support pushes the correction into territory with no marked floor, and selling could speed up. A recovery back above first resistance would invalidate this view and point to sellers losing control.
Patience Beats Catching the Knife
Ether's trend stays bearish until buyers reclaim first resistance. Before that, any bounce off oversold levels looks like a short trade at best.
The bigger risk comes from outside the chart. Another rate hike or a fresh wave of ETF withdrawals could crack the support floor quickly. Waiting for confirmation costs little compared with buying too early.
Disclaimer: This article is provided for informational purposes only. It is not offered or intended to be used as legal, tax, investment, financial, or other advice.
Disclaimer: This article is provided for informational purposes only. It is not offered or intended to be used as legal, tax, investment, financial, or other advice.
Related Stories