BTC Falls Under $67,000 as a Broad Crypto Selloff Leaves Only 2 of 44 Tokens Green
 Alex Carter

Three Things to Know
- Bitcoin slid under $67,000 as nearly every major token in a broad watchlist turned red.
- Daily momentum looks deeply oversold, yet sellers still control the trend.
- Traders are watching one nearby floor that could decide whether a bounce comes first.
Bitcoin set a fresh low on Thursday as a market-wide selloff deepened. Almost no token escaped the damage, and no single headline explained the drop.
That breadth matters. When selling hits nearly everything at once, it points to traders pulling risk off the table across the board. Traders now want to know if exhausted sellers will allow a relief rally or push for another leg lower.
Only Two Tokens Escape a Market-Wide Slide
The damage spread across the market. Of 44 tokens in a curated watchlist, 42 traded lower over 24 hours, leaving only two in the green.
Ether took a heavier hit than the market leader. Its loss over four weeks reached 21.4%, a steeper drop than Bitcoin's over the same stretch.
The latest move extends a steady staircase lower. Bitcoin first failed to hold the $84,000 level, which marks the average cost basis for holders. It later traded near $73,900 after setting a four-week low, then sank to $70,600 before breaking under the current mark. Each bounce has stalled at a lower level than the last.
No analyst or firm has pointed to a single catalyst for the decline. There was no hack, no regulatory shock and no major liquidation event. That suggests broad de-risking, with traders cutting exposure everywhere at once.
Bitcoin Now Trades Well Below Both Long-Term Averages
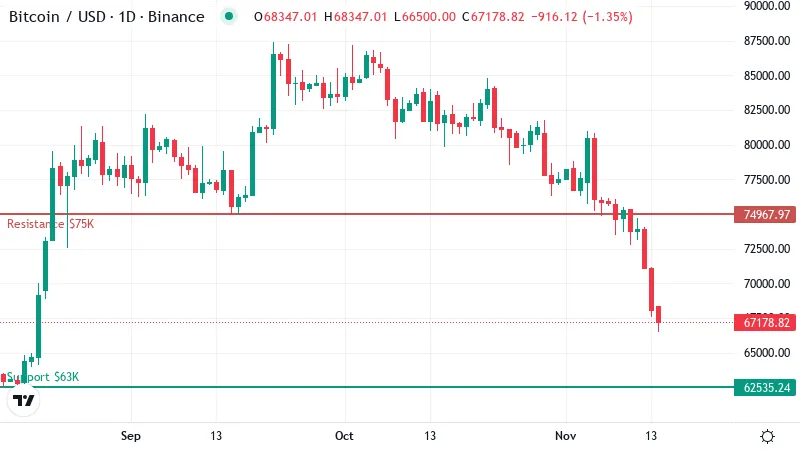
Bitcoin now trades well under both of its key moving averages. A moving average smooths out daily swings by tracking the mean closing price over a set period. The 50-day average sits around $78K. The 200-day average is near $76K.
Price below both lines is a bearish setup. Each average now acts as a ceiling, so any rebound has to fight through overhead selling before it can call the trend repaired.
The order of the two averages tells its own story. The 50-day line still sits above the 200-day line, a pattern left over from the stronger months before the slide. That means the breakdown is recent. The averages lag the price, and they have not yet caught up with how fast Bitcoin has fallen.
If the decline holds, the 50-day line will keep dropping toward the 200-day. A cross between them would add another bearish signal to the chart, though that is still ahead.
The pace of the losses shows the slide picking up speed. Bitcoin is down about 18% over 30 days, and roughly 12% of that came in the past week alone.
Trading in the last 24 hours looked calmer, with a dip of about 1%. One quiet day does little to change the weekly picture, where sellers clearly set the pace.
Sellers Stay in Charge Despite Oversold Readings
RSI, a 0 to 100 gauge of momentum, has dropped to about 23. Anything under 30 counts as oversold, so Bitcoin is now stretched far below its usual range. Readings this low often come before a bounce.
Oversold does not mean a bottom, though. RSI can sit at these levels for days or even weeks while price keeps grinding lower. It shows how hard the selling has been. It does not show when the selling will stop.
Other gauges back the bears. MACD, a tool that compares short and long trends, remains below its signal line, so momentum is still pointing down. Trend strength readings confirm a real downtrend. Any bounce from here would run against that trend, and those moves tend to fade quickly.
Why $63K Is the Floor That Matters Most
The nearest support sits near $63K. Buyers stepped in around that zone during earlier pullbacks, so it marks the first real test of demand. A clean break would leave little in the way until the next support near $59K.
That level should decide the next few sessions. Holding it would give the oversold bounce a base to build from. Losing it would signal that sellers still have room to push.
On the upside, the first resistance sits near $75K, just under the 200-day line. Reclaiming that level would be the first sign the damage is starting to heal.
The bigger hurdle is near $80K, above the 50-day line. A move back over it would turn the trend in buyers' favor. Until then, rallies face heavy overhead supply.
Relief Rally or Another Leg Lower
Two paths stand out from here.
- Bullish: Deeply oversold conditions could spark a relief bounce. A daily close back above first resistance would open the way toward the higher barrier over the 50-day line. A slide under the nearest support would invalidate this view.
- Bearish: A daily close below support would likely send Bitcoin toward the next support down. Sellers would keep control until price recovers above first resistance, which would cancel this setup.
Bears Hold the Edge Until $75K Falls
Momentum has yet to turn. Only a recovery of that first resistance level would shift the balance back toward buyers.
Shorts carry their own danger. Markets this oversold can snap back hard and fast. Traders betting on further losses near support risk getting caught in a sharp squeeze.
Disclaimer: This article is provided for informational purposes only. It is not offered or intended to be used as legal, tax, investment, financial, or other advice.
Disclaimer: This article is provided for informational purposes only. It is not offered or intended to be used as legal, tax, investment, financial, or other advice.
Related Stories