SOL Falls Below $80 as $1.9M Leaves US Solana Funds Despite DTCC's 2027 Plan
 Alex Carter

Three Things to Know
- Investors pulled money from US Solana funds even as DTCC named the network for its 2027 tokenization push.
- SOL has already fallen to the August low that once marked the bear case, with momentum gauges still pointing down.
- Holding the August floor near $75 now decides whether the slide pauses or deepens.
Solana won a seat in the plumbing of US markets this week, yet fund investors kept selling.
That split leaves SOL caught between a long-dated institutional story and heavy selling today. The token has dropped through levels that held for months. Traders now want to know whether deeply oversold conditions can spark a bounce, or whether sellers still have room to run.
DTCC Picks Solana for 2027 While Fund Investors Head for the Exit
The Depository Trust & Clearing Corporation plans to bring tokenized stocks and bonds to Solana in 2027. That makes Solana the fifth network on the clearing giant's tokenization roadmap. For a blockchain often tied to meme coins, the plan puts it inside the core machinery of US markets.
Fund investors have not responded yet. They pulled $1.9 million from US Solana funds on Nov 12. The institutional story has yet to pull in fresh money.
The gap to past highs is wide. SOL set its all-time high of $293 on Jan 19, 2025, and now sits about 72.8% below it. Staking rewards also add new tokens to supply, which slowly dilutes existing holders.
History shows recoveries can take time. After its November 2021 peak, SOL needed more than three years to set a new high. That run began from about $57 in November 2023 and gained roughly 414%.
The August Floor Gives Way Under Two Flat Averages
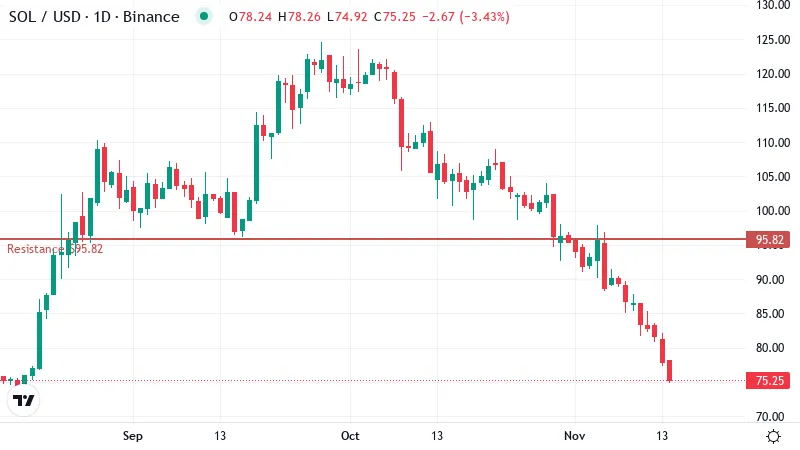
SOL traded near $75.25 on the latest data, deep below both of its long-term averages. A moving average smooths out daily swings to show the broader trend. The 50-day average sits near $96.60 and the 200-day near $96.74, so the two lines have nearly merged.
That matters for anyone hoping for a quick bounce. When short-term and long-term averages bunch together above the price, they form a thick ceiling. Buyers would need a rally of more than a quarter just to reach it.
The daily chart shows how the floor gave way. SOL first lost $82, its lowest close of the past 30 days, on Nov 12. That level had held through the October pullback, and its failure opened the way lower.
Next came the August low. Earlier analysis treated that level as the downside target if the DTCC plan fails to draw trading volume. SOL has already reached it, long before any 2027 launch could be judged.
Selling has also sped up. SOL is down about 28% over 30 days and roughly 17% in the past week alone. The losses grew larger in the latest stretch, which suggests sellers are pressing harder as price falls.
A steady slide like this tends to wear down buyers who stepped in at each lower level. Many of them now hold losing positions and may sell into any recovery toward their entry prices.
Oversold Readings Have Not Stopped the Sellers
SOL slipped about 3% in the last 24 hours. That pushed its daily RSI down to 18. RSI, a 0 to 100 gauge of momentum, flags a market as oversold below 30. A reading this low is rare and shows how one-sided the selling has become.
Extreme readings like this often come before relief bounces. Sellers eventually run out of coins to dump, and short traders lock in gains by buying back. Those bounces can be sharp but brief.
Other gauges argue for caution. MACD, a tool that tracks shifts in momentum, remains below its signal line. That means downward momentum is still in control. Trend-strength readings also show sellers leading a firm trend.
An oversold market can stay oversold for days during a strong downtrend. Buyers need to see momentum turn up before they can trust any rebound.
$95.82 Caps Any Rebound While Support Lies Far Below
Overhead, the first real test sits near $95.82. That resistance lies just under the two merged averages, so sellers can defend both at once. A rebound would have to clear a crowded zone where many recent buyers are waiting to break even.
The next hurdle is the round $100 mark. A daily close above it would put SOL back over its long-term trend lines and end the case for a continued downtrend. Until then, rallies toward that area look like chances for trapped holders to exit.
Support looks thinner. The nearest mapped support sits far away, near $42.14. The chart shows little structure between today's price and that level, with no well-tested shelf where buyers have stepped in before.
That makes the August low the line to watch. If SOL settles below it, the chart offers no nearby floor. Price could then drift lower with few obvious places for selling to pause.
What Decides the Next Three Days
Two levels already on the chart will likely settle the short-term direction.
- Bullish: An oversold bounce that reclaims the 30-day closing low would open a path toward first resistance just under the merged averages. A daily close back below the August low would cancel this setup.
- Bearish: A failure to hold the August low would extend the slide, with the next mapped support far below in the low $40s. A close back above the 30-day closing low would cancel this view.
Institutional Plans Cannot Yet Outrun the Selling
Until SOL climbs back above its merged averages, the chart remains a downtrend. The DTCC plan may matter in 2027, yet today's order flow still favors sellers.
Deeply oversold markets can snap higher on short covering, then reverse just as fast once that buying fades.
Disclaimer: This article is provided for informational purposes only. It is not offered or intended to be used as legal, tax, investment, financial, or other advice.
Disclaimer: This article is provided for informational purposes only. It is not offered or intended to be used as legal, tax, investment, financial, or other advice.
Related Stories