Bitcoin to Retest $79K Support: Will the Rally Continue?
 Laurie Dunn

The Bitcoin price is continuing to grind higher with the major higher high target of $83K not too far away. Is Bitcoin about to come back and retest horizontal support at $79K before going higher? Or could bearish divergence be about to change everything?
Higher highs and higher lows, but support needs to hold
Source: TradingView
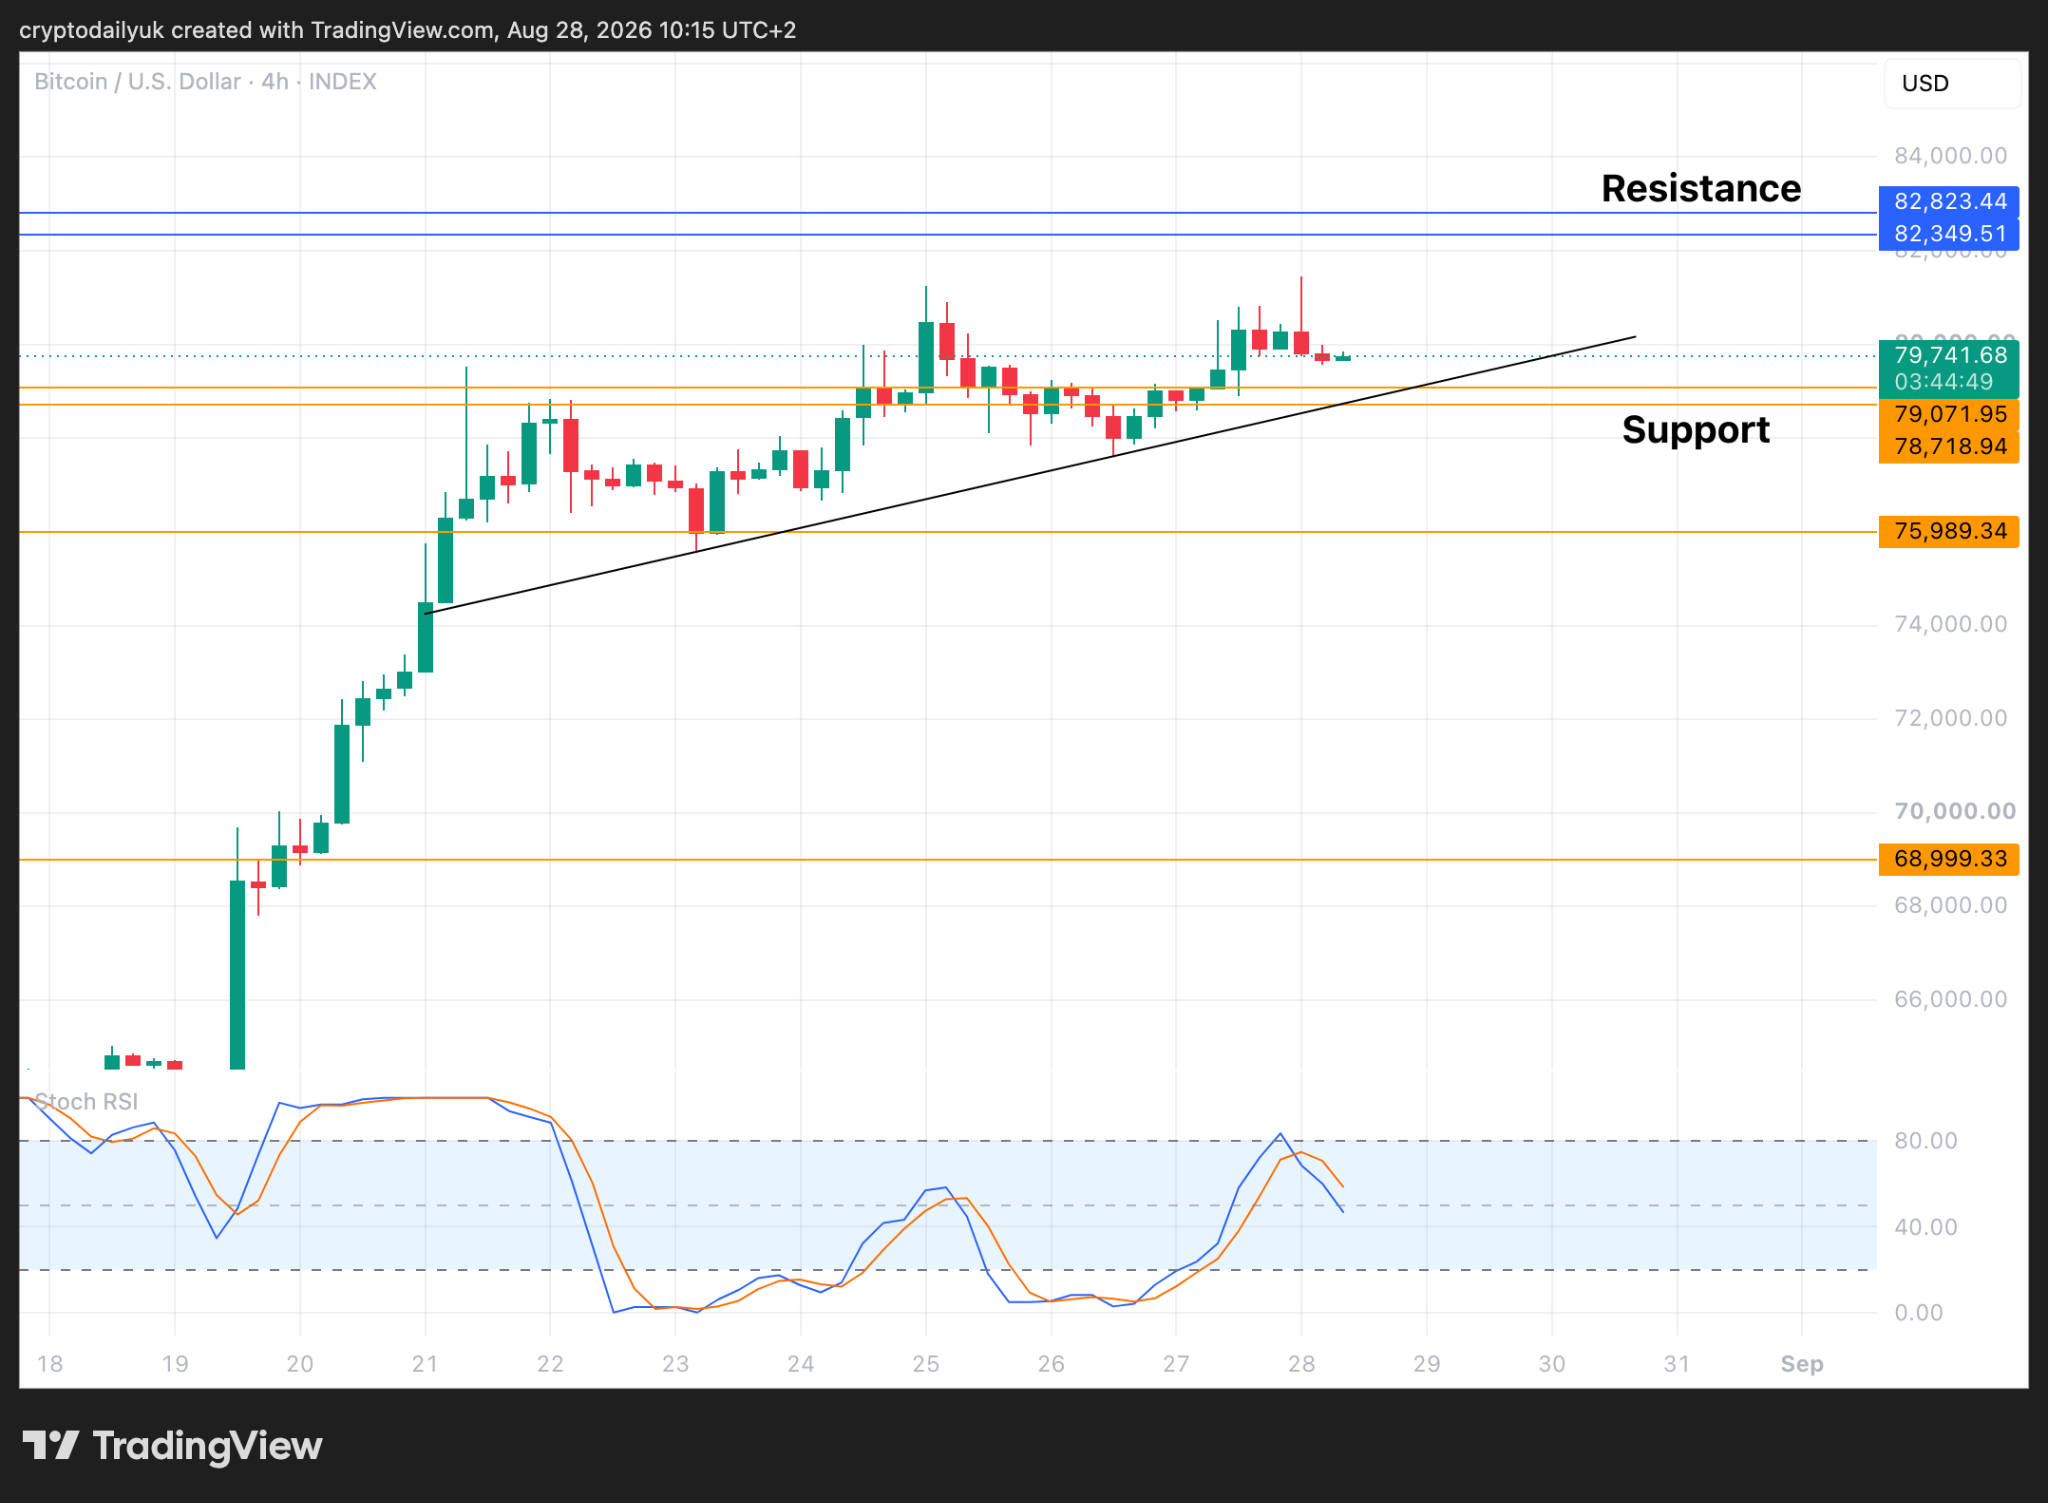
As can be seen in the 4-hour time frame above, the $BTC price is slowly but steadily grinding its way higher towards the prize of the $82,825 horizontal resistance level, but more importantly, a macro higher high. If the $BTC price can hit this level, and surpass the previous high made at the top of the second of the two big bear flags, this would be a critical step to changing the bear trend back to the bull.
Looking at the short-term price action, it would make sense for the price to come back a little more and retest the horizontal resistance, as well as the ascending trendline. These are good supports for the price making another higher low. The next higher high could perhaps then ascend to the critical overhead resistance level.
One major factor to bear in mind is that as the price action is rising, the Stochastic RSI, and particularly the RSI, are both trending downward. This suggests bearish divergence. Could this be what eventually sends the price back down for a potential big correction?
Momentum faltering? Bearish divergence rears its ugly head
Source: TradingView
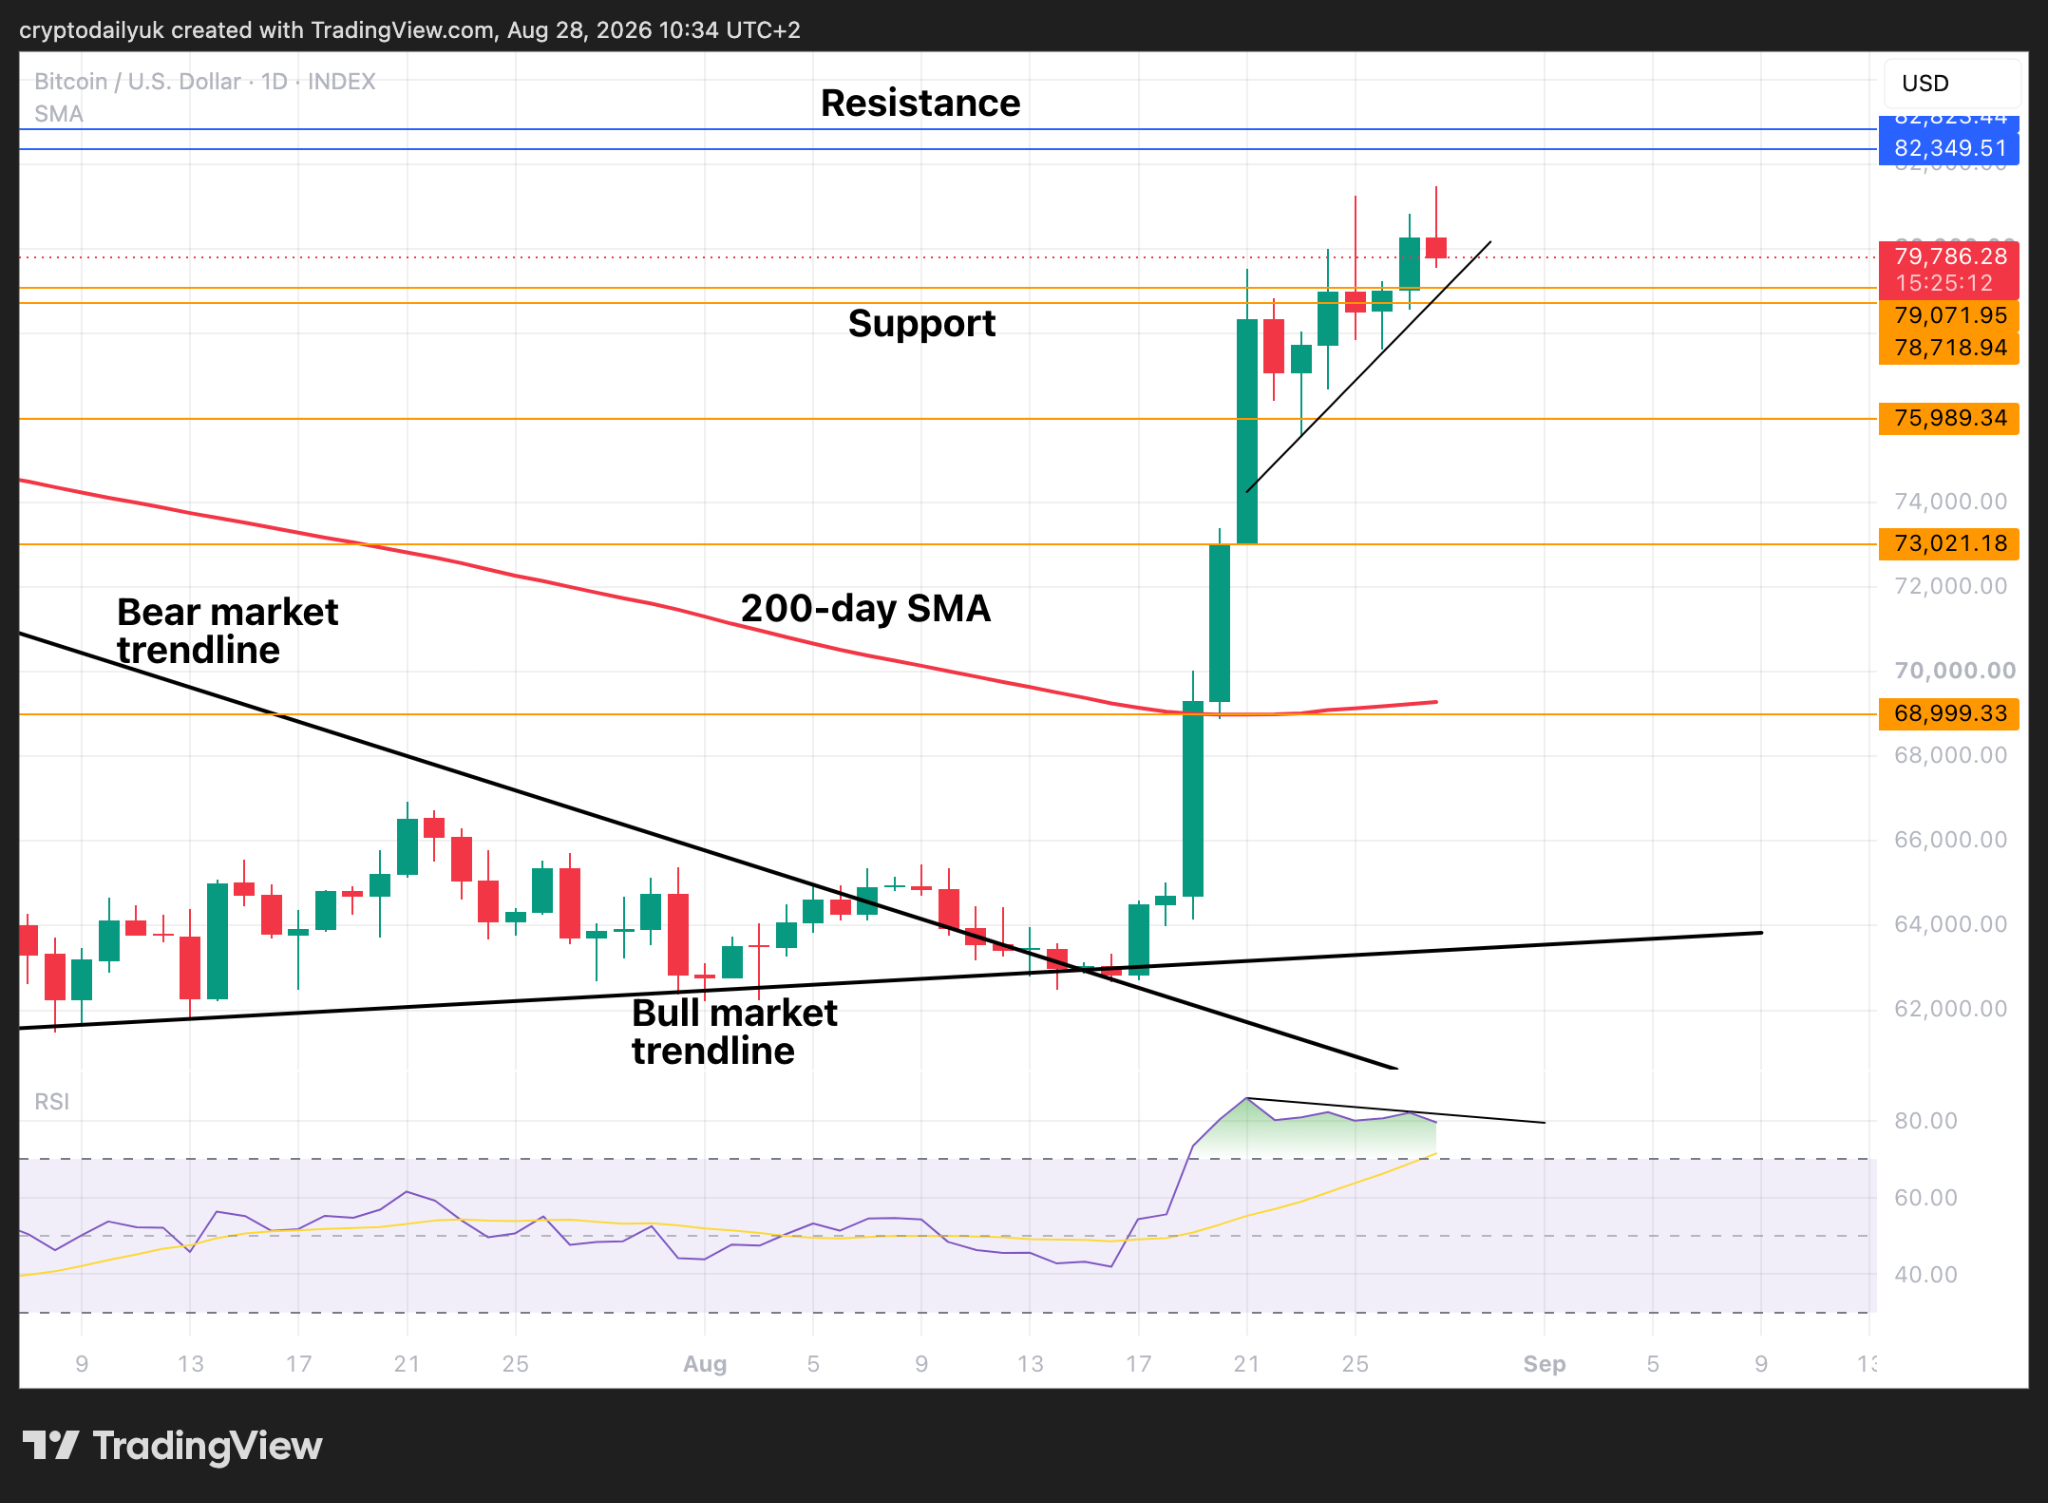
When a rally is about to reach its top and roll over the candle bars usually become smaller and the price starts to lose its momentum. Could this be what is happening to the $BTC price? Or is this just a perfectly valid period of consolidation before the price goes higher?
If this were consolidation, the price would have been more likely to go sideways and downward, rather than sideways and upward. Therefore, the loss of momentum thesis looks to be the more likely one.
Also, as is the case in the 4-hour time frame, and all the other shorter term time frames, bearish divergence is rearing its ugly head. As the price action moves higher, the Relative Strength Index indicator is trending lower.
Could the bulls still manage to push the $BTC price up to take out the key overhead resistance level, or are we soon to see the price start to break down?
Indecision in the weekly time frame
Source: TradingView
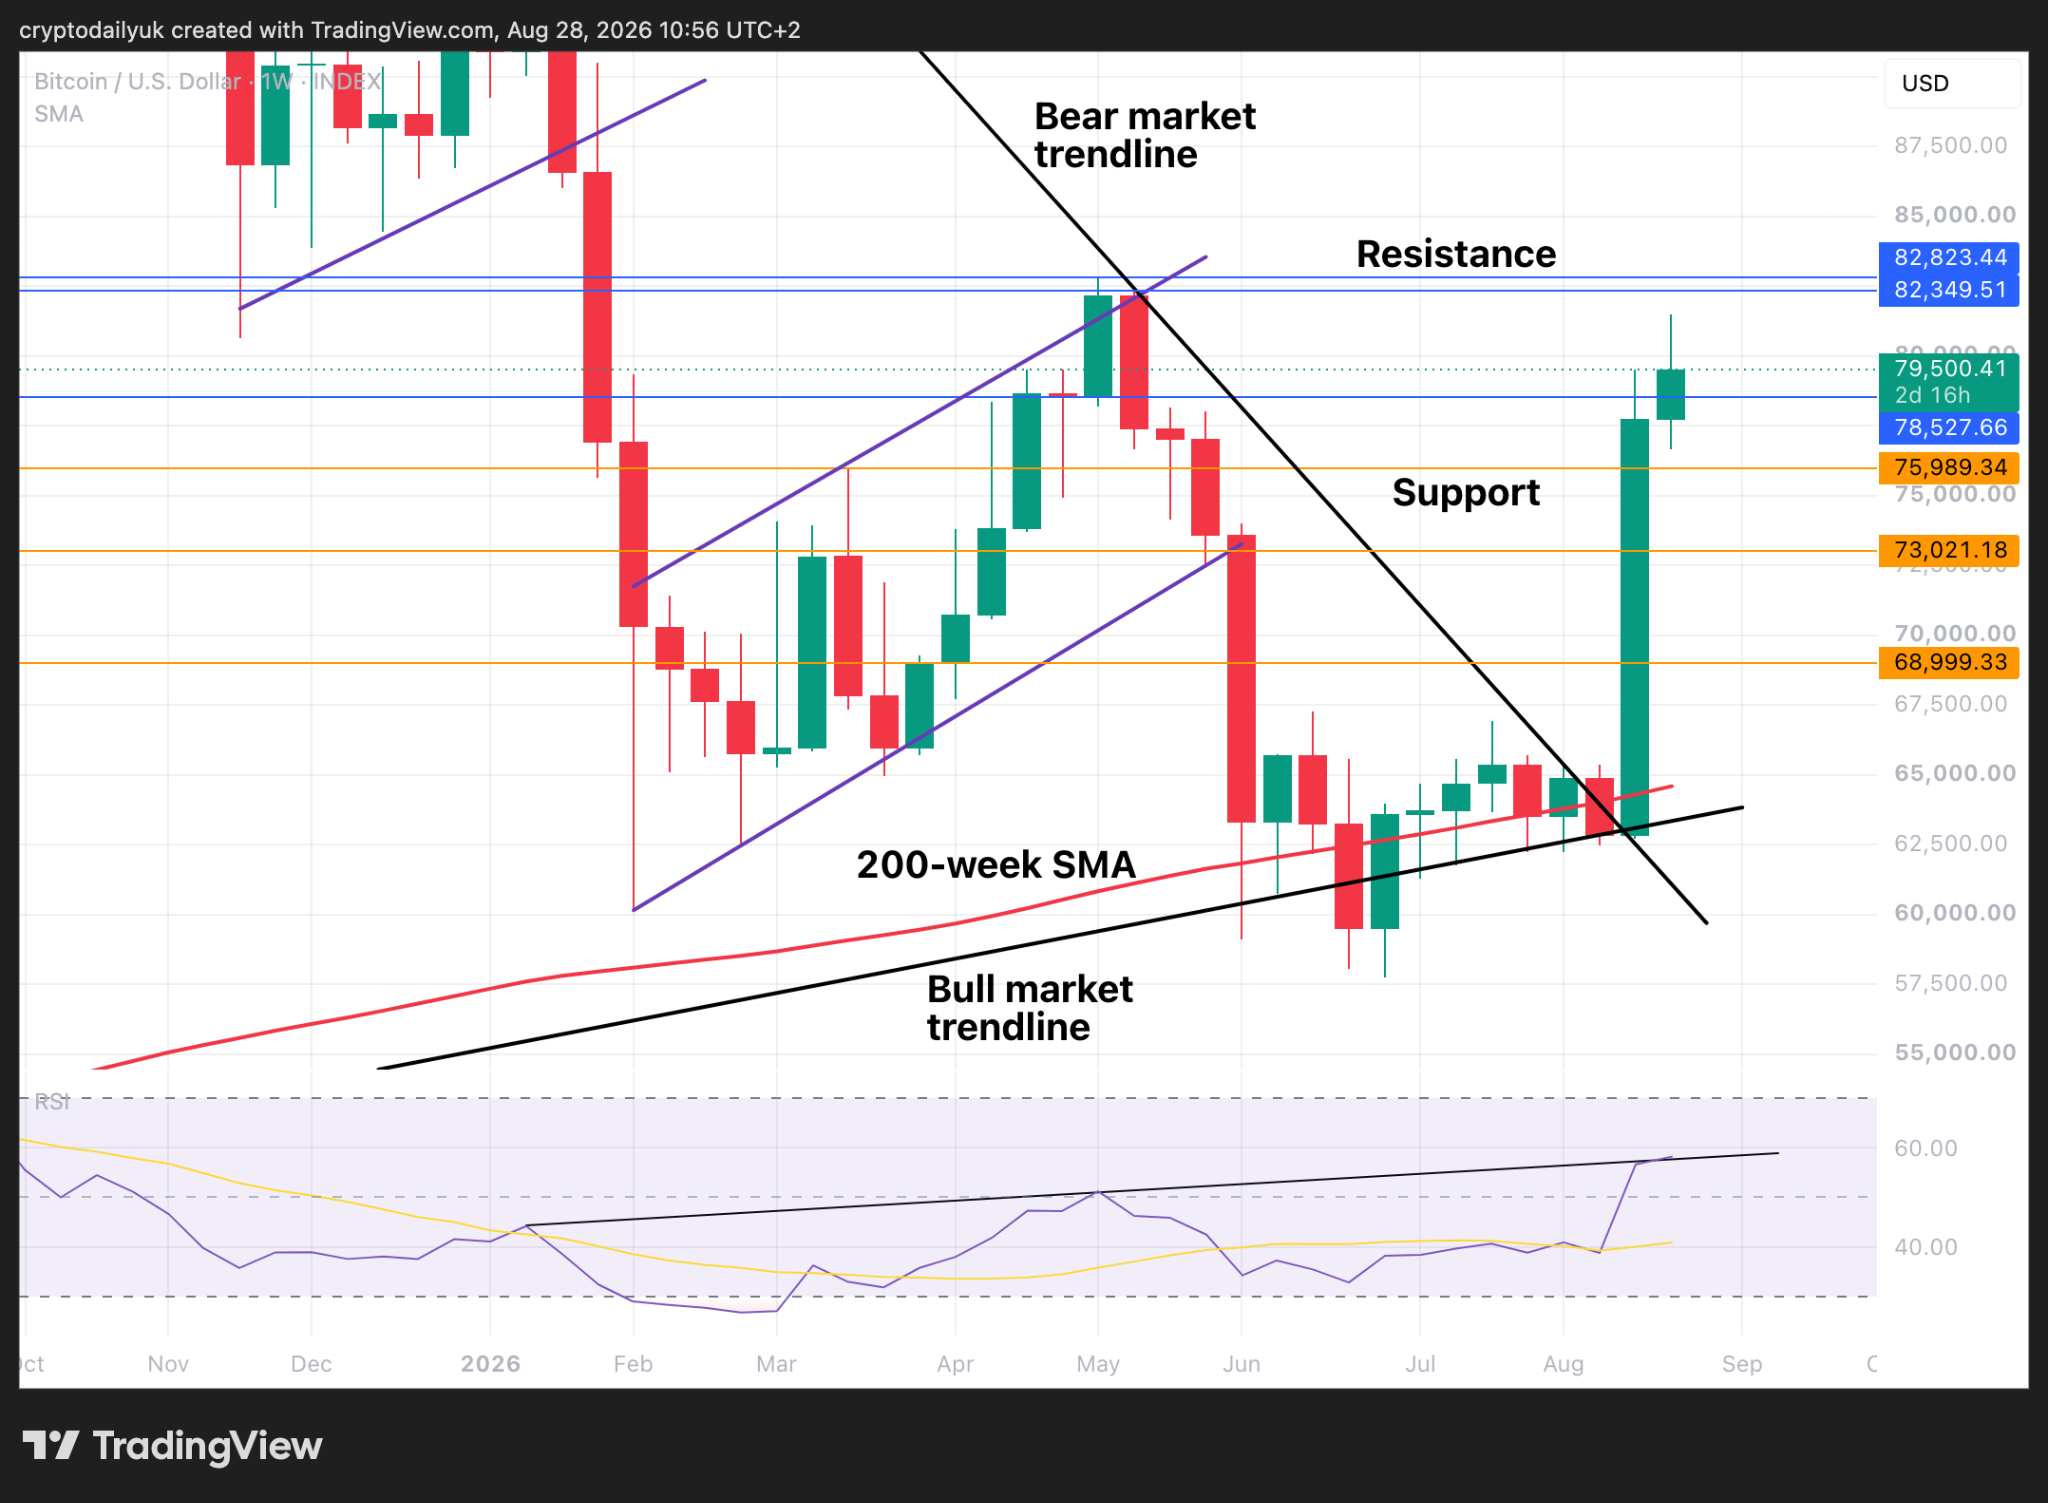
The weekly time frame view reveals that this week’s candle is one of indecision so far, with a wick and tail of roughly similar lengths, although if the $BTC price does not hold support at $79K, a longer wick could possibly spell trouble, and at the very least, the price will need to hold above $78,530 in order to flip this resistance level into support.
At the bottom of the chart, the RSI indicator line is at a crucial point. If the indicator line can be above the ascending trendline by the end of play on Sunday, this will do much to calm the nerves of the bulls.
Disclaimer: This article is provided for informational purposes only. It is not offered or intended to be used as legal, tax, investment, financial, or other advice.
Related Stories