Bitcoin Consolidation: Rally about to Resume?
 Laurie Dunn

Have the last seven days just been about consolidation for the Bitcoin price? This up and sideways price action has allowed the shorter term momentum indicators to reset. Could this mean that the rally is about to resume?
$BTC price ready to move higher after consolidation?
Source: TradingView
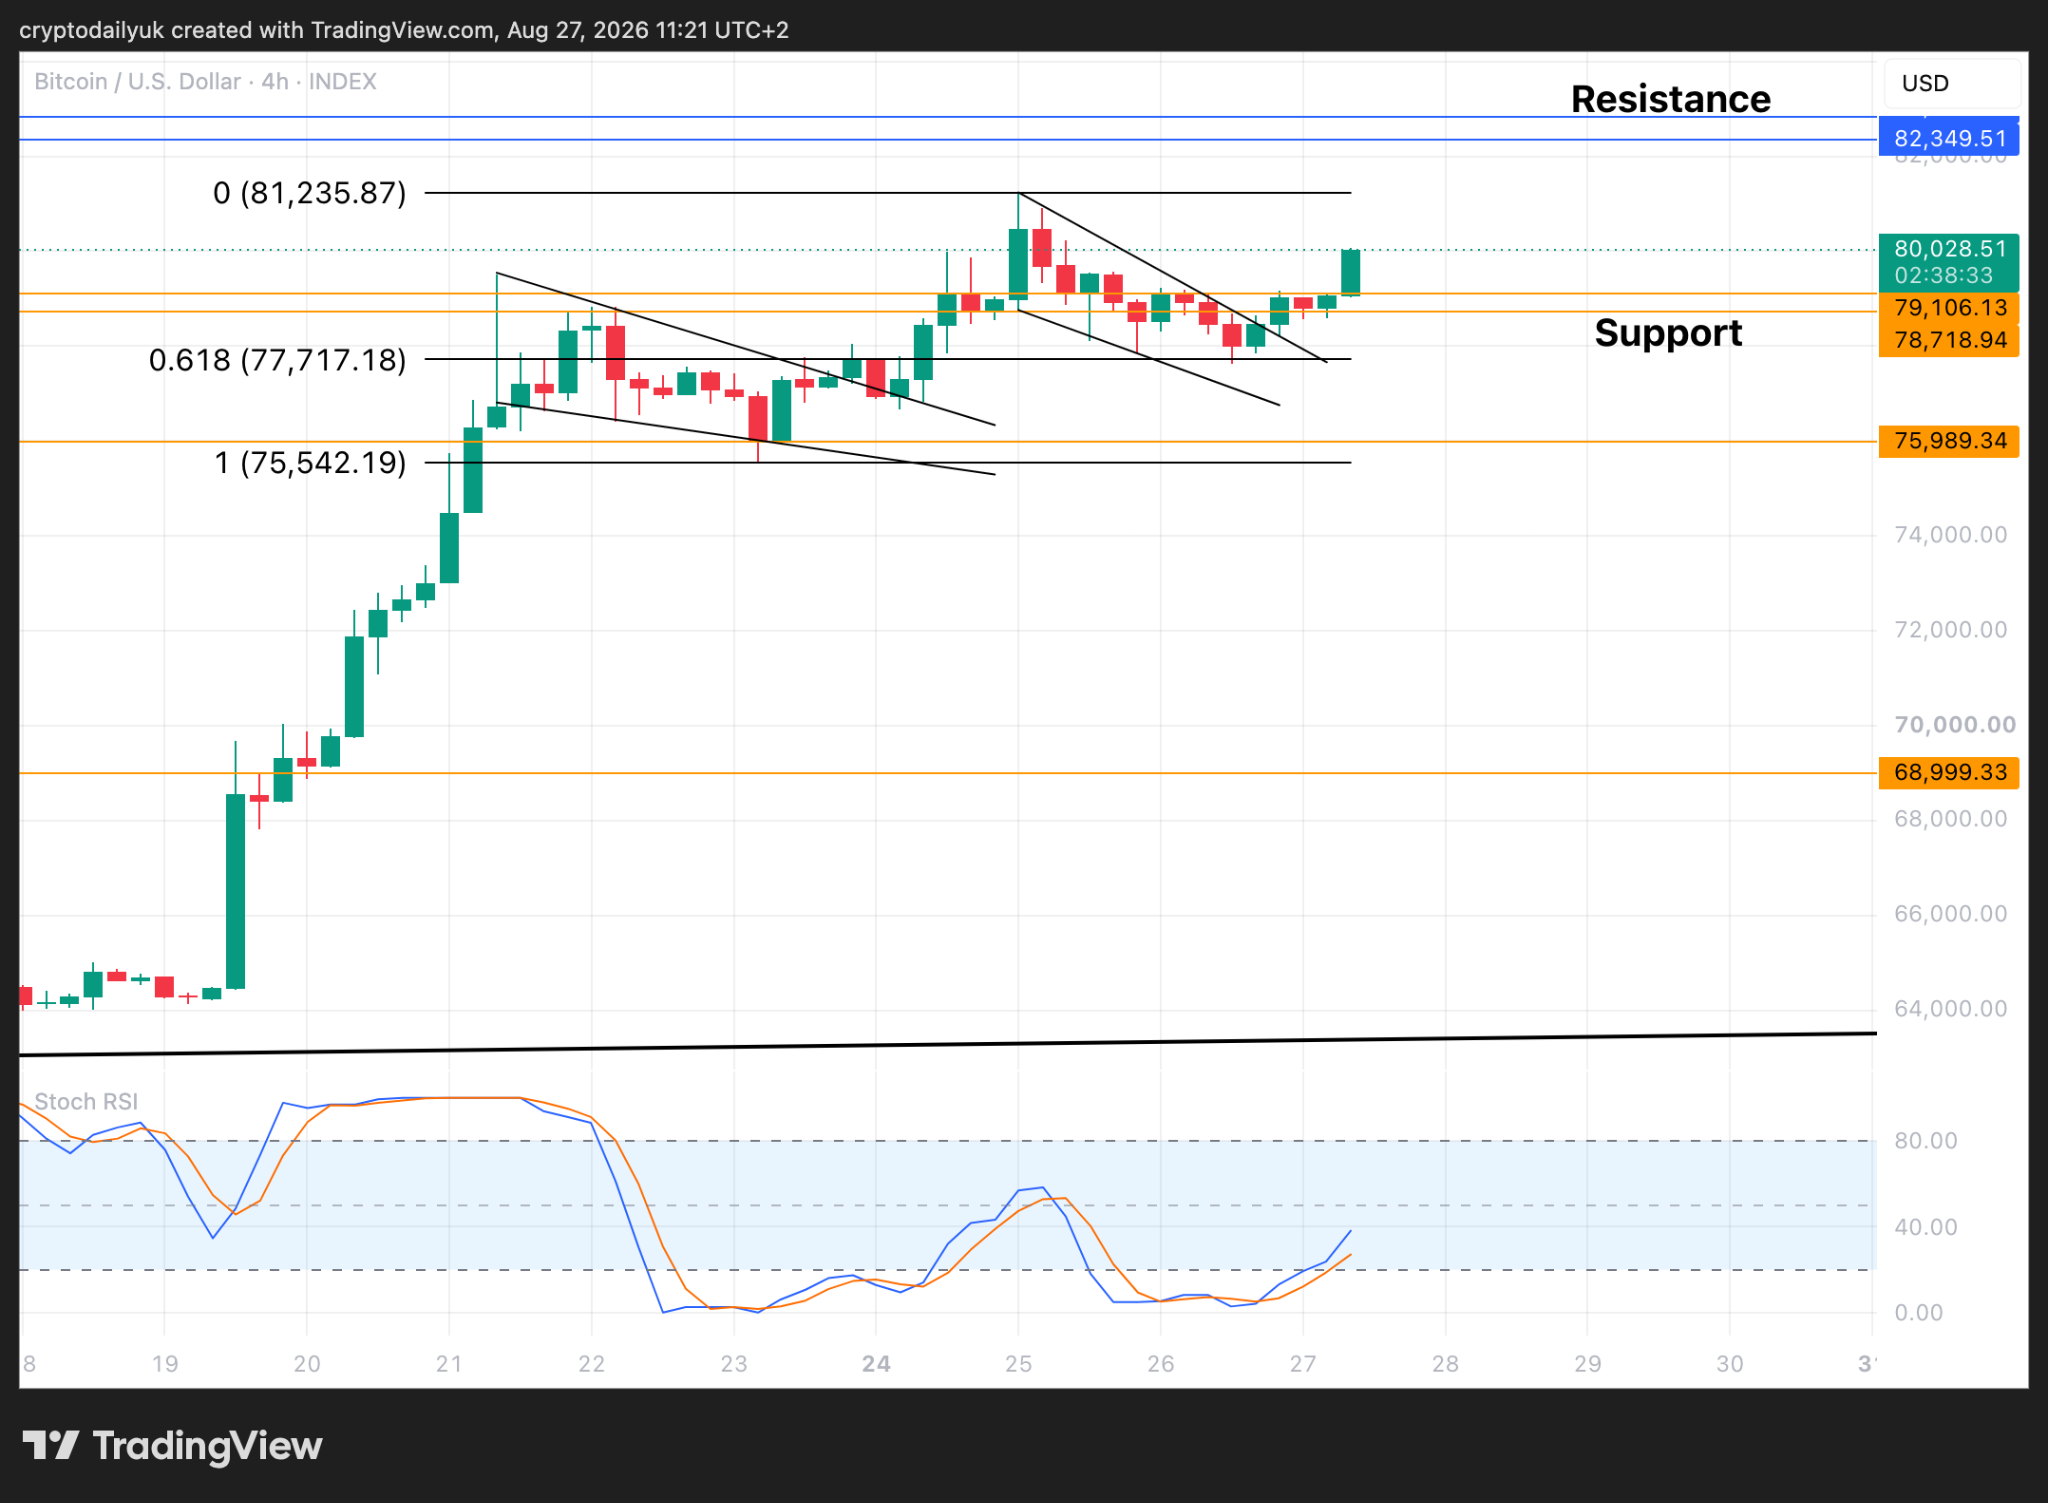
Since the huge rally that ended at $79,500, the $BTC price has generally gone sideways, although a new local high was put in at $81,235. After such a strong rally a period of consolidation was desperately needed. That said, many might have thought that the $BTC price would come back down into the mid to lower $70K area for what could be perceived as a healthier correction.
None of it. Taking the Fibonacci levels from the bottom of this sideways movement up to that local top, the price has been down to the 0.618 Fibonacci level, touched it, and has risen again. Two falling wedges are part of the consolidation, and both have broken to the upside. The most recent one broke on Wednesday and now the $BTC price is putting on a bit of a spurt, up around 1.8% so far on Thursday. Once, and if the price can surpass the last high, the main $82K - $83K horizontal resistance will be in reach.
Potential cup and handle pattern valid?
Source: TradingView
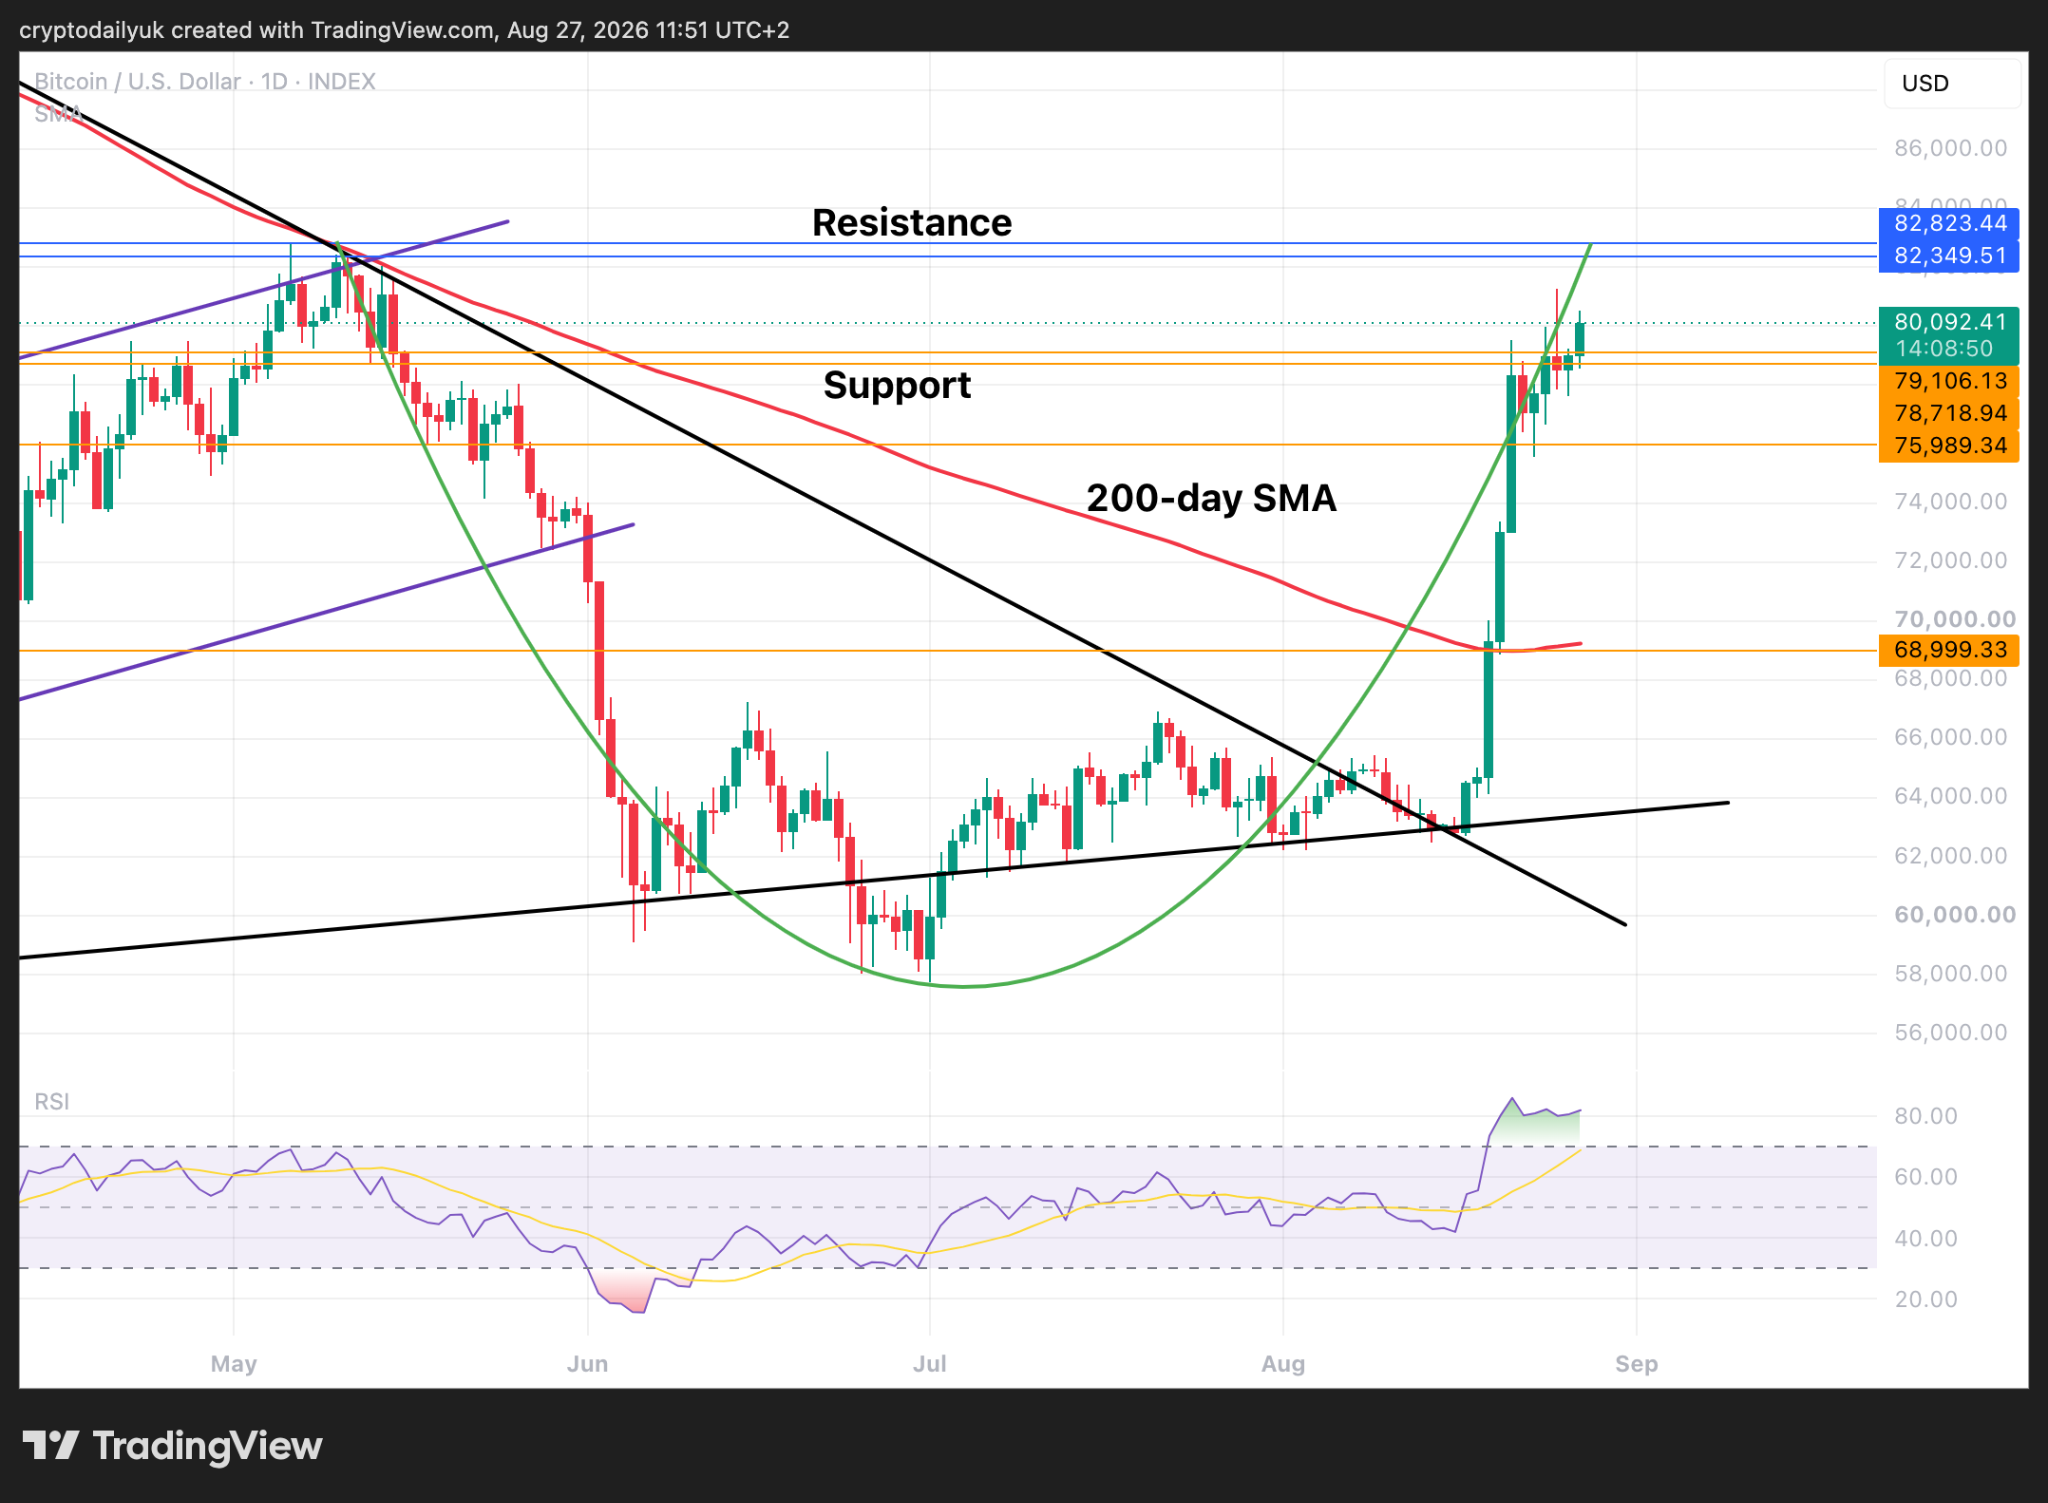
As already pointed out, there is the possibility of a cup and handle pattern forming. If the $BTC price reaches the resistance that would be the top lip of the cup. However, it has to be acknowledged that the pattern is far from ideal. A more rounded bottom and a gentler ascent for the right side of the cup would have made the pattern more reliable. That said, if the price does reach the resistance and there is a reasonably shallow correction before heading back up again, this pattern could still be confirmed.
At the bottom of the chart, the RSI indicator line is showing well overbought. The complete opposite of the heavily oversold condition back at the beginning of June. Some kind of correction is due. Could it be the one that forms a handle to the cup?
Weekly RSI trendline break about to add rocket fuel?
Source: TradingView
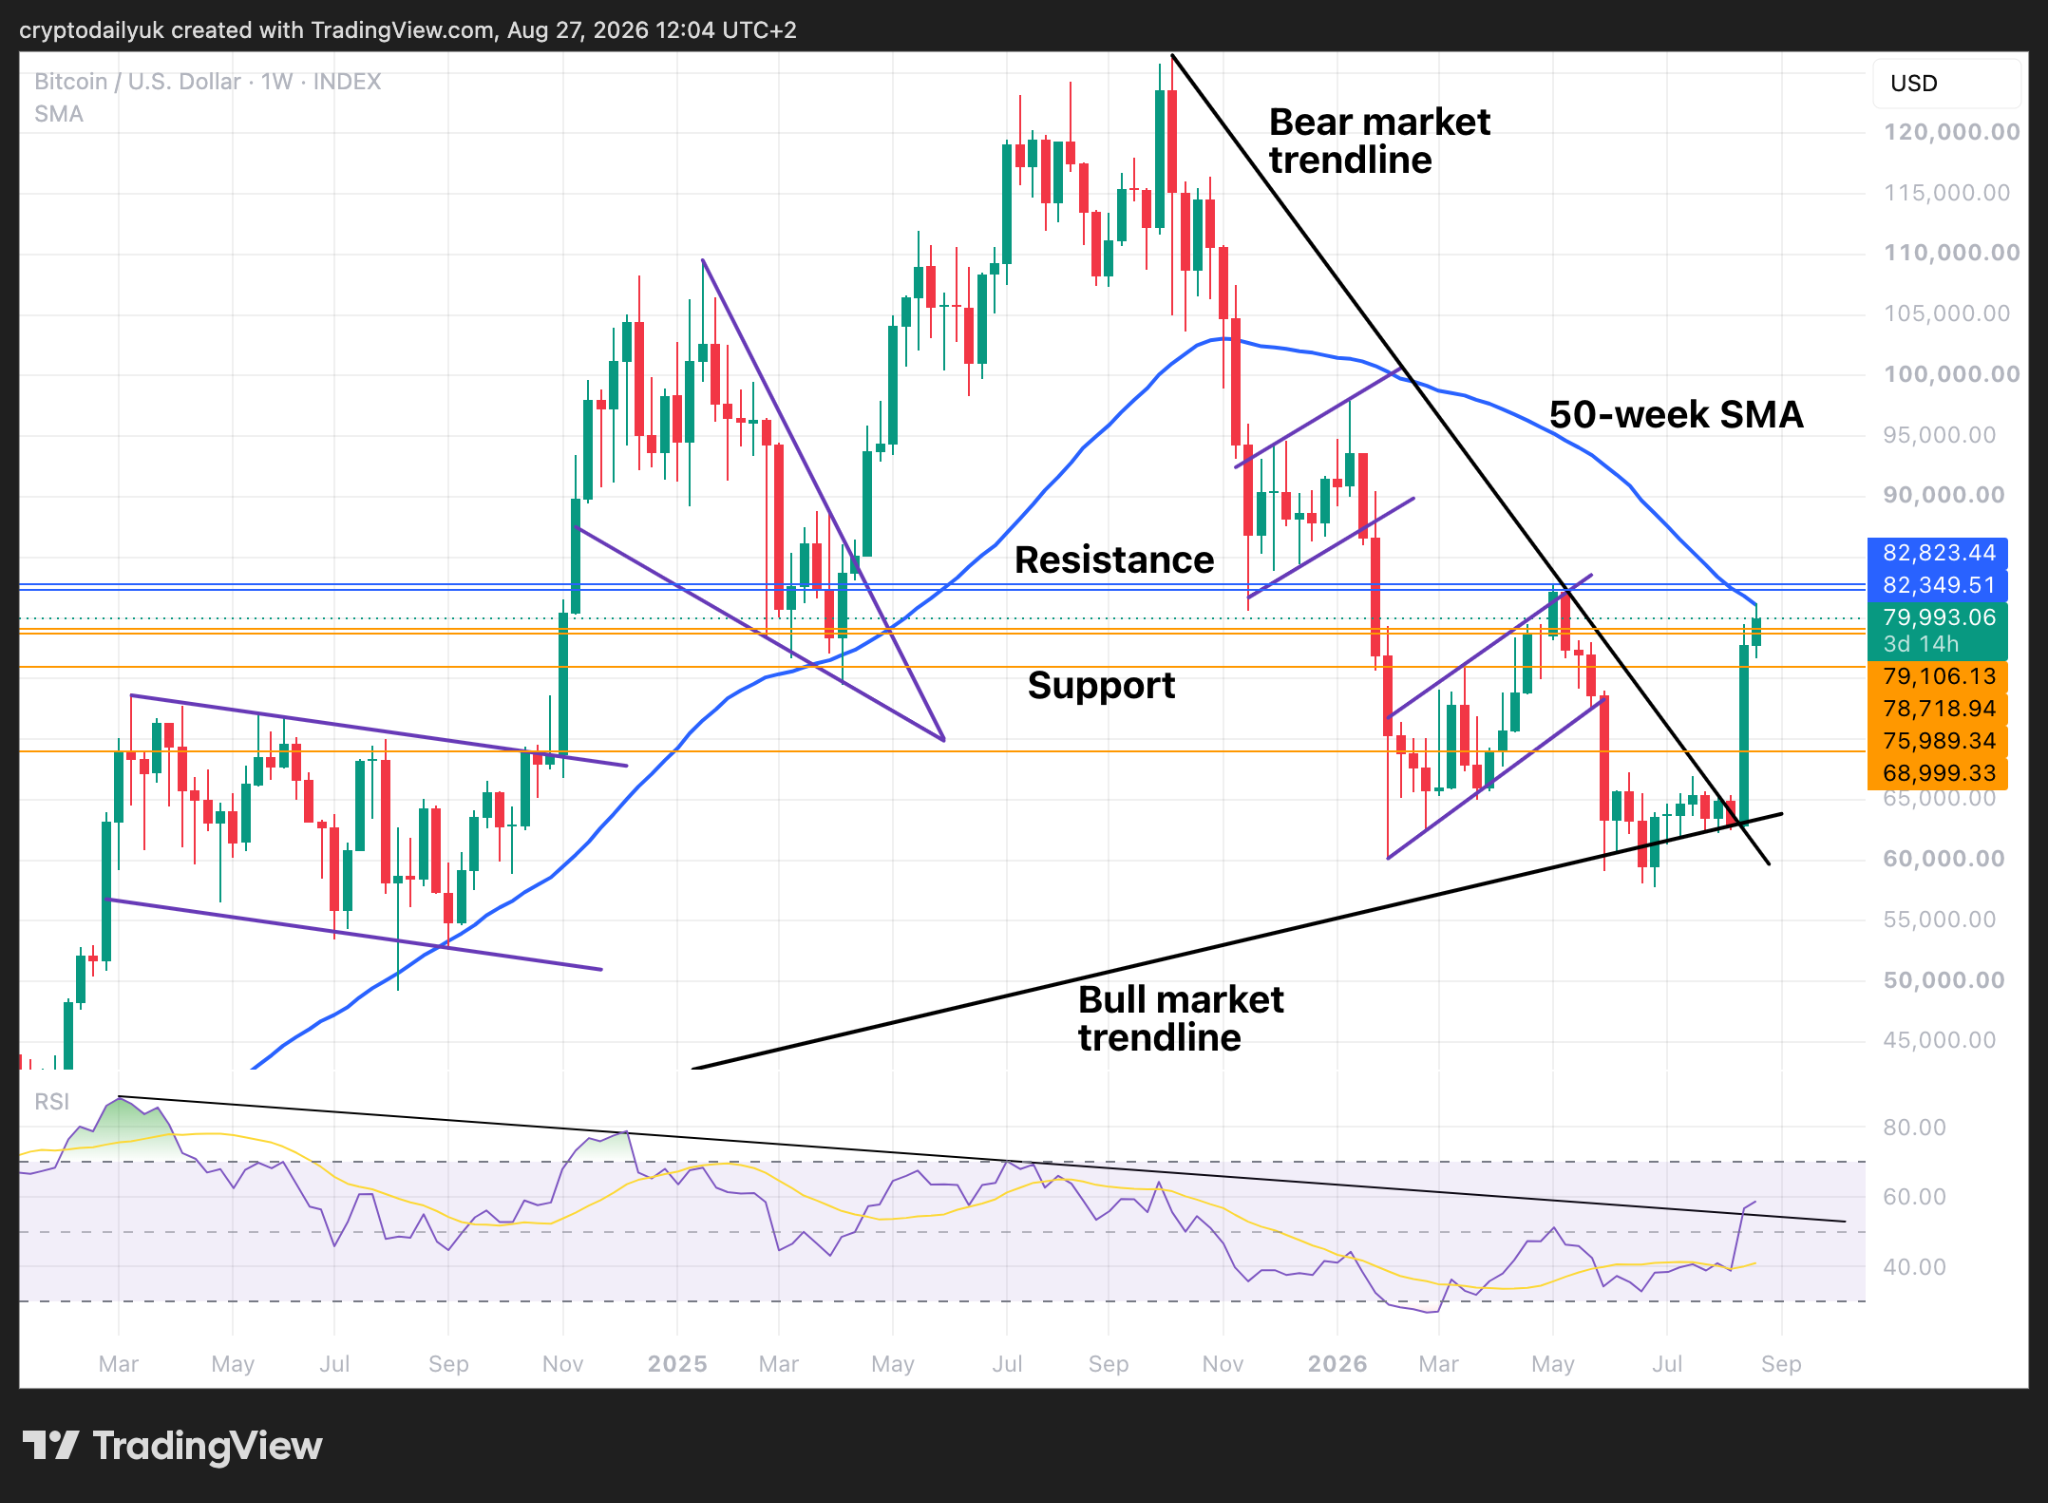
The weekly time frame shows the importance of the overhead resistance. Break this, and the $BTC price could really get away from the grasp of the bears.
Two major opposing factors attract the eye. The first is the 50-week SMA. Given how perfectly the price rejected from this moving average it will take some effort from the bulls to break and move beyond it.
In their favour is the break of the 2.5 year trendline in the RSI. This really is a major positive move, and if it is confirmed at the end of next week, this could add rocket fuel to the rally.
Disclaimer: This article is provided for informational purposes only. It is not offered or intended to be used as legal, tax, investment, financial, or other advice.
Related Stories