Bitcoin rally ending? $64K rejection and pullback, or $66K still viable?
 Laurie Dunn

The Bitcoin price has reached the $64K horizontal resistance. Is this the best place for a pullback, or will the bulls be able to push on through and drive the price up to the key $66K level?
One last push to $66K?
Source: TradingView
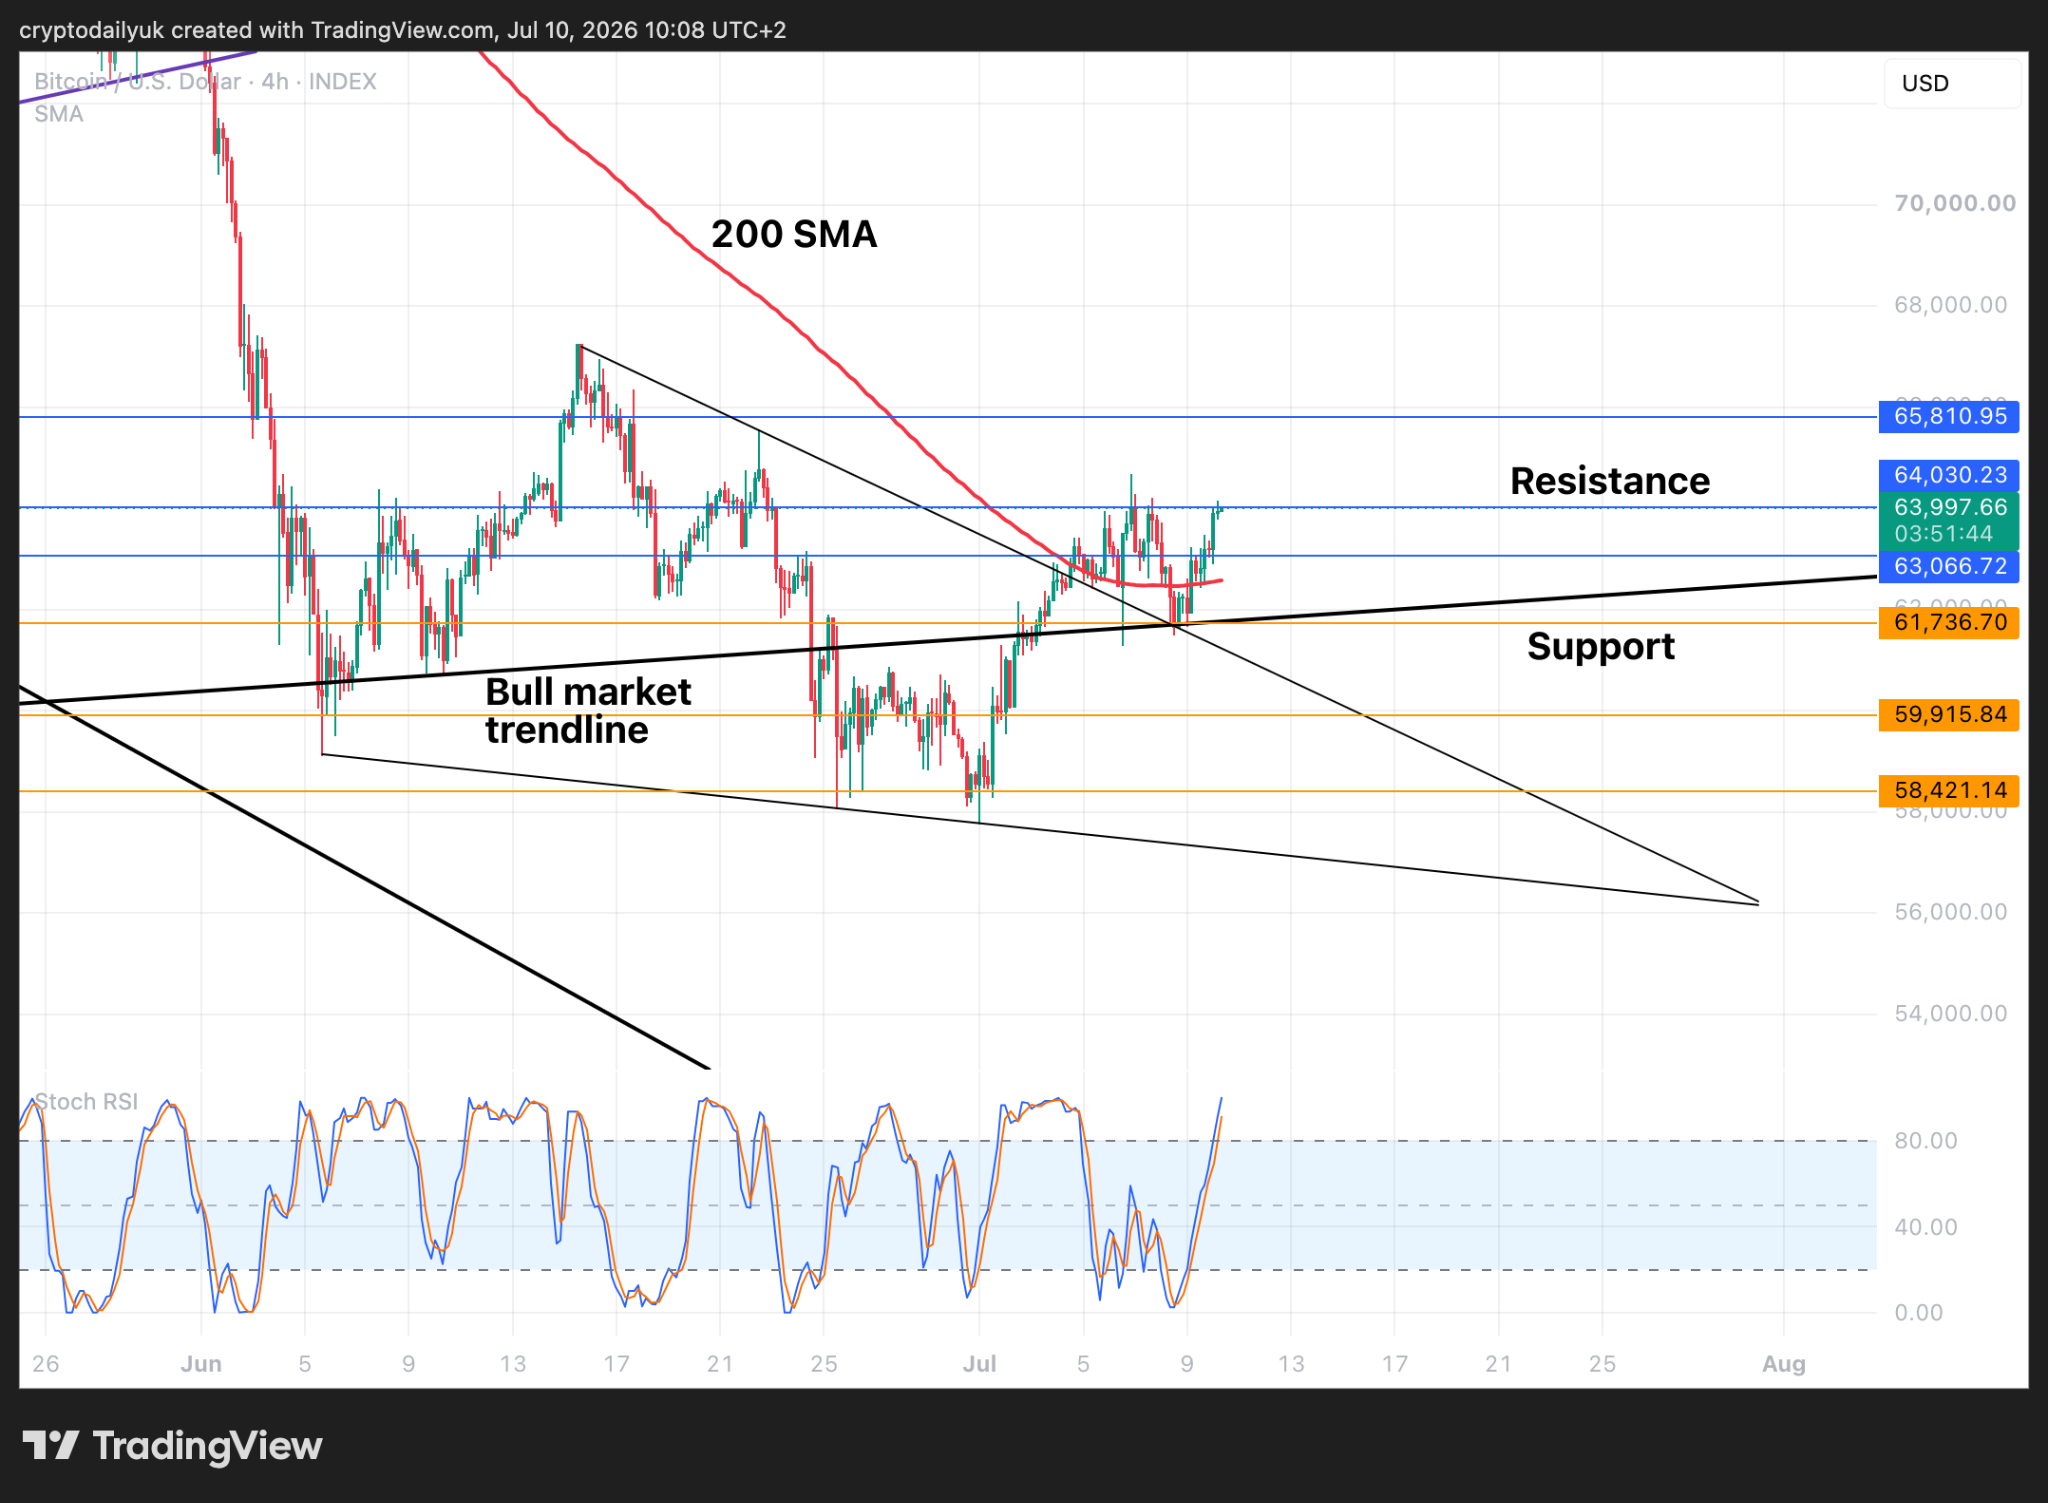
We can observe in the short-term time frame that the $BTC price has come up against strong resistance at the $64K horizontal level. Looking left, only recently the price was expelled from this resistance to fall back down to the bull market trendline. Will the bulls be able to expend one last effort to push through and make a higher high?
If the rally continues, more buyers are likely going to jump onto the positive hype and contribute to keeping it going. That said, if this current resistance is overtaken, $66K awaits above, which is hugely significant in the grand scheme of things for Bitcoin. Would the bulls have enough to successfully breach such a strong obstacle? If they did, a higher high at $67,260 would put a major rally back into play.
RSI pattern suggests higher from here
Source: TradingView
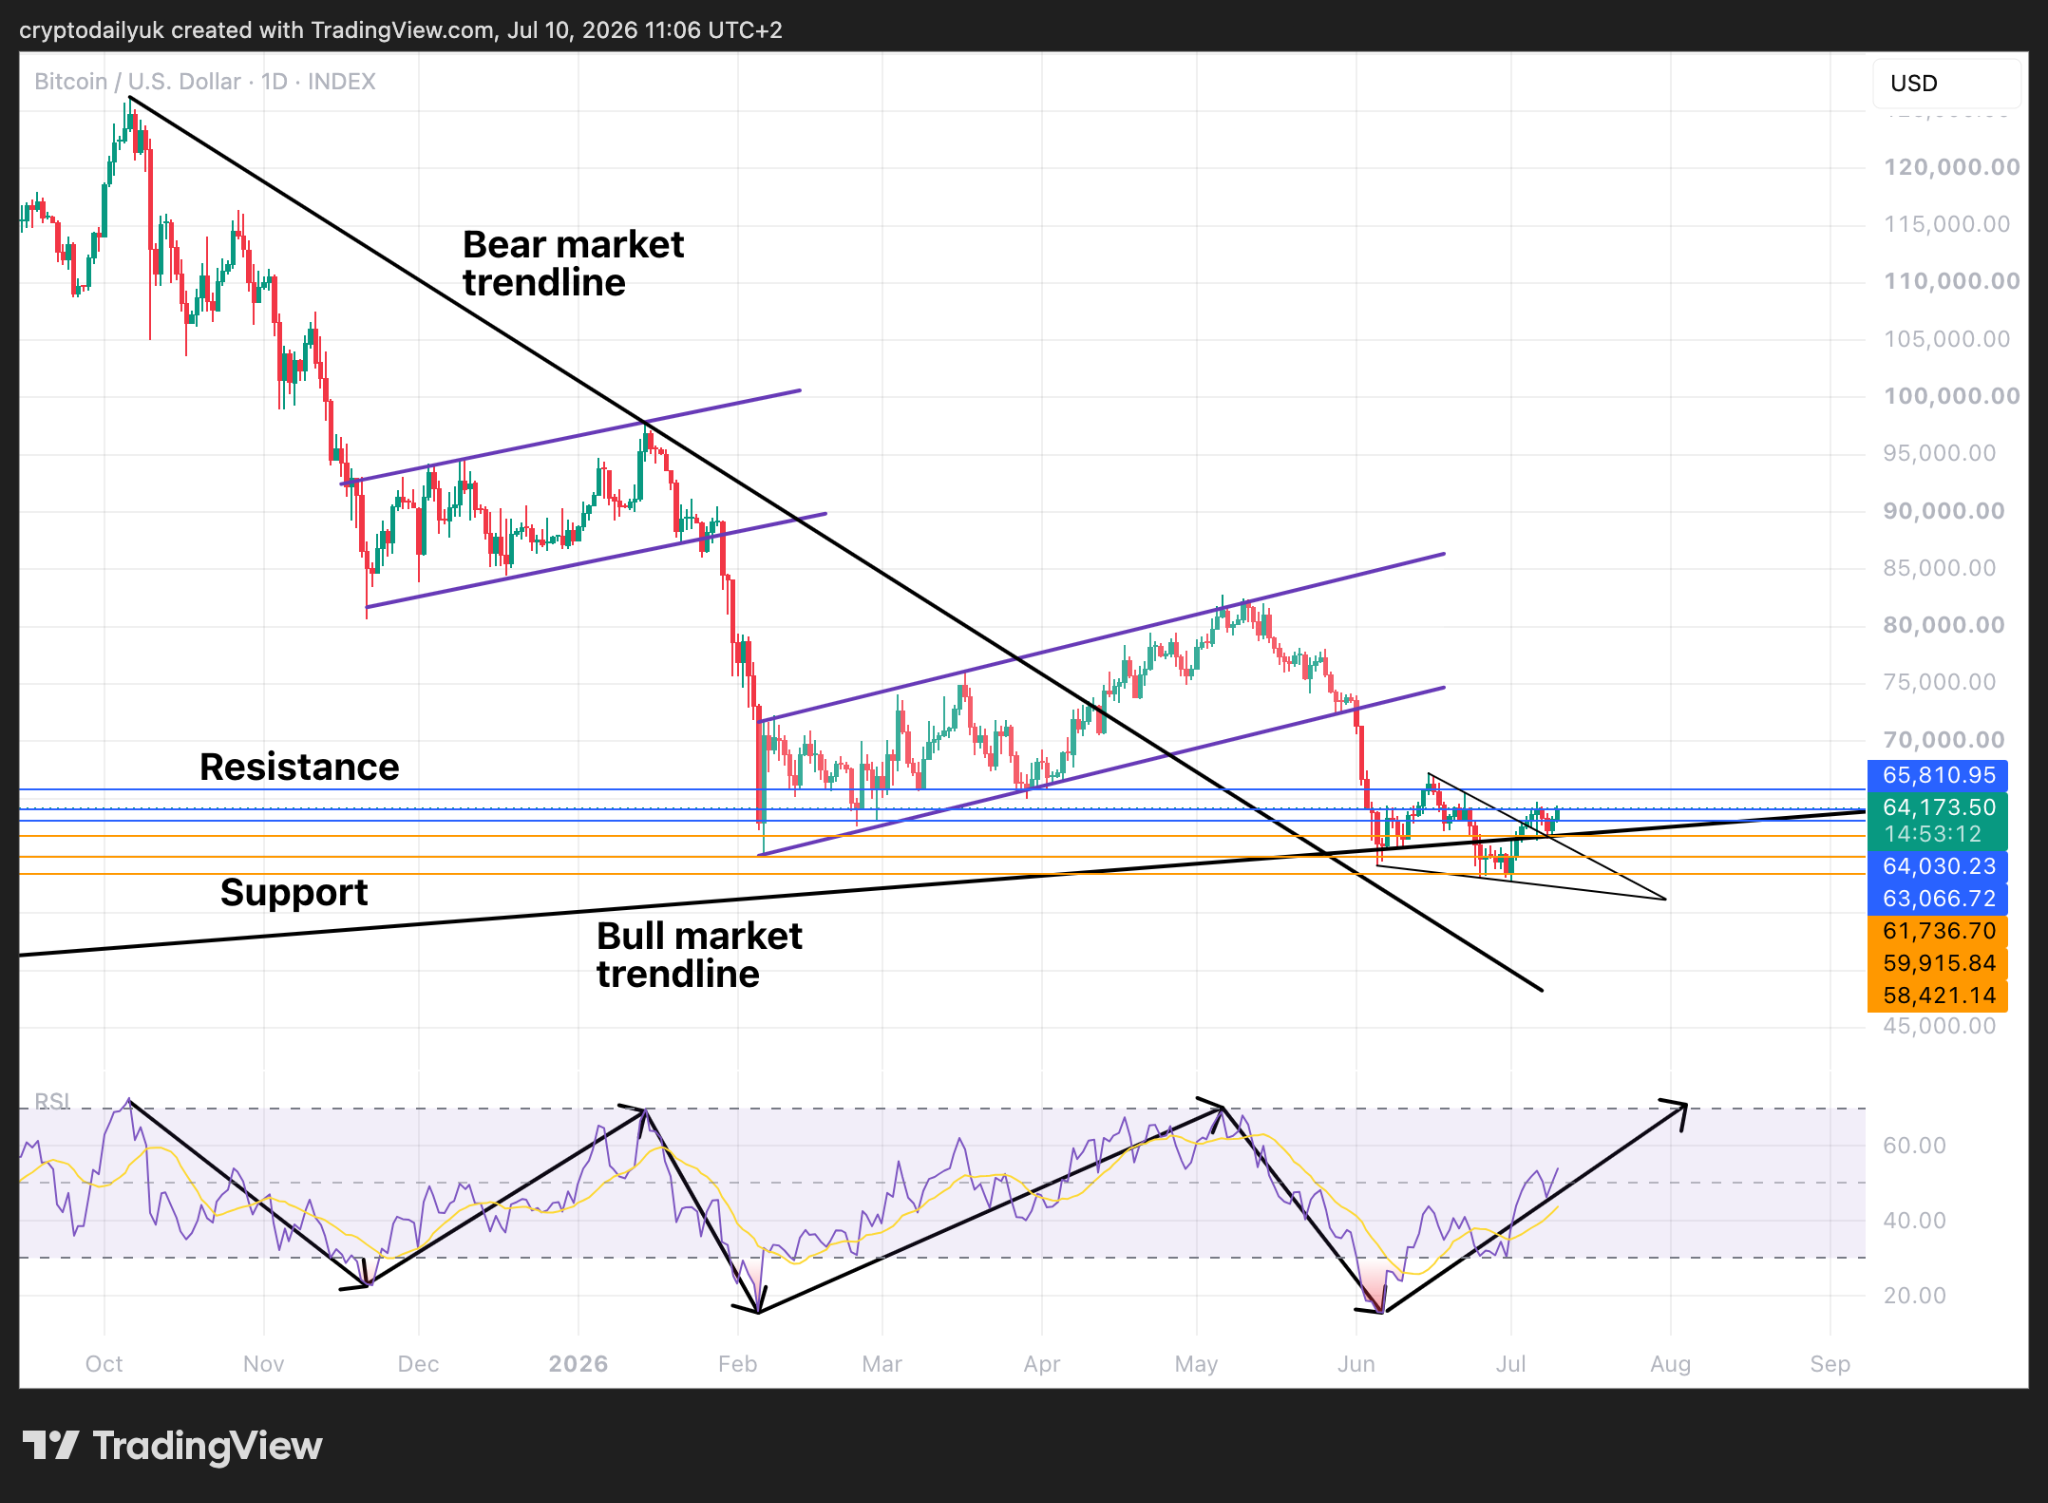
The daily chart shows the full extent of the bear market so far. Now, having bounced from the bull market trendline, wouldn’t the $BTC price now go higher?
The Relative Strength Index (RSI) has something to say about this. If one goes back to the all-time high, from where the bear market started, it can be seen in the RSI that the indicator line worked its way down until it hit a bottom that coincided with the bottom for the price action (the low of the first bear flag). It then went back up to around the 70.00 level, which generally seems to mark the high, and this was matched in the price action by the top of the first bear flag.
This pattern repeated exactly for the second bear flag, with the only difference being some divergence in the price action, which went on to make a lower low.
As the RSI indicator line works its way back up, will both this and the price action continue to head back up to the 70.00 level again?
Another thing to bear in mind is that in the last bear market, each successive high in the RSI was a lower high. The bear market ended when the downtrend was broken. This will probably happen again.
Will the weekly RSI signal a new bull market?
Source: TradingView
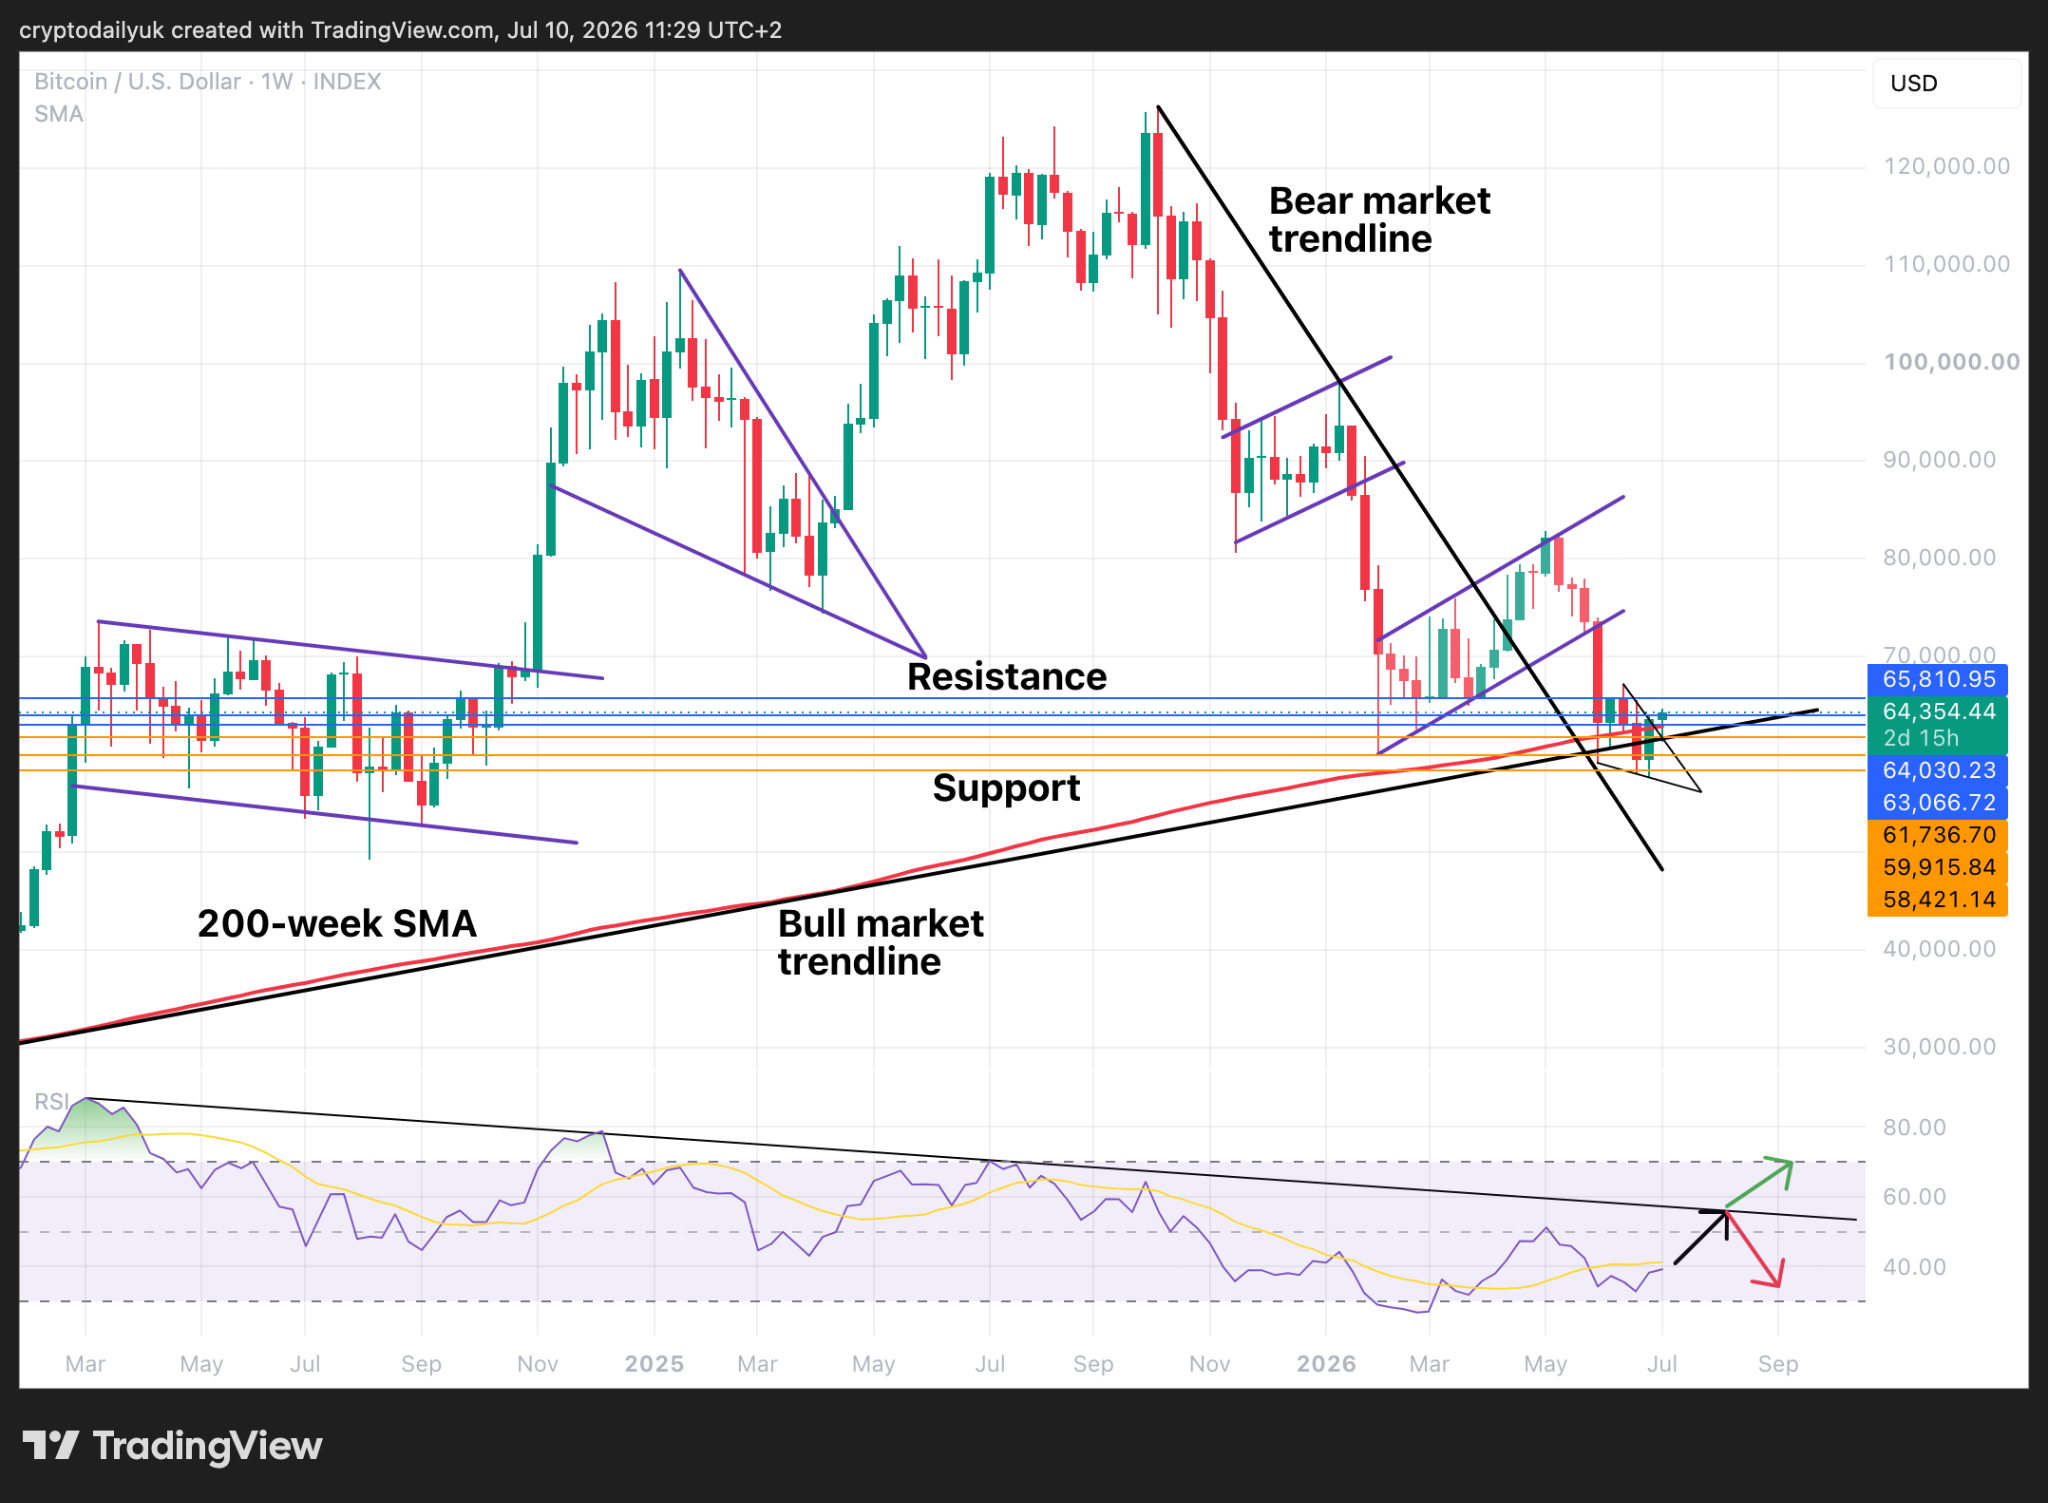
Stepping out into the weekly time frame the RSI has followed a similar pattern, although the RSI indicator line follows a more gentle decline. If, (and this is still to play out or not) the indicator line rises back to the descending trendline, what follows will decide whether we have a continuation of the bear market, or the $BTC price breaks out into a new bull market.
First things first though, we are assuming that the current rally is going to continue for a few weeks more. Can this happen?
Disclaimer: This article is provided for informational purposes only. It is not offered or intended to be used as legal, tax, investment, financial, or other advice.
Related Stories