Solana ETF Paradox: Why SOL Fund Assets Can Grow While Price Action Stays Weak

Mid-June delivered a head-scratching split-screen for Solana. U.S.-listed spot SOL ETFs showed total net assets of $861 million and cumulative net inflows of $1.127 billion, according to SoSoValue figures reported on June 16, 2026 (TokenPost).
Yet just days earlier, SOL’s spot price briefly slipped below $65 amid weak demand and bearish signals on June 10 (Invezz). Flows in. Price down. It’s the Solana ETF paradox in real time.
The tape adds more contrast: on June 15, U.S. spot SOL ETFs took in $2.81 million of net inflows for the day, with Fidelity’s Solana Fund (FSOL) accounting for $2.66 million (TokenPost). Meanwhile, leveraged Solana ETFs also drew capital despite weakness—ProShares’ Ultra Solana ETF (SLON) saw an estimated $1.39 million inflow on June 8 (TipRanks), and a 2x Solana ETF (SOLT) recorded a $4.69 million inflow on June 1, with around $146.07 million AUM at that snapshot (TipRanks).
Editor's note: SOL ETF inflows coincided with flat or negative price action while perps open interest climbed. Conversations with market makers echoed it—cash creations and derivatives reduced the immediate spot footprint. It reinforced my view that AUM milestones are adoption signals, not short-term catalysts, and that structure often dictates how much of a flow actually reaches the tape. — Sophia Bennett
ETFs are pipes for capital, not on/off switches for price. When net creations in SOL funds outpace redemptions, assets under management (AUM) can rise even during lackluster spot performance. This matters for allocators evaluating vehicles, traders watching basis, and builders gauging the ecosystem’s capital base.
Flows can decouple from price in the short run because AUM reflects both market value and the quantity of shares created; price reflects marginal trades in the underlying market.
Who’s affected? Retail and advisors using spot ETFs for custody-light exposure; leveraged ETF traders seeking daily magnified moves; authorized participants (APs) hedging creations/redemptions; and the broader Solana market where derivatives, liquidity, and on-chain activity intersect with ETF plumbing.
How ETF Assets Grow When Prices Don’t
ETF AUM is simple on paper: number of shares outstanding multiplied by net asset value (NAV). NAV itself follows the reference basket—in this case, spot SOL held or synthetically replicated by the fund. When investors buy ETF shares and APs deliver the creation basket, shares outstanding increase. If new creations more than offset any price drift, headline AUM still grows.
Creations outpacing drawdowns
Consider a week when SOL slips, but investor demand turns steady to positive. Creations keep adding shares, while the weaker NAV trims per-share value. The product of the two can still rise—enough that aggregate AUM expands. That’s especially visible in a launch or adoption phase when inflows are building a base regardless of near-term price.
Cash versus in-kind flows
Crypto ETFs can operate with cash creations/redemptions (issuer or AP buys/sells underlying) or in-kind (underlying delivered). With cash, APs may hedge using futures, swaps, or spot before sourcing SOL for settlement. Either way, creations raise shares outstanding even if net buying pressure on spot is muted by hedging or offsetting flows elsewhere.
How creations actually happen
- Investor demand lifts ETF share buying on-exchange above supply at fair value.
- APs step in to create new shares by delivering the required basket (cash or SOL), arbitraging premiums.
- The issuer issues new shares; shares outstanding increase.
- APs hedge during and after creation to manage exposure (e.g., via perps/futures).
- If redemptions later outpace creations, the process reverses and shares outstanding fall.
Net result: sustained net creations can lift AUM even during drawdowns, particularly when an ETF is still gathering assets from model portfolios, retirement accounts, and DCA programs.
Leveraged SOL Products Add Fuel—and Noise
Leveraged ETFs complicate the picture because they aim for a multiple of daily returns, typically using swaps or futures. Rebalancing at the close can create predictable hedging flows but also “path dependency”—performance depends on the sequence of returns.
June flows highlight demand for leverage
Despite SOL’s softness, ProShares’ Ultra Solana ETF (SLON) attracted about $1.39 million on June 8—roughly 9.1% of its assets at the time (TipRanks). Earlier in the month, a 2x Solana ETF (SOLT) saw a $4.69 million inflow on June 1 and had around $146.07 million AUM in that snapshot (TipRanks).
These products don’t necessarily hold spot SOL in the same way as unlevered spot funds. They often use derivatives and cash collateral, meaning their inflows don’t map 1:1 to spot demand. Yet their hedging activities can still influence intraday liquidity and basis.
Compounding and tracking headwinds
Daily reset creates compounding effects: after choppy, mean-reverting periods, leveraged ETFs can underperform a simple multiple of the underlying’s cumulative move. Fees, funding (for swaps/perps), and slippage add friction. Bottom line: AUM can rise on fresh flows while path-dependent performance sours, and none of that guarantees lift for SOL’s spot price.

Reading June’s Tape: Flows, Funds, and a Soft Spot Price
June’s ledger shows the paradox clearly—money moving into SOL funds while spot stumbled.
| Date (2026) | Event | Fund/Ticker | Noted Figure | Source |
|---|---|---|---|---|
| Jun 1 | Leveraged 2x SOL ETF sees inflow | SOLT | $4.69M inflow; ~$146.07M AUM snapshot | TipRanks |
| Jun 8 | ProShares Ultra Solana inflow | SLON | ~$1.39M (≈9.1% of fund assets) | TipRanks |
| Jun 10 | Spot price dips | SOL | Briefly below $65 | Invezz |
| Jun 15 | Daily net inflows to U.S. spot SOL ETFs | FSOL contribution | $2.81M total; $2.66M from FSOL | TokenPost |
| Jun 16 | Snapshot of U.S. spot SOL ETFs | Category | $861M AUM; $1.127B cumulative net inflows | TokenPost |
Takeaway: flow prints and AUM can look healthy while the underlying market trades heavy. That duality is normal in a maturing ETF ecosystem where investor adoption, hedging, and market structure interact.
What This Means for Price Discovery on Solana
Spot ETFs can transmit demand to underlying markets—but the connection isn’t linear. If creations are cash-based, APs may accumulate SOL over time rather than all at once, matching risk to hedges. If APs lean on derivatives to offset exposure, the immediate burden on spot order books can be lower than naïve “inflows = buy pressure” models suggest.
Hedging and basis dynamics
APs and liquidity providers often hedge creation exposure via perps or futures, then unwind as they source or deliver SOL. That changes how and when demand reaches spot. Meanwhile, funding rates, term basis, and borrow availability influence the cost of that hedge. In tight liquidity or during volatility spikes, hedging flows can briefly push price around—but they can also absorb demand that would otherwise hit spot immediately.
Liquidity fragmentation
Solana liquidity is split across centralized exchanges and on-chain venues. Execution quality depends on routing, fees, and slippage. ETF-related hedging may concentrate on the most liquid pairs and venues, diluting the footprint in the broader market. Thus, large inflows can coexist with soft price action if liquidity is deep enough or if derivative hedges dominate.
Narratives versus tape
Positive narratives (inflows, AUM milestones) can boost sentiment, but price discovery still happens at the margin. If broader risk appetite is weak, or if traders sell bounces, SOL can languish despite constructive ETF data. The June pattern—capital still entering funds while price dipped—fits that playbook.
Investor Implications: How to Interpret AUM and Flow Prints
Separating signal from noise helps avoid mistakes when positioning around ETFs. Consider the following checklist when you see “big inflows” headlines:
- Check shares outstanding and NAV: Rising AUM with rising shares outstanding but flat/weak NAV implies creations are driving the growth.
- Compare market price to NAV: Premiums can invite AP arbitrage and fresh creations; discounts can slow them or trigger redemptions.
- Map flows to structure: Spot ETFs transmit demand differently than leveraged ETFs that use swaps or futures.
- Watch derivative metrics: Perp funding, term basis, and open interest hint at the hedging backdrop that may offset spot demand.
- Consider timing: Daily inflow prints don’t reveal intraday execution or the pace of cash-to-spot conversions.
- Contextualize narratives: Cross-asset risk, rotation, and macro data can dominate short-term token moves even when ETF adoption expands.
For advisors and allocators, AUM expansion may indicate growing comfort with the vehicle and improved liquidity characteristics (tighter spreads, deeper markets). For traders, flows are one input among many—and they rarely override a bearish tape on their own.
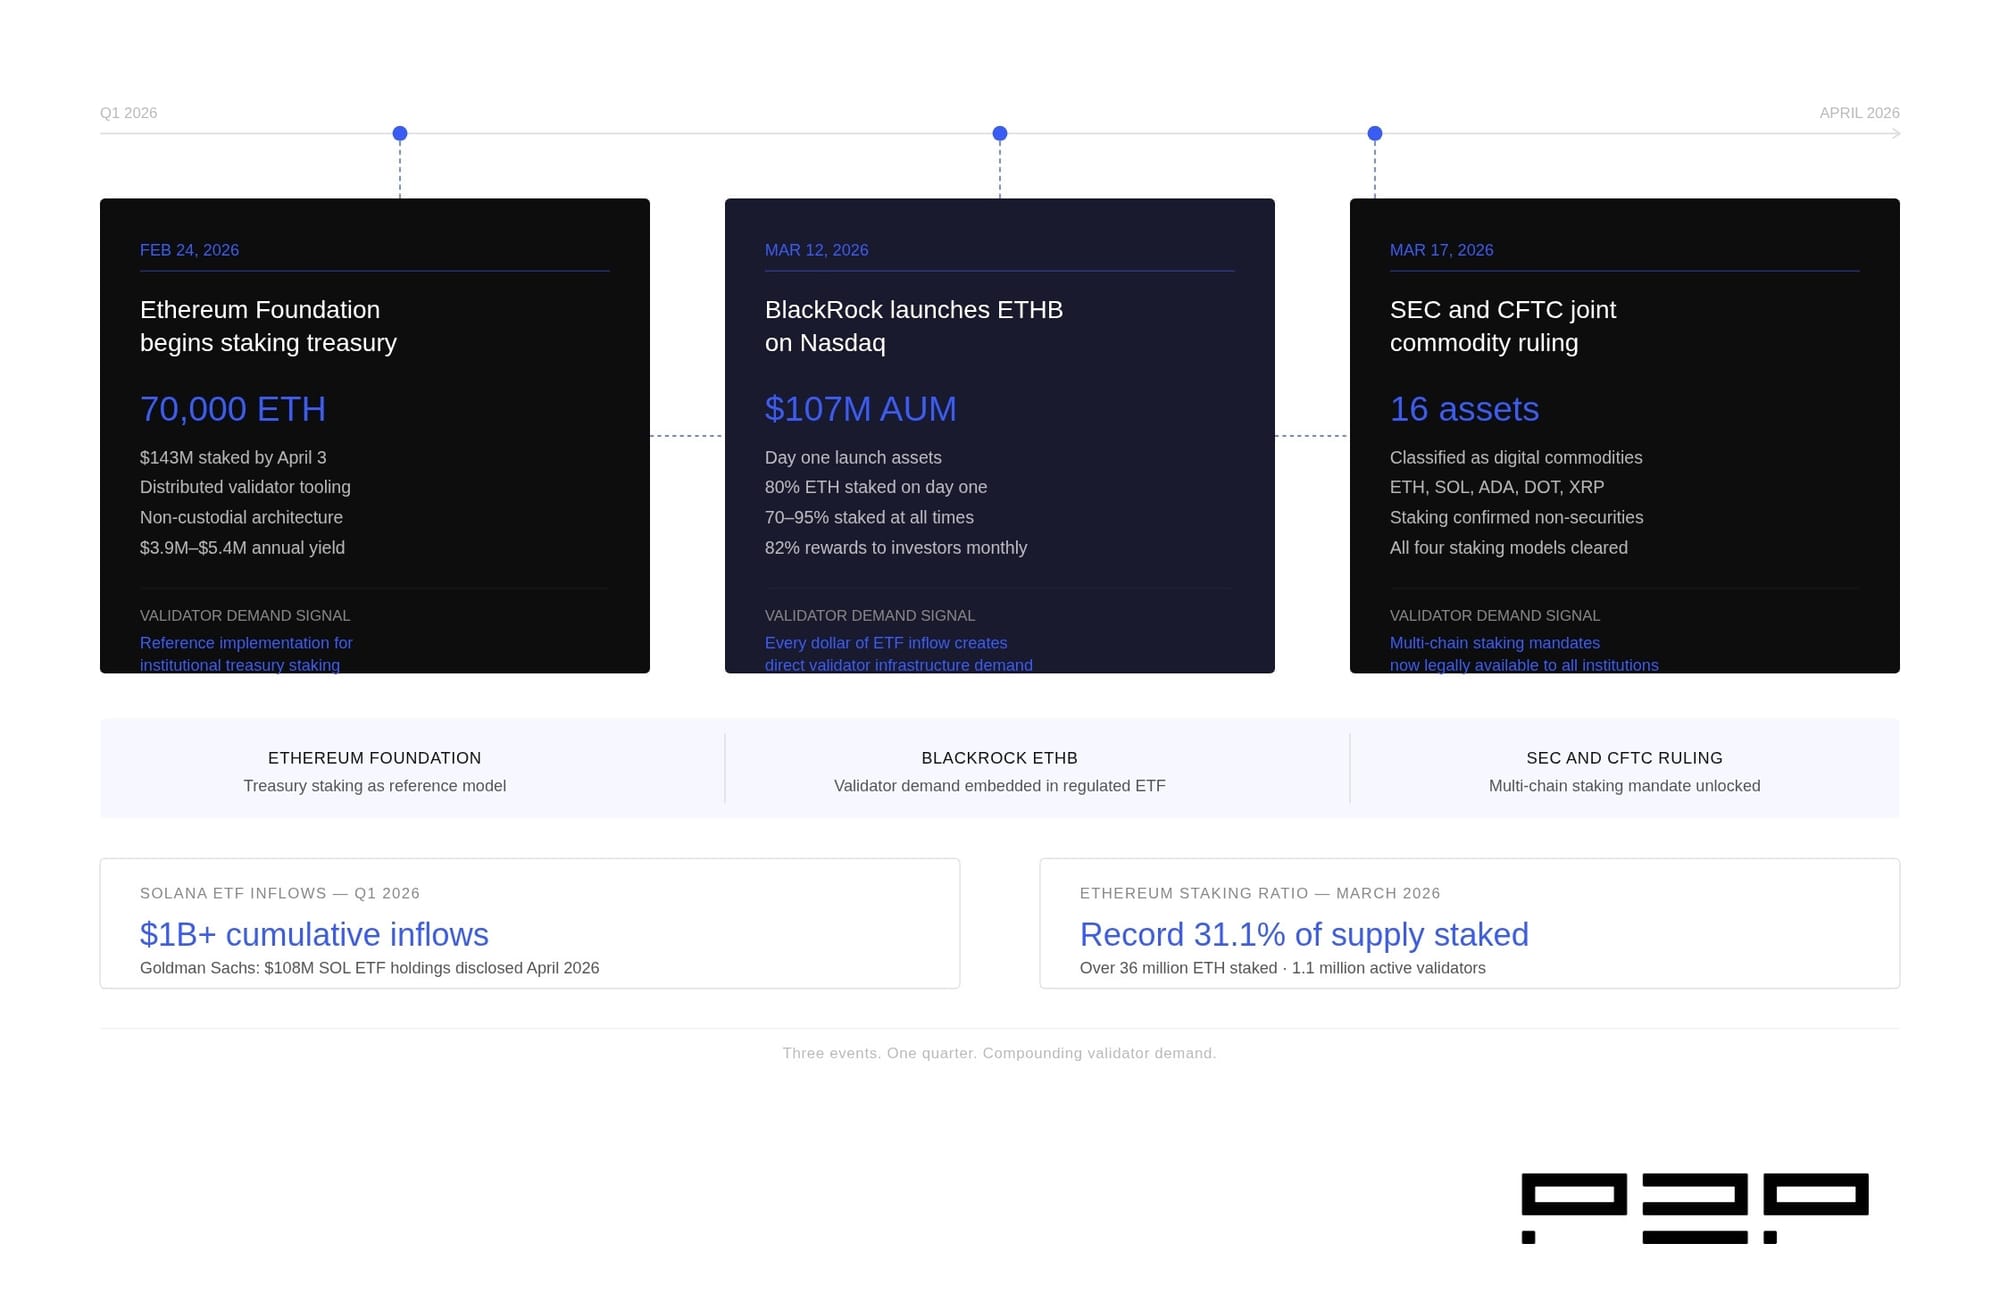
Timeline infographic of Q1 2026 institutional crypto milestones (ETH staking, BlackRock ETHB launch, SEC/CFTC commodity ruling) — shows the institutional events that help explain why staking-enabled ETFs (including SOL products) began to attract capital even when spot price momentum was weak. — Source: P2P.org (editorial infographic)
Structural Drivers That Can Decouple AUM and Token Price
Some forces pull ETF AUM and token prices in different directions, at least temporarily:
Tax and account structures
Advisors can route exposure through tax-advantaged or compliance-friendly wrappers. That steady allocation cadence—think monthly DCA or model rebalances—adds creations even if traders are risk-off.
Issuer seed and model adoptions
Issuers may seed funds, and later, platforms or models adopt them. Each event can add shares outstanding regardless of price drift, especially in the first quarters after launch.
Marketing cycles and product shelf space
Distribution matters. Products placed on big platforms or receiving coverage can attract sticky flows. When those flows meet an unfriendly tape, you still get positive AUM growth without immediate price follow-through.
Leveraged fund dynamics
In leveraged products, daily rebalancing, path dependency, and derivative collateral mean inflows don’t translate cleanly to spot demand. AUM can balloon on risk appetite while spot remains range-bound or soft.
Risks & What Could Go Wrong
- Tracking and execution risk: Cash creations and derivative hedges can introduce tracking error versus spot SOL.
- Liquidity shocks: Stressed markets can widen spreads, raise funding costs, and impair AP arbitrage, decoupling ETF prices from NAV.
- Leverage decay: Choppy markets can erode returns for daily-reset leveraged ETFs relative to a simple multiple of SOL’s move.
- Regulatory shifts: Rule changes or labeling restrictions could affect product structures, hedges, or investor access.
- Counterparty exposure: Derivative-based strategies add counterparty and collateral risks absent in pure spot-holding funds.
- Operational events: Network or exchange outages can disrupt hedging and pricing, amplifying dislocations.
- Concentration of flows: Heavy reliance on a few APs or venues can create fragility if one steps back.
ETF inflows, even large ones, are not a shield against volatility—market structure can spread, delay, or mute their impact on spot price.
For continuing coverage of fund flows, on-chain signals, and market structure shifts, Crypto Daily tracks daily data and issuer updates in one place (Crypto Daily).
Frequently Asked Questions
Can ETF inflows force SOL’s price higher?
Not necessarily. Spot ETF creations add shares outstanding and can translate to underlying demand, but hedging and cash-based processes may spread buying over time. If broader markets are risk-off, inflows may not overpower selling pressure in the short term.
Why can AUM rise while SOL’s price falls?
AUM equals shares outstanding times NAV. If new creations add enough shares, AUM can expand even as NAV slips. That’s common when products are still being adopted by advisors, platforms, or DCA programs.
Do leveraged SOL ETFs buy spot SOL?
Often they use derivatives (swaps, futures) plus cash collateral to target daily multiples. Their inflows don’t map 1:1 to spot buying, and performance can diverge due to fees, funding, and compounding.
How should I read daily inflow headlines?
Look for context: changes in shares outstanding, premiums/discounts, and whether the product is spot or leveraged. Cross-check with funding rates, open interest, and price action to gauge how much demand reaches spot markets.
What did June’s data show for Solana ETFs?
June snapshots showed AUM around $861M and cumulative inflows near $1.127B across U.S. spot SOL ETFs mid-month, alongside days with fresh inflows (e.g., FSOL on June 15), even as SOL dipped below $65 on June 10 (TokenPost; Invezz).
Could rising ETF assets be a bullish leading signal?
It can be constructive for adoption and liquidity, but it’s not a timing tool. Price is driven by marginal buyers and sellers; ETFs are one of many demand channels. Treat flow data as a piece of the mosaic, not a trigger.
What practical steps help avoid flow-driven mistakes?
Confirm whether inflows are spot or leveraged, check NAV premiums/discounts, watch funding and basis, and avoid extrapolating one day’s data. Manage risk with position sizing and an awareness of compounding in leveraged products.
Disclaimer: This article is provided for informational purposes only. It is not offered or intended to be used as legal, tax, investment, financial, or other advice.

Related Stories