Polkadot Price Analysis: DOT Surges Past $7.50. Could $8 Be Next?

The Polkadot (DOT) price witnessed a massive surge on Monday that saw the cryptocurrency break past its previous swing high. The surge also helped DOT break out of a multi-month descending trendline.
Polkadot (DOT) is now fast approaching the upper limit of its consolidation range and could potentially surpass it in upcoming sessions.
Polkadot (DOT) Surges Past $7.50
The Polkadot price registered a substantial increase during the week, with DOT surging past $7 and $7.50. The bullish trend results from a significant shift in the behavior of DOT holders as they pour money into the asset. DOT had moved past the 20-day SMA on Thursday after a relatively volatile session. Friday saw DOT continue its upward trajectory, with the asset settling at $7.20. However, DOT encountered strong resistance at this level and registered a drop of 0.56% and 3.21% on Saturday and Sunday, respectively. With the 20-day SMA acting as support, DOT was able to end the weekend at $6.93.
The current week brought a renewed spike in demand after a relatively prolonged period of sideways consolidation, pushing DOT higher. As a result of the spike in demand, DOT registered an increase of 9.38% on Monday, allowing it to break past several key resistance levels, the 20,50, and 200-day SMAs, and break out of a descending trendline that had prevailed for months. DOT registered a high of $7.60 on Monday before settling at $7.58. Tuesday saw a highly volatile session, with buyers and sellers vying for control. As a result, DOT dropped to a low of $7.43 before recovering and settling at $7.62, an increase of 0.52%.
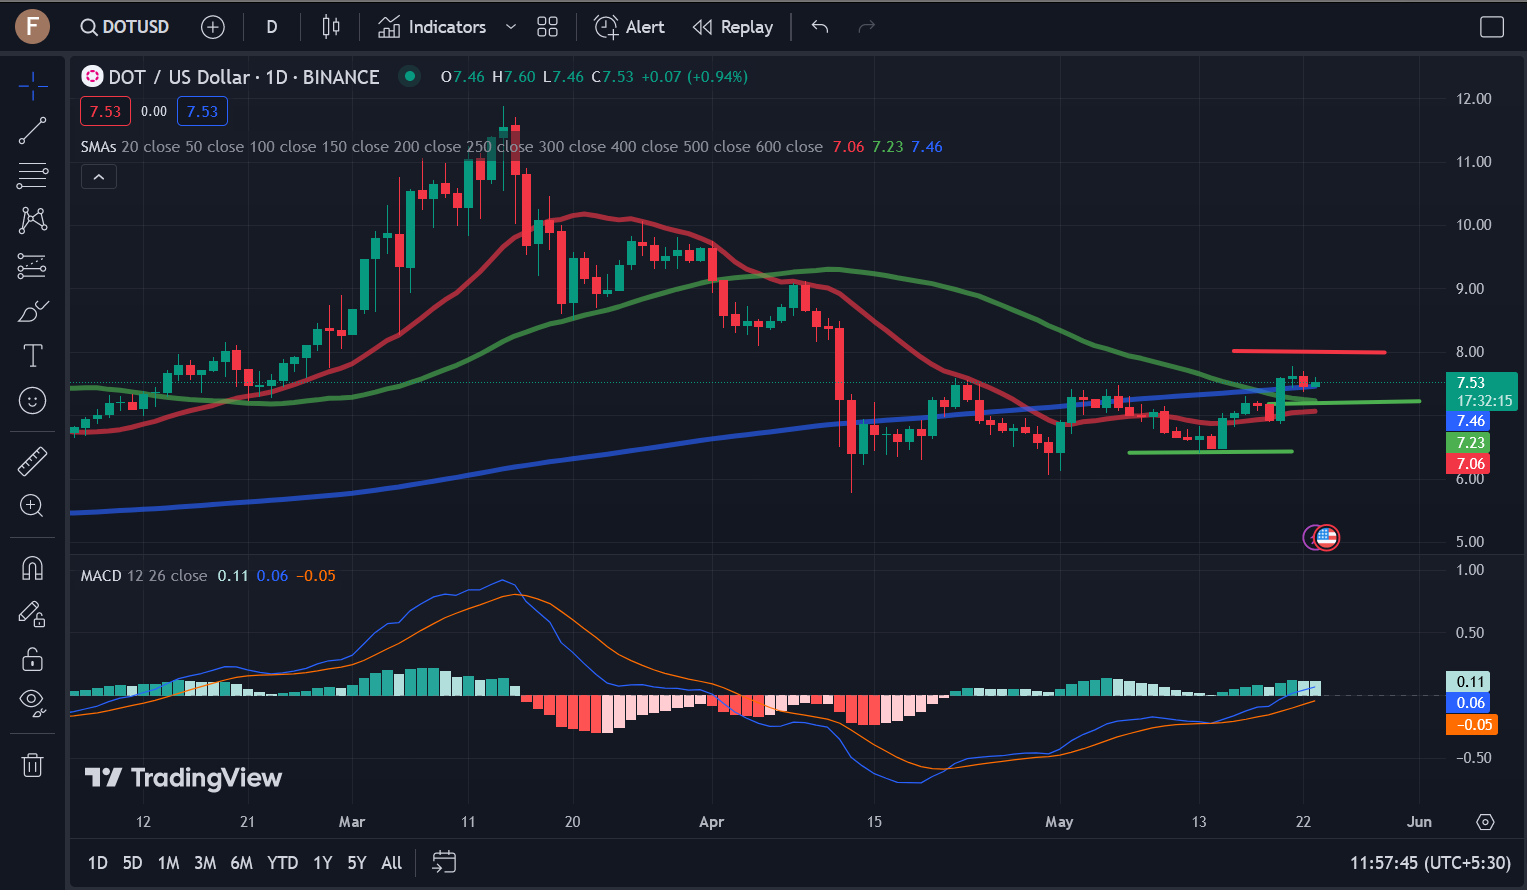
Wednesday saw sellers push DOT down by 2.10% to $7.46. However, the price has recovered in the current session and is currently up by 0.80%. As can be seen in the DOT price chart, DOT has strong support at the $6.40 level. The price increase on Monday allowed DOT to surge past several crucial levels and the 20, 50, and 200-day SMAs. DOT is now consolidating above the $7.40 level, with support building at the 200-day SMA.
Where Does Polkadot (DOT) Go From Here
Polkadot (DOT) is trading at $7.55 as buyers look to tighten their grip during the current session. The cryptocurrency now faces resistance at $8. If DOT breaks above this level, it could start a sustained bullish trend that could see the price rally to the $8.50 zone, where it would face its next level of resistance. However, should the sentiment return to bearish, DOT could drop to $7.40, where it has its first key support. Sustained bearish pressure could see DOT drop to $7, and the 20-day SMA could act as support. Any more losses could see the cryptocurrency back below $7.
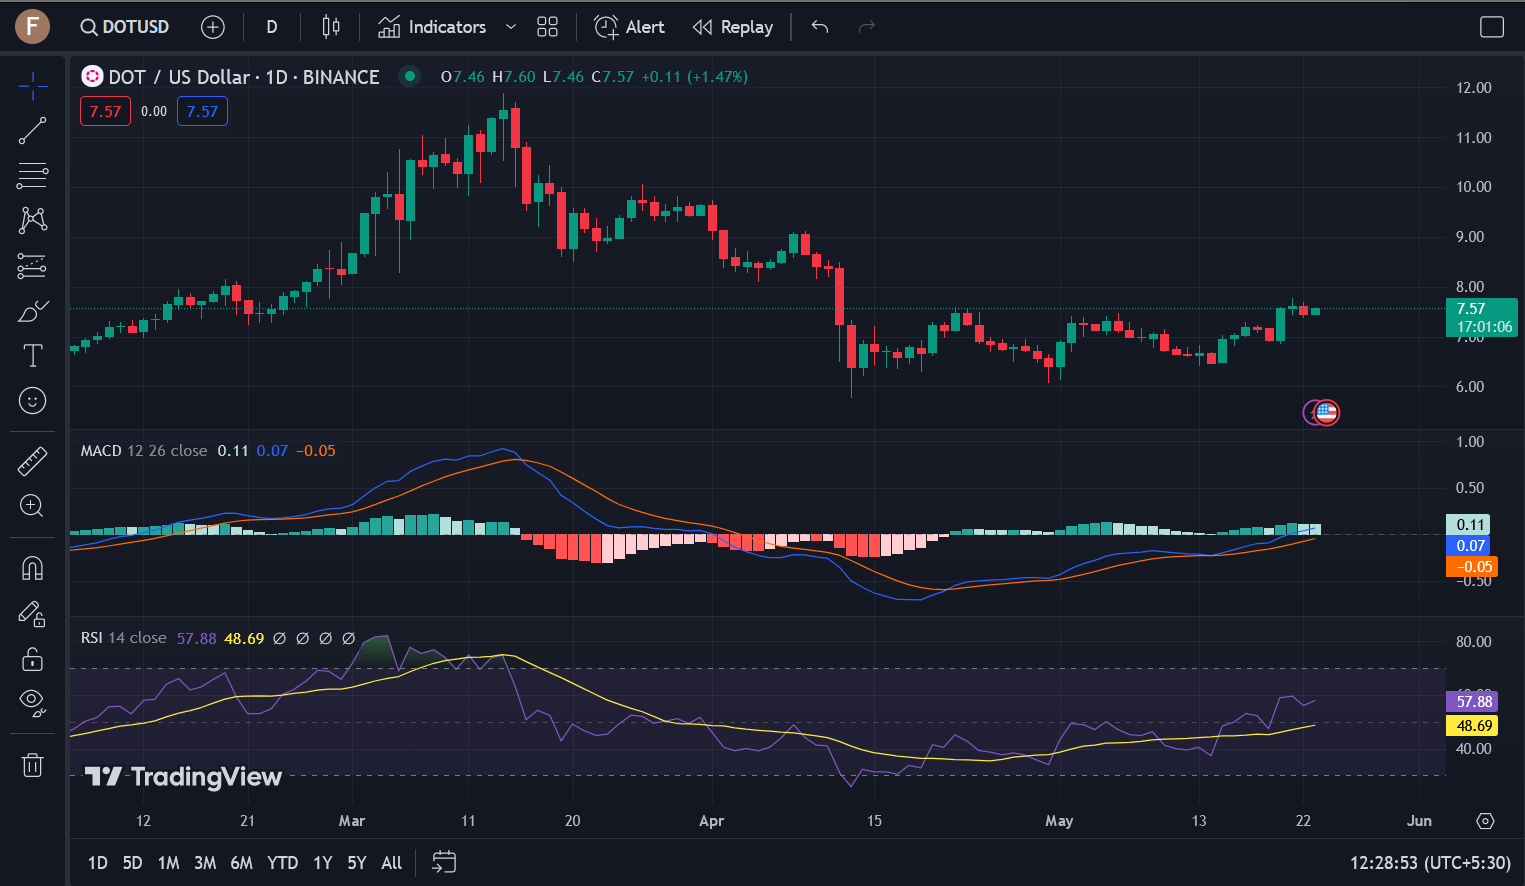
However, technical indicators point to growing bullish momentum. The MACD is currently in bullish territory, as evident in the price chart. The RSI is also in neutral territory, indicating DOT has plenty of room for sustained upward momentum.
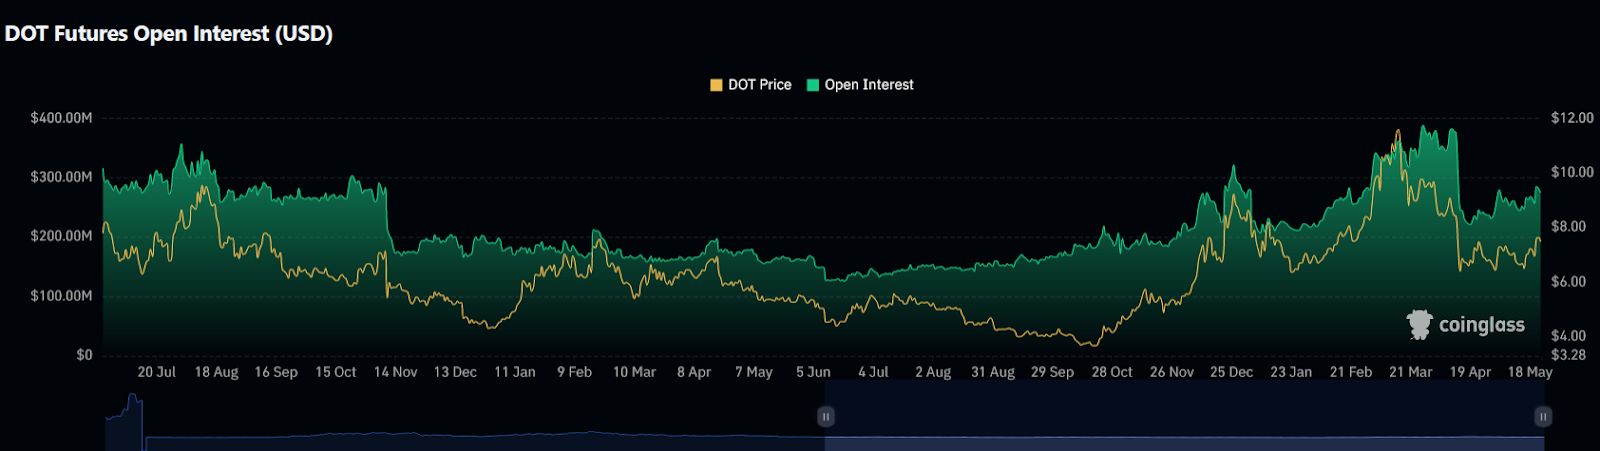
Polkadot (DOT) Open Interest Rises
Open Interest OI) is the total number of active derivative contracts, such as options or futures, that are yet to be settled. DOT’s Open Interest chart shows that OI has risen to $291 million, up from $250 million in just under a week. This positive funding rate indicates that long contracts are more in number than short contracts.
Disclaimer: This article is provided for informational purposes only. It is not offered or intended to be used as legal, tax, investment, financial, or other advice.

Related Stories