Polkadot Price Analysis: DOT In The Red As Crucial Support Cracks

The Polkadot DOT) price is back in the red as it slipped below the crucial $7 level and the 20-day SMA, as bearish sentiment returned on Friday.
DOT is currently trading at $6.74, but the price has not seen any significant movement so far, as trading remains muted.
Polkadot (DOT) Back In The Red
The Polkadot (DOT) price registered a sharp drop on Friday, deflating expectations as it slipped below a crucial support level at $7. The DOT price had been relatively static since May 2, when it registered an increase of 5.51% to go above $7 and the 200-day SMA. However, by May 4, the price was back in the red, dropping below the 200-day SMA but crucially staying above $7 at $7.13. DOT registered an increase of 2.52% on May 5 but was back in the red on the 6th, dropping by 2.46% and settling at $7.13.
DOT’s downward trajectory continued on Tuesday (7th) and Wednesday (8th), with the price falling to $6.98. However, the 20-day SMA was acting as support at this level, and DOT recovered on Thursday (9th), rising by 1% to $7.05. Investors were hopeful that DOT could build from $7, and buyers could take the price past the 200-day SMA to $7.50.
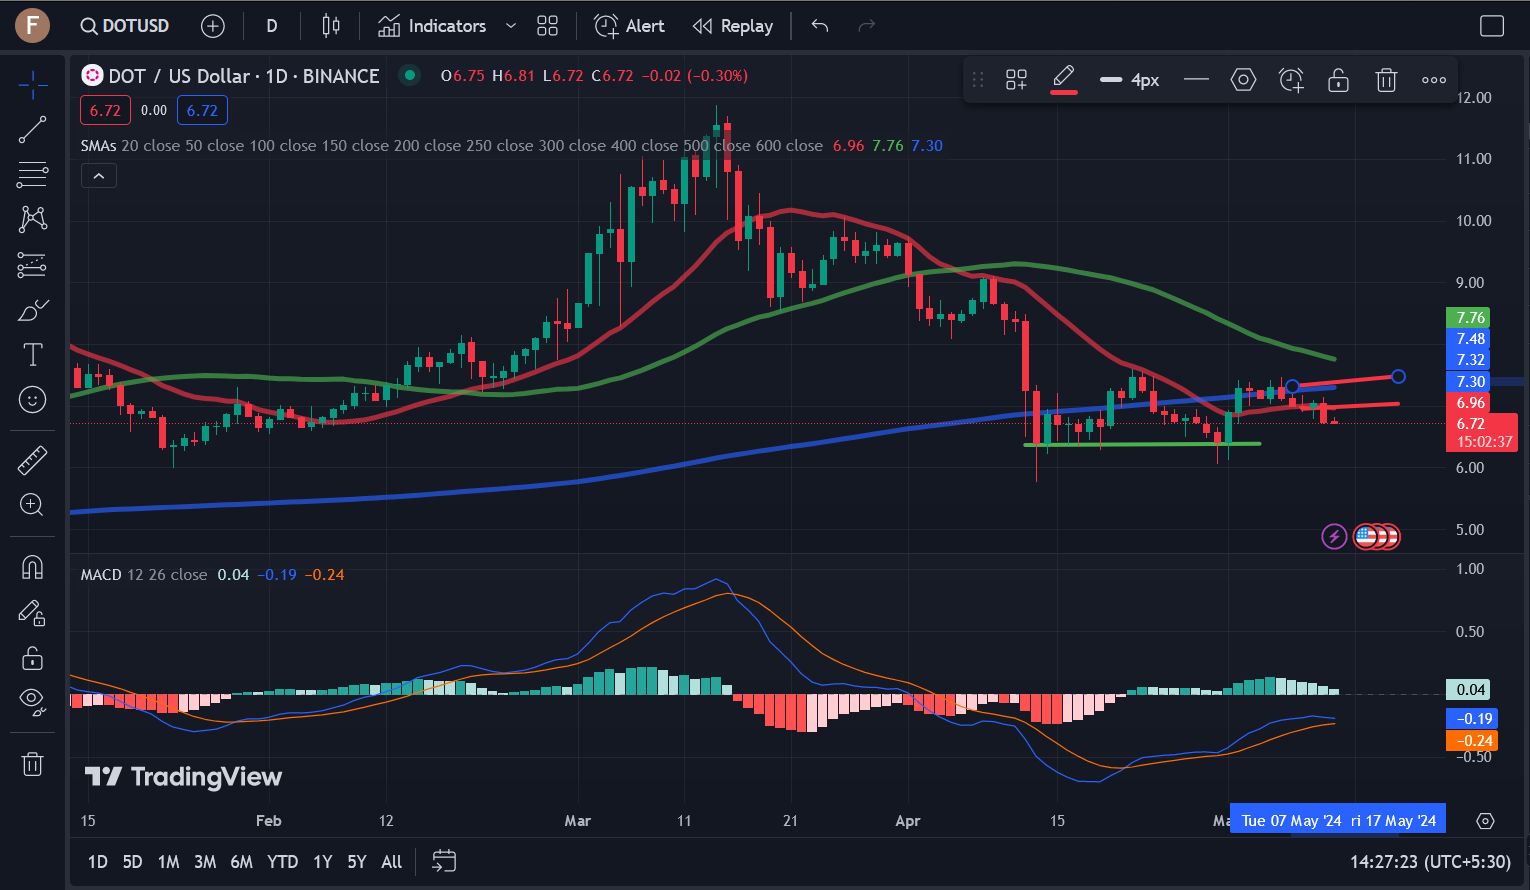
However, Friday (10th) saw bearish sentiment return to the markets, as the DOT price crashed by 4.40%, going below the 20-day SMA and the $7 price level, dropping to $6.74, as shown in the chart above. The current session sees sellers in control, with DOT trading at $6.72, 0.30% lower than yesterday. Should sellers continue to dominate the session, we could see DOT drop lower. Analysts were expecting a minor downtrend in the near term, targeting the $6.40 level. Bullish momentum had waned around the $7.4 mark, indicating a balance between buyers and sellers.
Where Does Polkadot (DOT) Go From Here?
As depicted in the chart below, DOT has been oscillating between the 20-day SMA and the 200-day SMA for the majority of the past week. Presently, sellers have managed to push the DOT price below its support level at $7. However, there is still hope for DOT. It retains a robust support level at $6.40. If sellers persist, DOT could drop to this support level. From there, we could witness a potential recovery and a rebound towards $7. The MACD and the Parabolic SAR are both currently bullish, indicating a possible recovery for DOT in the short term.
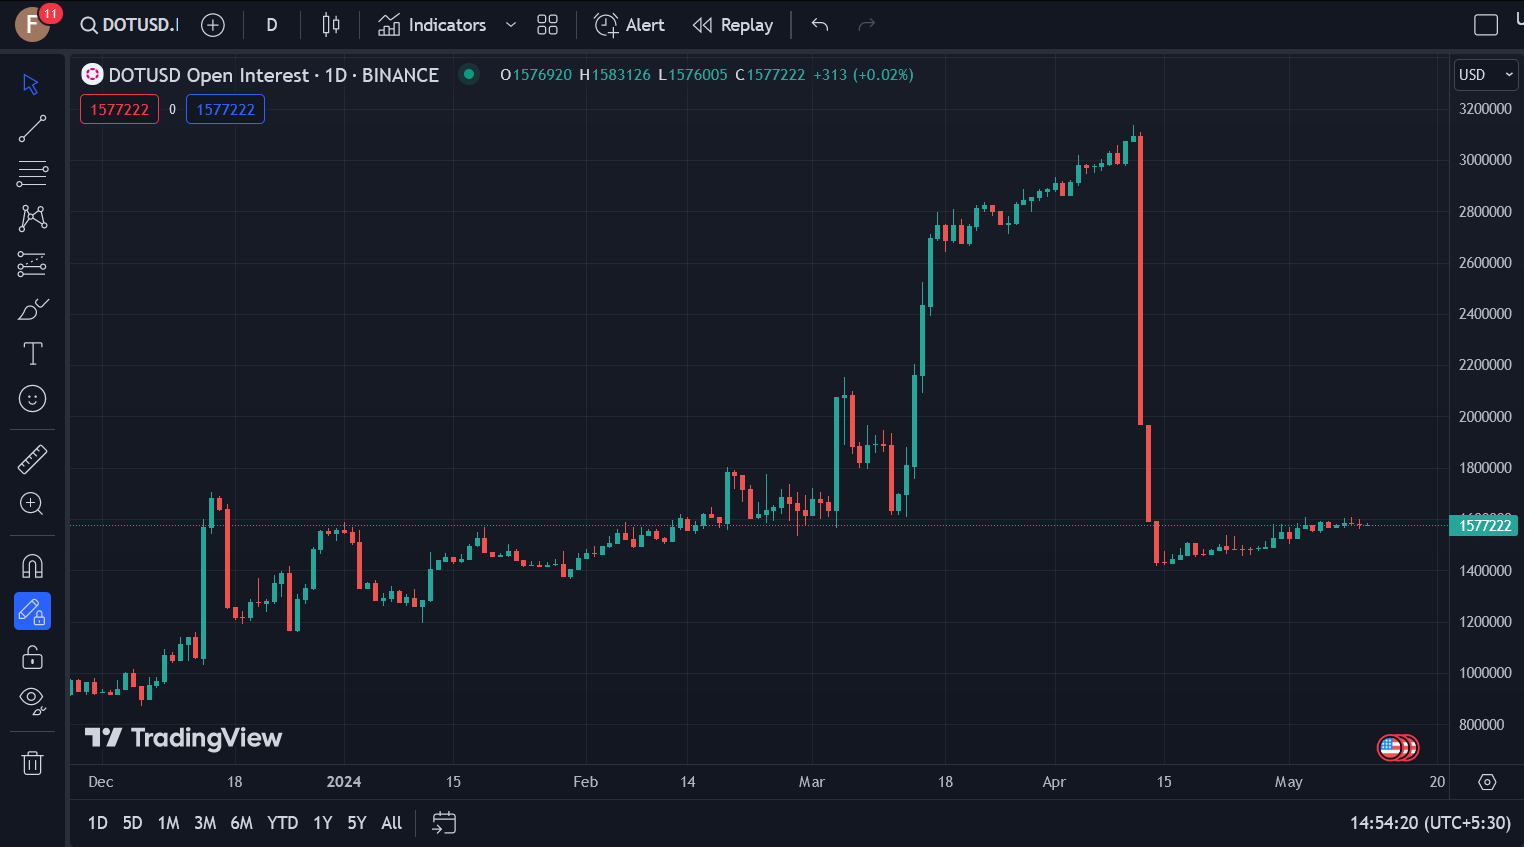
With the recent uncertainty around Polkadot’s (DOT) price, a look at the futures market sentiment could give a clue regarding future prospects. Following its recent decline and sideways consolidation, Open Interest and Funding rates have registered a considerable decline. A similar pattern was observed at the beginning of the year, resulting in heightened demand and the beginning of a strong bullish phase.
Disclaimer: This article is provided for informational purposes only. It is not offered or intended to be used as legal, tax, investment, financial, or other advice.

Related Stories