Bitcoin (BTC) bounce needs to continue

Bitcoin is currently bouncing after suffering Tuesday’s 8.4% reversal. Momentum indicators have reset, and now it’s just a case of $BTC getting back above the resistance at $69,000. If $BTC isn’t successful, and a lower high is made, the present correction could continue, and take the king of the cryptocurrencies even lower.
A much needed green day
After Tuesday’s dump, many retail investors might have been on shredded nerves, and possibly on the verge of selling, if they hadn’t already done so. If new to the crypto market, witnessing such a strong down day would have been a test for anyone’s resolve.
That said, if traders made it till Wednesday without selling, they can now enjoy some green price action.
Bounce comes in
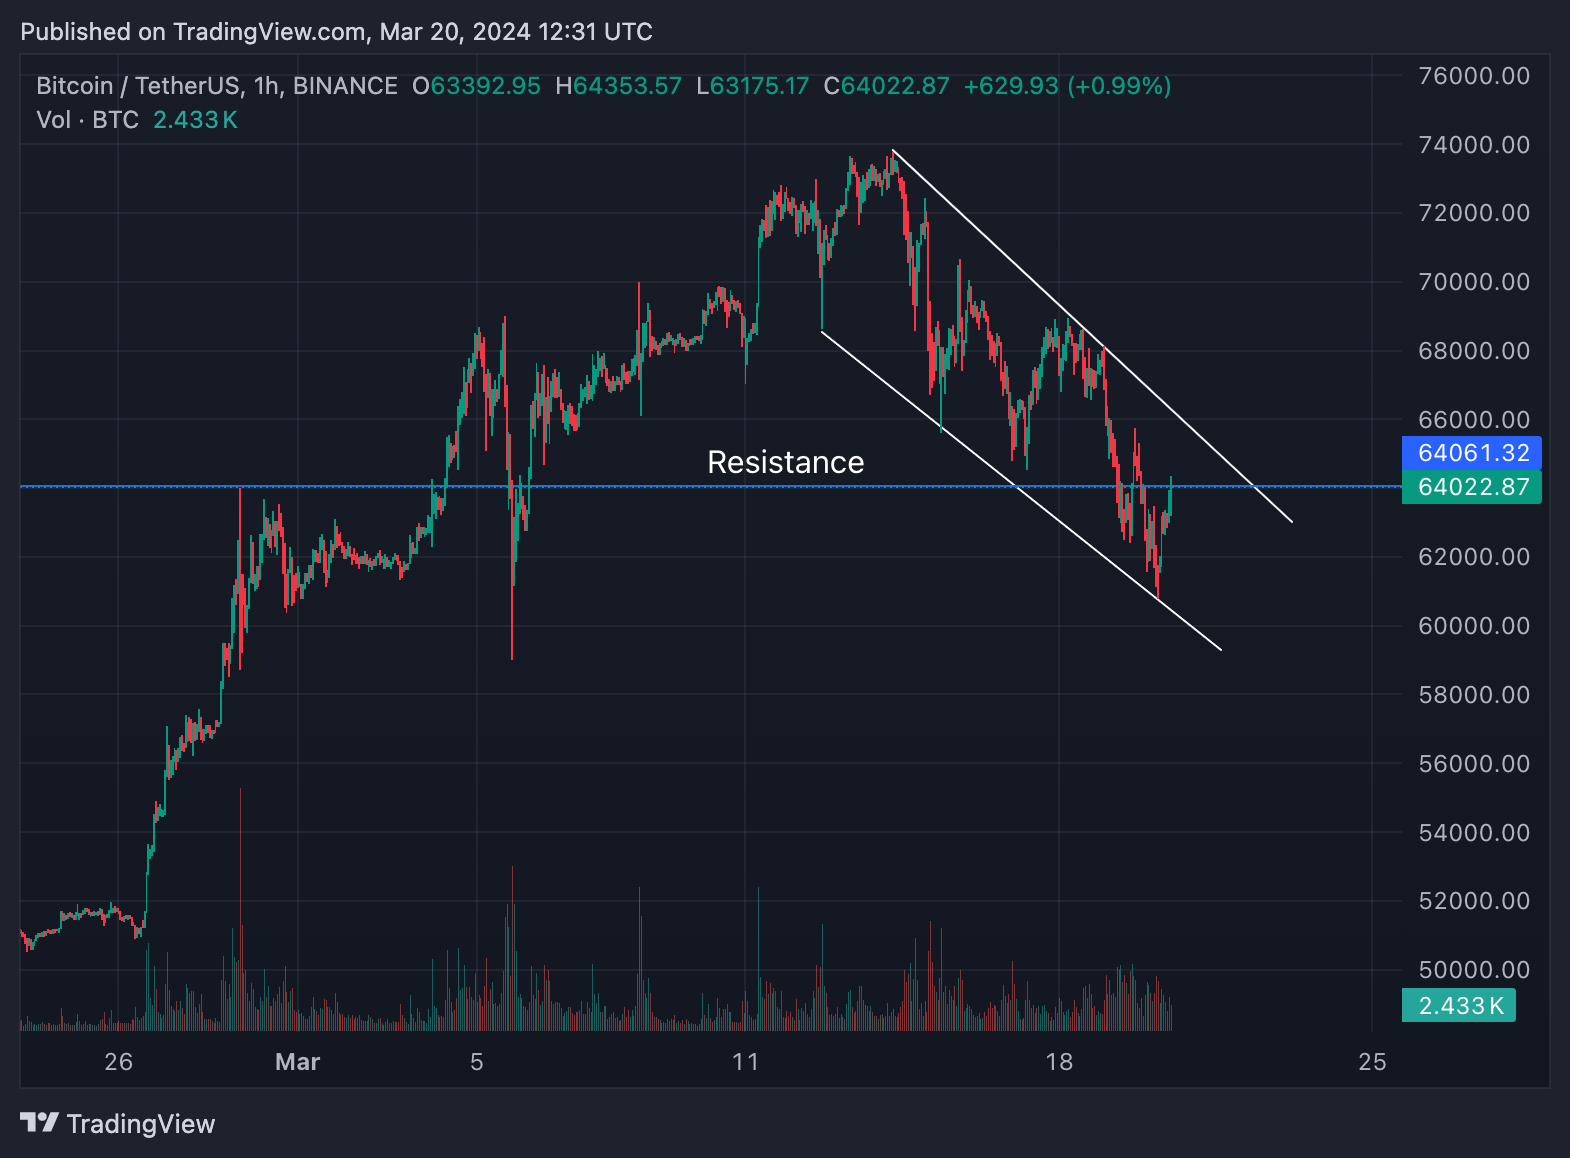
Source: Coingecko/Trading View
In the short term price chart above, it can be seen that $BTC traversed down inside the wedge pattern. Happily, the bottom trend line of the wedge coincided with good support, and the expected bounce did indeed happen.
With all the stochastic RSI momentum indicators having reset for the short to medium term, up as far as the daily, the $BTC price may have the chance to get itself back above what has now become resistance at $69,000.
A tall order
Be that as it may, this could in fact be quite a tall order for $BTC, given that we are halfway through the week, and this would need to take place by the end of play on Sunday. Another weekly close below $69,000 could set the seal on a confirmed rejection and a continuance of the downtrend to much lower levels.
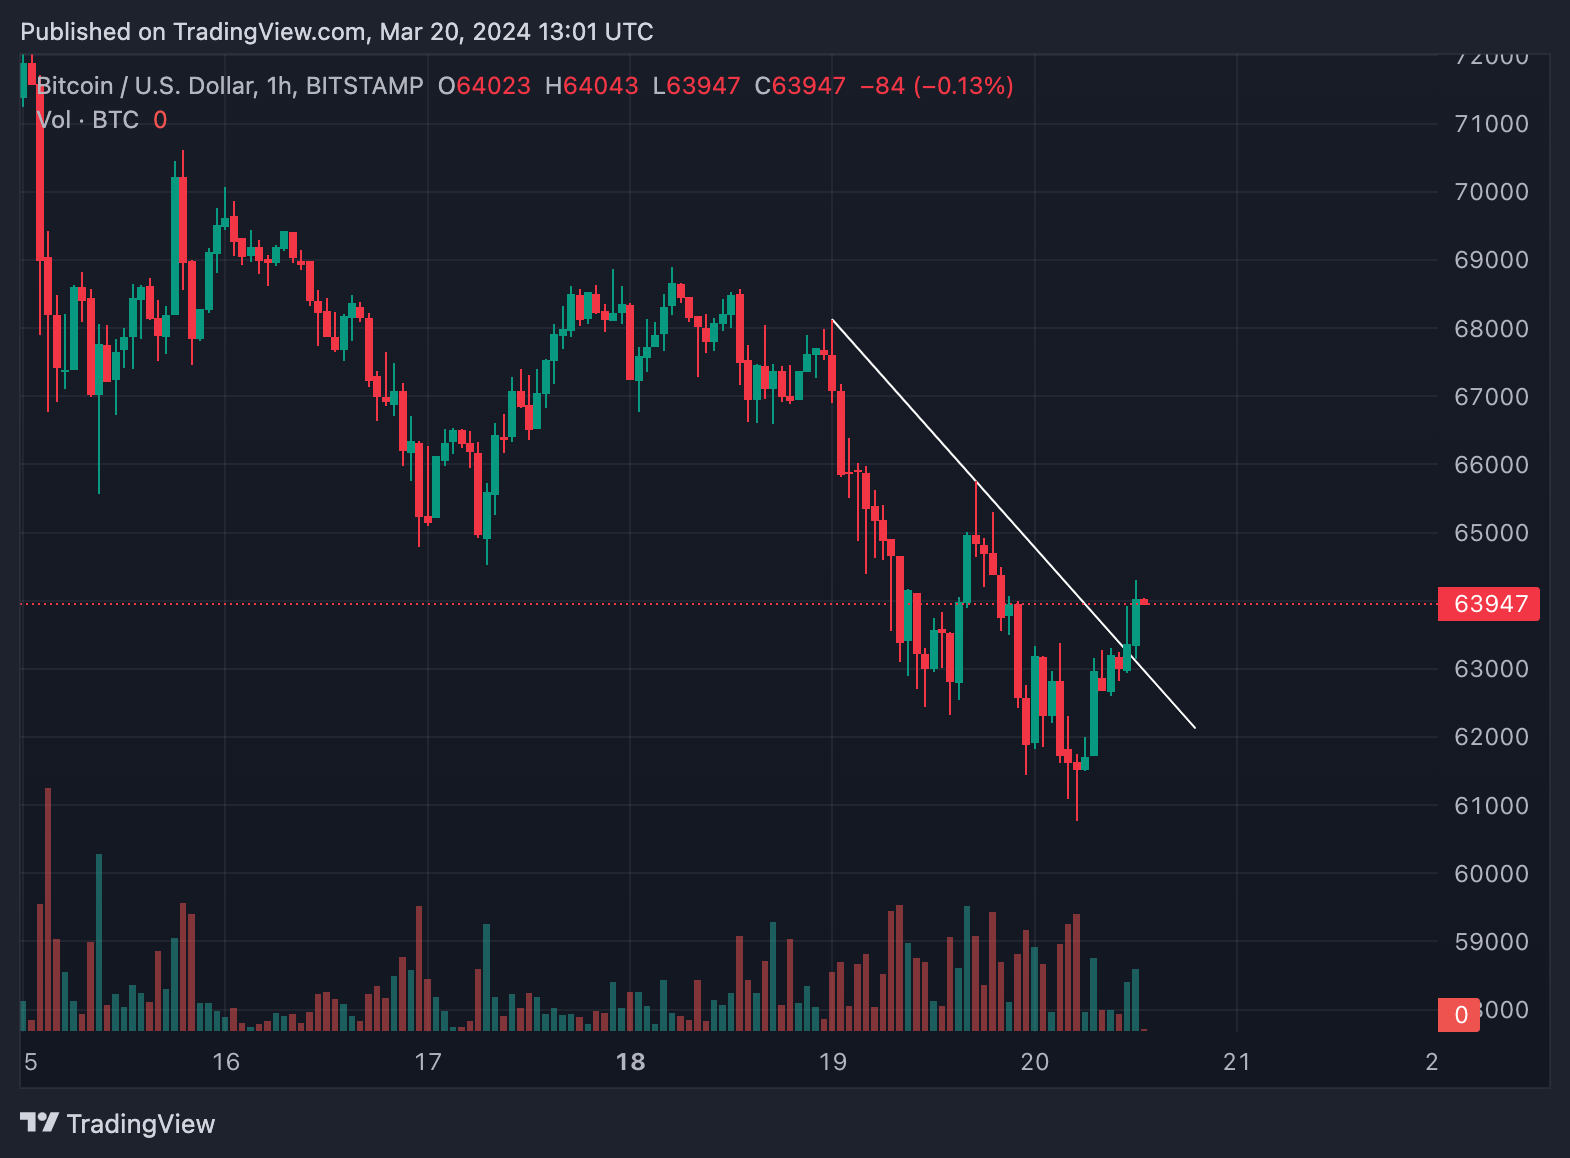
Source: Coingecko/Trading View
In the very short 1-hour time frame, a breakout of the W pattern has occurred, and this is a bullish outcome for $BTC. A measured move for the breakout of this pattern would take the price to $67,000 - a great first step on the way back to $69,000.
Monthly chart shows concerns
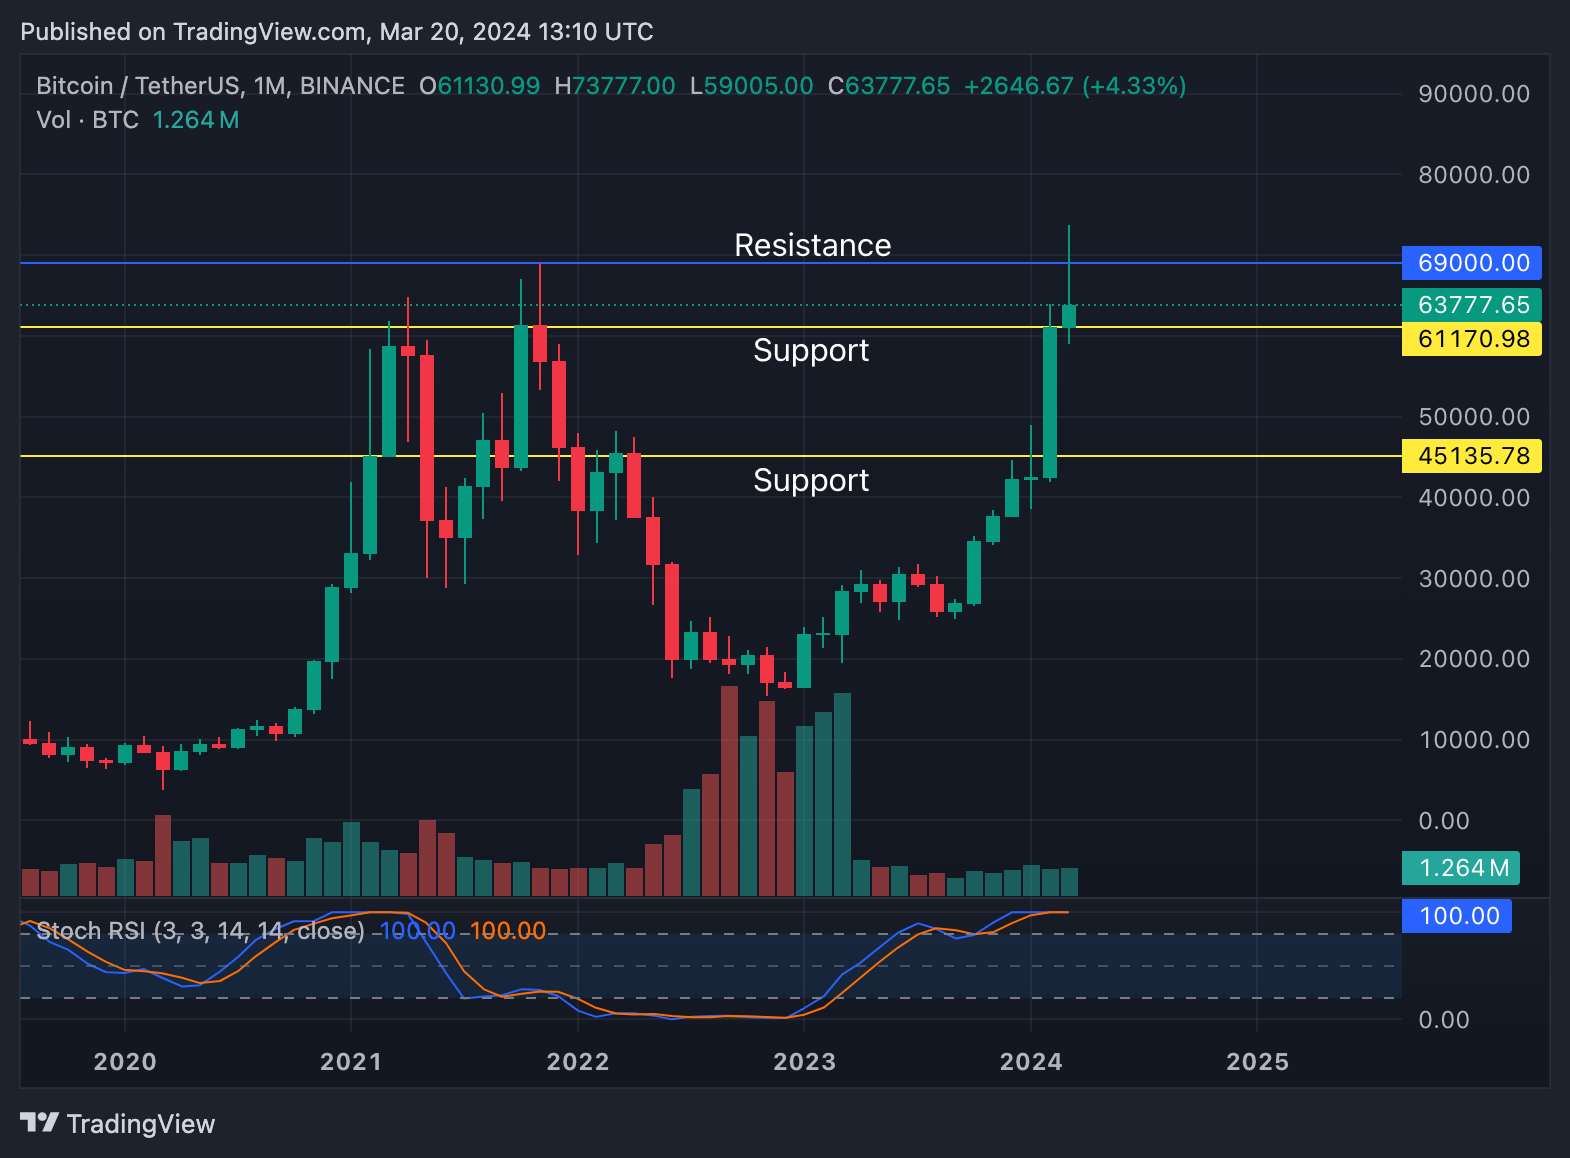
Source: Coingecko/Trading View
Going completely in the opposite direction, and zooming out into the monthly time frame, the picture becomes much cleaner and clearer. This gives an illustration of just how critical the $BTC situation is. Strong support is currently being held at $61,000.
However, the size of the wick above is cause for concern. Also, it can be noted that the monthly stochastic RSI indicator at the bottom of the chart is completely topped out. Going by previous times that this has been the case, a cross down, leading to downward price momentum, can’t be far away.
The next support that has the most touch points is down at $45,000. Should the reversal happen, this would be a nearly 40% correction, which as corrections go, would be a thoroughly respectable and healthy one - in line with previous bull markets.
Disclaimer: This article is provided for informational purposes only. It is not offered or intended to be used as legal, tax, investment, financial, or other advice.

Related Stories