Bitcoin (BTC) Price Analysis: Orbiting 42230 Technicals in Early 2024 – 2 January 2024
Bitcoin (BTC) Price Analysis: Orbiting 42230 Technicals in Early 2024 – 2 January 2024
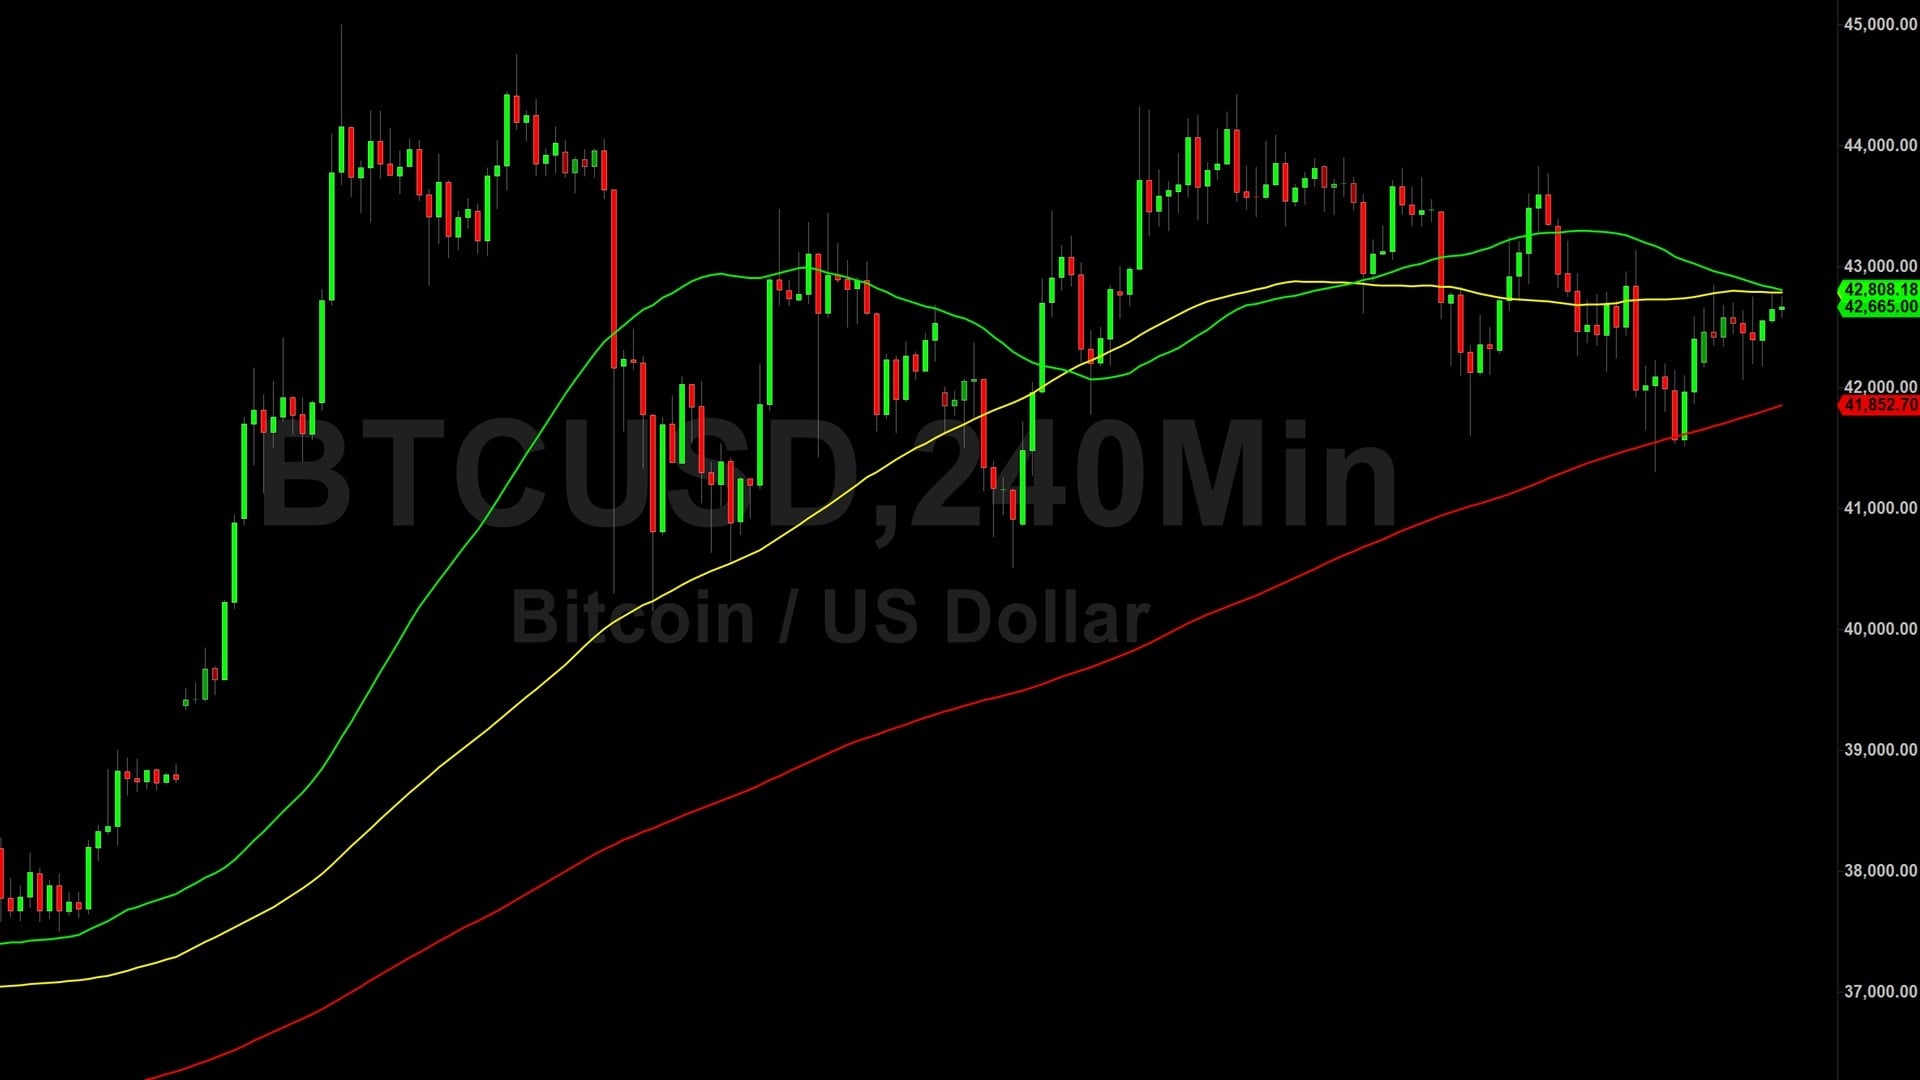
Bitcoin (BTC/USD) sought to extend recent gains early in the Asian session as the pair appreciated to the 42778.74 area following recent buying pressure around the 41300 area. After depreciating 64.4% in 2022, BTC/USD scored a 156.3% gain in 2023 that was solidified by a 11.3% gain in December and a 57.5% expansion in the fourth quarter. The recent relative high around the 45000 figure represented a test of the 45278.22 level, an upside price objective linked to historical upside advances around the 3858 area. Above the market, upside price objectives include the 46105, 46487, and 49161 levels, above which Stops are cited.
Below the market, downside risks persist with additional downside price objectives around the 40185 and 38773 areas. Downside price objectives related to recent selling pressure around the 43657 and 43207 levels include the 42358, 42052, and 41556 areas, while downside price objectives linked to the 43830 area include the 42375, 42032, 41607, and 40920 areas. Areas of technical support and potential buying pressure include the 38998, 38028, 37321, and 35285 levels. Traders are observing that the 50-bar MA (4-hourly) is bullishly indicating above the 100-bar MA (4-hourly) and above the 200-bar MA (4-hourly). Also, the 50-bar MA (hourly) is bearishly indicating below the 100-bar MA (hourly) and below the 200-bar MA (hourly).
Price activity is nearest the 100-bar MA (4-hourly) at 42783.93 and the 100-bar MA (Hourly) 42504.61.
Technical Support is expected around 37392.45/ 36720.55/ 35633.00 with Stops expected below.
Technical Resistance is expected around 46487.10/ 47108.16/ 48240.00 with Stops expected above.
On 4-Hourly chart, SlowK is Bullishly above SlowD while MACD is Bullishly above MACDAverage.
On 60-minute chart, SlowK is Bearishly below SlowD while MACD is Bullishly above MACDAverage.
Sally Ho’s Technical Analysis
View Yesterday’s Trading Analysis
Disclaimer: Sally Ho’s Technical Analysis is provided by a third party, and for informational purposes only. It does not reflect the views of Crypto Daily, nor is it intended to be used as legal, tax, investment, or financial advice.

Related Stories