Bitcoin (BTC) Price Analysis: Depreciation Below 41294 Technicals – 19 December 2023
Bitcoin (BTC) Price Analysis: Depreciation Below 41294 Technicals – 19 December 2023
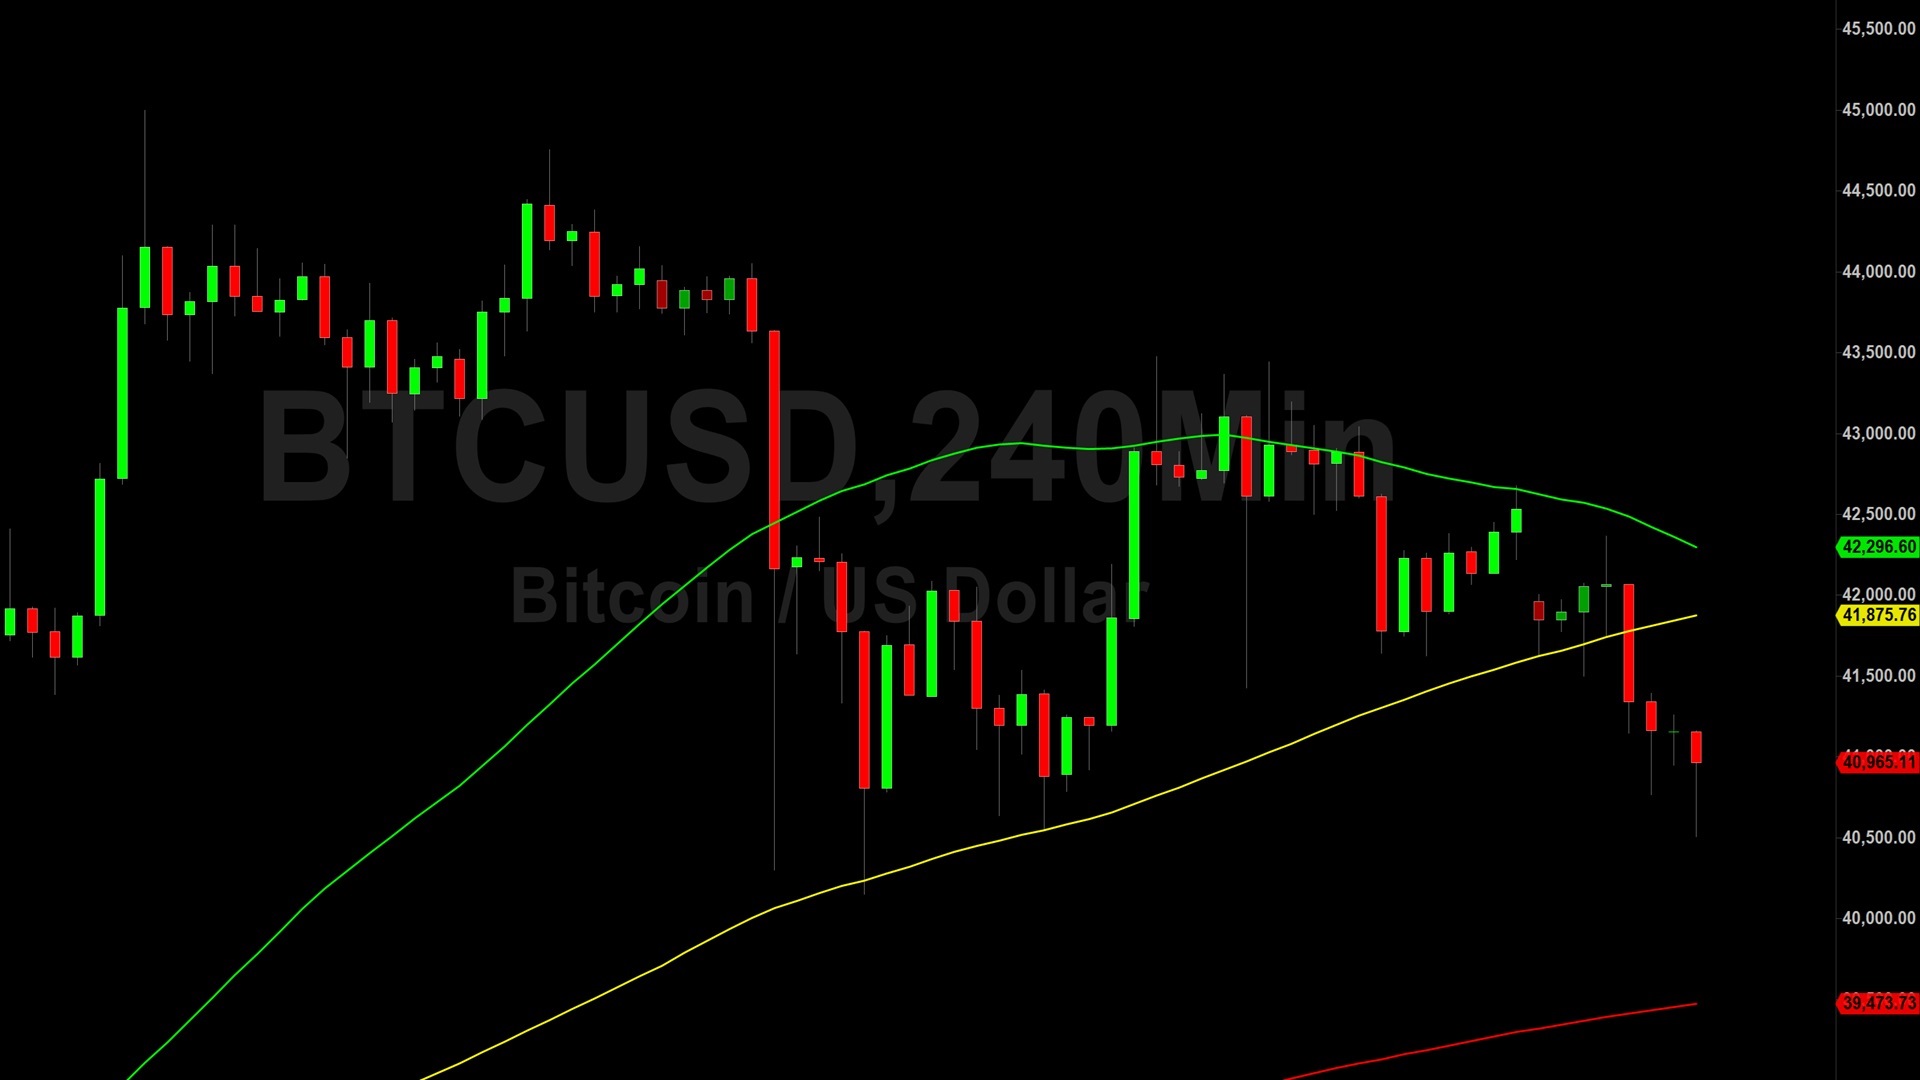
Bitcoin (BTC/USD) continued to pare recent gains early in the Asian session as the pair collapsed to the 40508.01 area following renewed selling pressure around the 42367.82 area. Stops were elected below the 40619.57 area during the depreciation, a previous upside price objective related to buying pressure around the 35633 and 37029 levels. Short-term downside risks persist with additional downside price objectives around the 40185 and 38773 areas. The recent multi-month high around the 45000 figure represented a test of the 45278.22 level, an upside price objective linked to historical upside advances around the 3858 area. Above the market, upside price objectives include the 46105, 46487, and 49161 levels, above which Stops are cited.
The recent profit-taking pullback represented a test of the 40256 area and Stops were elected below the 41458.35 level, a downside price objective related to recent selling pressure around the 44754 and 44049 areas. Additional Stops were also triggered below some significant technical levels during the depreciation including the 43044, 42583, 42159, 41835, 41087, 40619, and 40413 areas. Areas of technical support and potential buying pressure include the 38998, 38028, 37321, and 35285 levels. Traders are observing that the 50-bar MA (4-hourly) is bullishly indicating above the 100-bar MA (4-hourly) and above the 200-bar MA (4-hourly). Also, the 50-bar MA (hourly) is bearishly indicating below the 100-bar MA (hourly) and below the 200-bar MA (hourly).
Price activity is nearest the 50-bar MA (4-hourly) at 40405.23 and the 100-bar MA (Hourly) 41875.67.
Technical Support is expected around 37392.45/ 36720.55/ 35633.00 with Stops expected below.
Technical Resistance is expected around 46487.10/ 47108.16/ 48240.00 with Stops expected above.
On 4-Hourly chart, SlowK is Bullishly above SlowD while MACD is Bearishly below MACDAverage.
On 60-minute chart, SlowK is Bullishly above SlowD while MACD is Bearishly below MACDAverage.
Sally Ho’s Technical Analysis
View Yesterday’s Trading Analysis
Disclaimer: Sally Ho’s Technical Analysis is provided by a third party, and for informational purposes only. It does not reflect the views of Crypto Daily, nor is it intended to be used as legal, tax, investment, or financial advice.

Related Stories