Bitcoin (BTC) Price Analysis: Bulls Gunning for Stops Above 38066 – 13 November 2023
Bitcoin (BTC) Price Analysis: Bulls Gunning for Stops Above 38066 – 13 November 2023
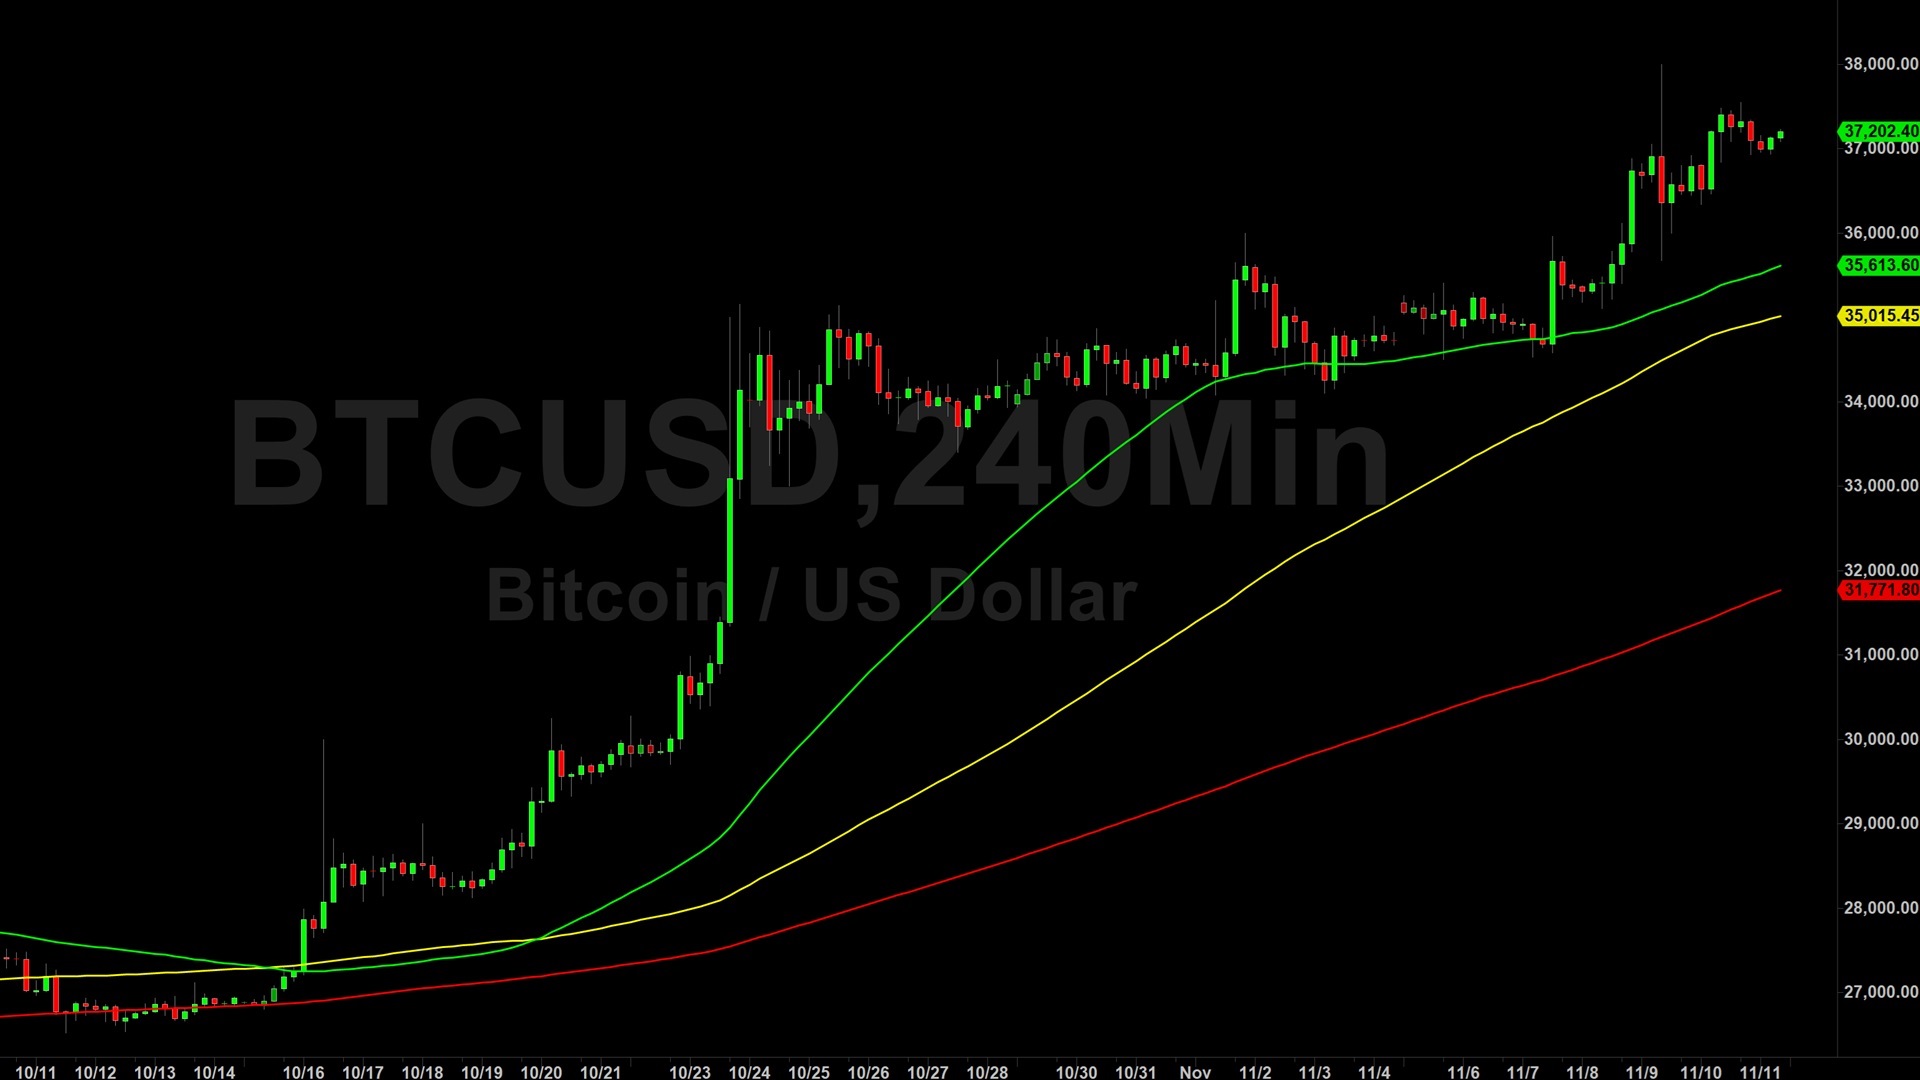
Bitcoin (BTC/USD) maintained strong positive momentum early in the Asian session as the pair continued to trade within striking distance of its eighteen-month high around the 37999 level. Stops were recently elected above the 37165.61 area during the appreciation, an upside price objective related to buying pressure around the 15460 and 24750 levels. Significant Stops were also elected above the 34965.04 and 37516.08 levels during the recent appreciation to BTC/USD’s strongest print since May 2022, upside price objectives associated with buying activity around the 19568.52, 15460, and 24900 levels. Additional upside price objectives in these appreciating ranges include the 38602, 42721, and 44481 areas. Following the ongoing appreciation, areas of technical support and potential buying pressure include the 34757, 33499, 32873, 32561, 31351, and 30837 levels.
Large Stops were also recently elected above the 35912.28 area, representing the 38.2% retracement of the depreciating range from the all-time high of 69000 to 15460. Additionally, major Stops were triggered above the 37362.84 area during the steep climb to eighteen-month highs, an upside price objective related to historical buying pressure around the 3858 and 15460 levels. Traders are observing that the 50-bar MA (4-hourly) is bullishly indicating above the 100-bar MA (4-hourly) and above the 200-bar MA (4-hourly). Also, the 50-bar MA (hourly) is bullishly indicating above the 100-bar MA (hourly) and above the 200-bar MA (hourly).
Price activity is nearest the 50-bar MA (4-hourly) at 35682.23 and the 50-bar MA (Hourly) at 36992.71.
Technical Support is expected around 31238.97/ 30028.62/ 28818.26 with Stops expected below.
Technical Resistance is expected around 38584.16/ 39596.82/ 42721.31 with Stops expected above.
On 4-Hourly chart, SlowK is Bearishly below SlowD while MACD is Bearishly below MACDAverage.
On 60-minute chart, SlowK is Bullishly above SlowD while MACD is Bearishly below MACDAverage.
Sally Ho’s Technical Analysis
View Yesterday’s Trading Analysis
Disclaimer: Sally Ho’s Technical Analysis is provided by a third party, and for informational purposes only. It does not reflect the views of Crypto Daily, nor is it intended to be used as legal, tax, investment, or financial advice.

Related Stories