Analysts Predict When the Rollercoaster Is Over for Ripple (XRP), Chainlink (LINK), Polygon (MATIC), and Polkadot (DOT)

Crypto markets have always been a rollercoaster of emotions and opportunities. The big chatter right now revolves around the potential approval of Bitcoin spot ETFs. Imagine a world where Bitcoin's market cap is about to get a whopping boost of $155 billion. Crazy, right? With major financial institutions lining up to roll out spot Bitcoin ETFs, this is becoming a reality we might soon experience. The implications are tremendous – Bitcoin could potentially become a $900 billion asset. And for the entire crypto market? It might expand by an unprecedented $1 trillion. If the markets were a movie, we'd be reaching the climax soon.
This exciting ride started when institutions began adding Bitcoin to their balance sheets during 2020-2021. The next anticipated wave seems to be these institutions giving their clients Bitcoin access via these ETFs. All these analyses and predictions remind us of the frenzied days of 2021 when the crypto market crossed the $1 trillion mark for the first time. Fast forward to now, and Bitcoin alone has a 50% stake in a total market cap of $1.13 trillion.
Ripple (XRP) Technical Analysis and Price Forecast
For those who've been tracking, the Ripple (XRP) price prediction on StealthEX offers a captivating insight. Ripple's historical performance outlines key levels that serve as markers for its potential direction.
Ripple's performance over the past year has demonstrated a series of significant support and resistance levels that can provide insights into its potential future trajectory.
At the higher end, Ripple's 52-Week High is marked at $0.9223, and the 13-Week High is at $0.8517. Significant movements have been observed at the 9-18 Day Moving Average level of $0.6658 and the 9-40 Day Moving Average level of $0.6099. The 1-Month High stood at $0.5471, with resistance at the 40-Day Moving Average level of $0.5323.

On the flip side, XRP has established key support areas that have been tested multiple times. The initial support point is at $0.4829, followed by the level at $0.4774.
The bearish scenario would see XRP retest the mentioned immediate support level. Should this level fail to hold, it could decline further towards the 13-Week Low of $0.4596. A prolonged bearish phase could potentially drive it down to its 52-Week Low of $0.3166.
To sum up, the technical data provides two potential paths for XRP. Its future price movement will likely depend on broader market sentiment, adoption rates, and potential regulatory updates.
So, there's a bit of a tug of war happening here. And if you're thinking of playing the XRP game, make sure to exchange USDT to XRP on StealthEX. Almost any crypto you can imagine can be swapped on their platform in just one click without signing up or KYC.

Chainlink (LINK) Technical Analysis and Price Forecast
Chainlink has its unique story to tell in the crypto verse. Its decentralized oracles have been a game-changer. But what's the price saying?
From the bullish camp, there's noticeable enthusiasm as LINK approaches significant resistance levels. With momentum on its side, there's potential for LINK to challenge its 13-Week High of $8.4270. If this bullish fervor continues, LINK could even aim for the 52-Week High of $9.2130.
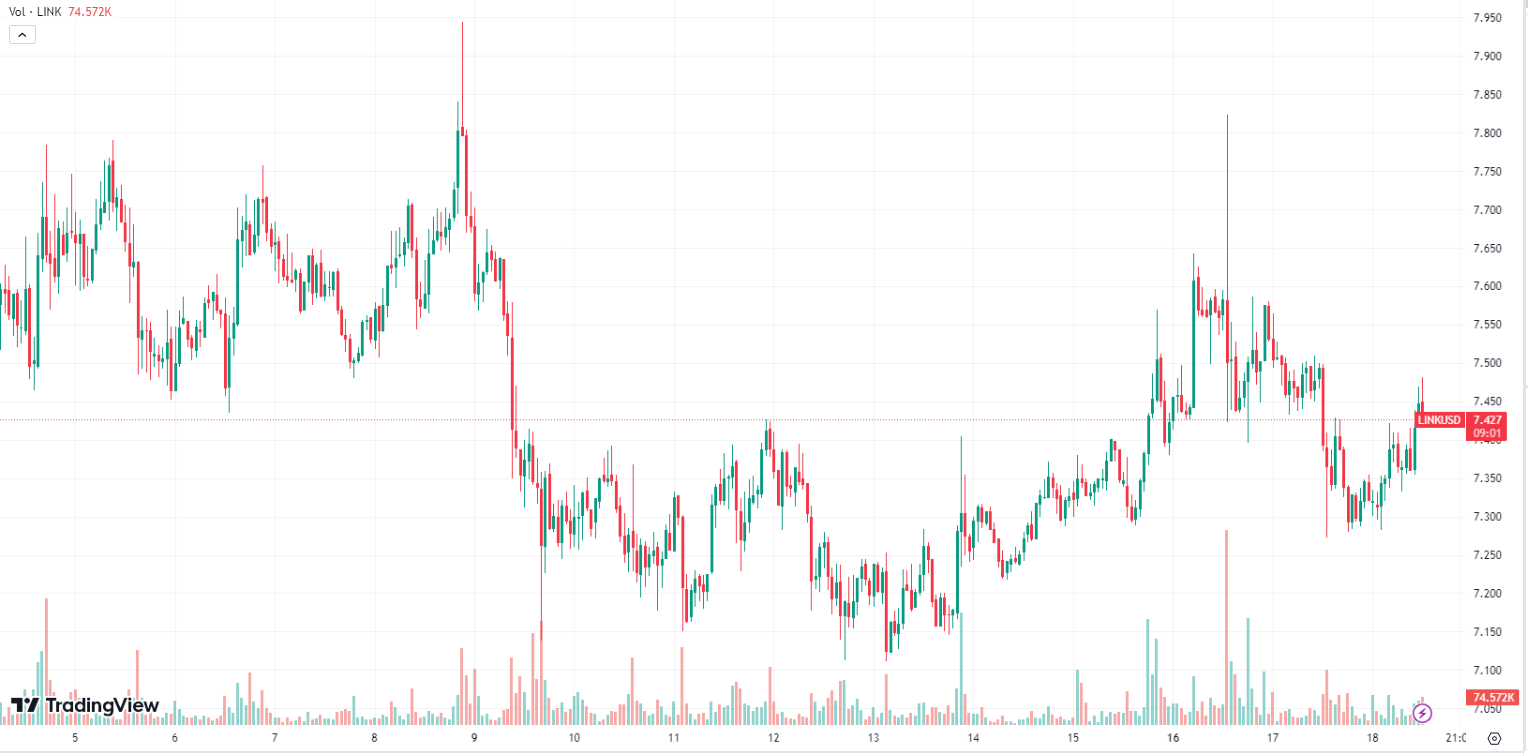
On the flip side, a bearish undertone can't be ignored. While the price has managed to hold above some levels, there are key support areas LINK might test if bearish sentiments persist. The primary support to watch is the support point at $7.0843. If this level doesn't hold, the next significant support is at $6.8907.
Dipping below these levels might signal a more prolonged bearish trend, potentially dragging LINK closer to the 1-Month Low of $6.5190 or even further.
LINK appears to be in the midst of a pivotal moment in its journey. Whether it scales new highs or tests its supports will hinge on overall market sentiment, adoption of decentralized oracles, and possibly broader crypto trends. For those considering getting aboard the LINK express, here's your chance to exchange USDT to LINK KYC-free.

Polygon (MATIC) Technical Analysis and Price Forecast
Polygon (MATIC), recognized for its scalability solutions, has generated significant buzz. But is its price trajectory mirroring its technological advancements?
A closer examination of MATIC's price movements suggests bullish undercurrents, given its trajectory above several day moving averages. Nevertheless, one can't ignore the challenges it faced, particularly stalling around the 40-day moving average.
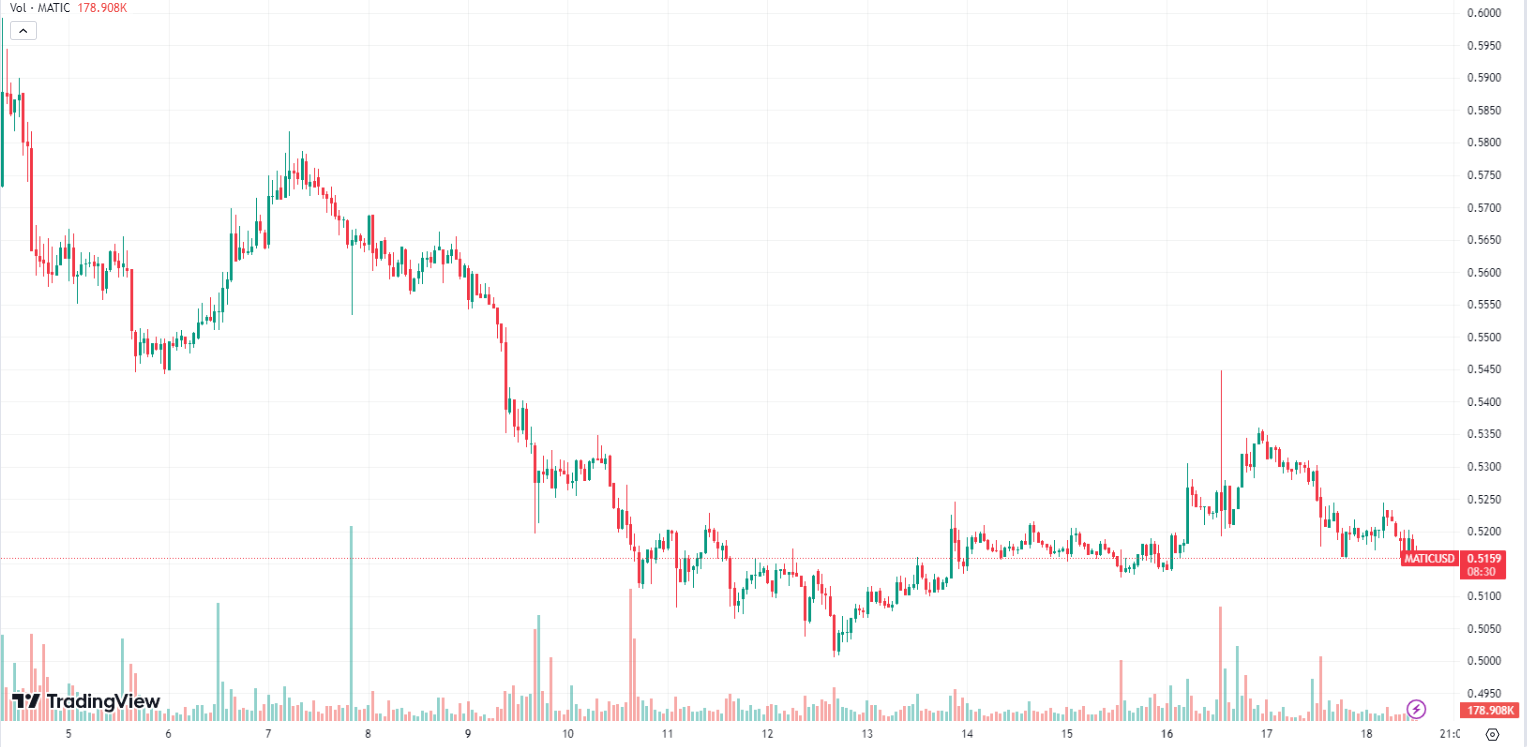
However, those on the cautious side would emphasize the coin's struggles, particularly as it neared the 52-week low of $0.49302. Additionally, looking at the support levels, MATIC's immediate support stands at $0.50368, with the next support level positioned at $0.49172. Should the price fall and challenge these points, it might serve as an indication of bearish momentum.
If Polygon piques your interest, don’t miss out on the opportunity to exchange USDT to MATIC at the best rates right now.

Polkadot (DOT) Technical Analysis and Price Forecast
Polkadot (DOT) has been experiencing quite the movement in the markets, and the technical analysis reveals some interesting patterns and levels that traders might want to keep an eye on.
From a resistance standpoint, the immediate resistance is pegged at the $3.86575 range, and the next significant resistance level stands at $3.91926. Given the current market conditions, should DOT maintain its bullish momentum, these are the key resistance levels it might challenge in the short-term.
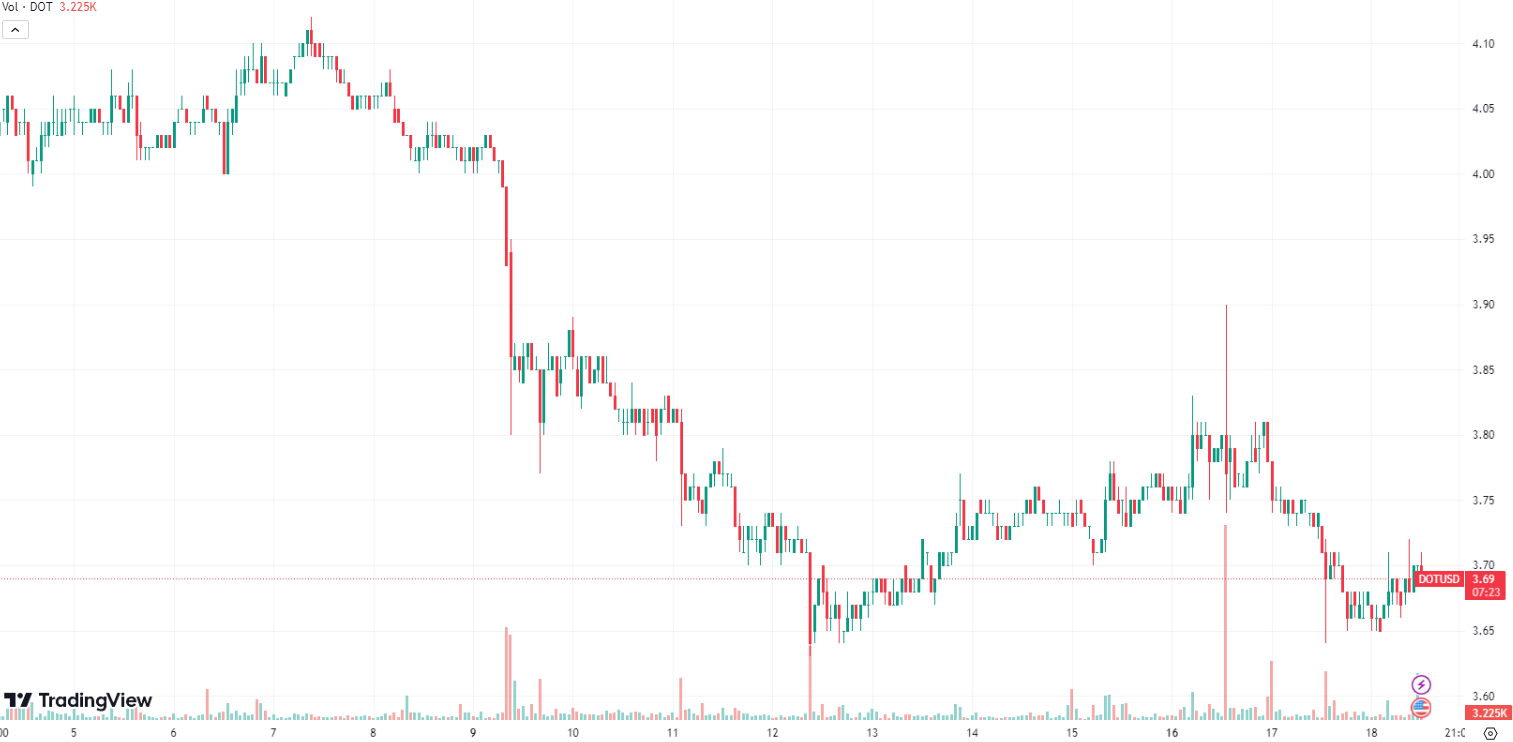
On the downside, the immediate support stands at $3.56763. This is an essential level to watch as it could serve as a potential floor should DOT experience any pullbacks. Further below, the next support level is at $3.47208. Breaching this could signal a more extended bearish trend, and DOT might see lower price levels.
While Polkadot’s price range suggests potential volatility, broader market conditions, developments within the Polkadot ecosystem, and overall cryptocurrency trends will play a significant role in its future trajectory.
In conclusion, whether you're an investor or a trader, the crypto market, and specifically coins like DOT, present various opportunities. Remember always to assess risks, stay updated with the latest news, and base your decisions on comprehensive research.
Don't miss out on the opportunity to take advantage of the potential gains in the Polkadot market – exchange USDT to DOT now!

Conclusion
The crypto market remains as unpredictable as ever. But with unpredictability comes opportunity. Whether you're a bull or a bear, the current market conditions promise a lot of action. As always, it's crucial to do your research, stay informed, and never invest more than you can afford to lose.
Disclaimer: This article is provided for informational purposes only. It is not offered or intended to be used as legal, tax, investment, financial, or other advice.

Related Stories