What The Massive Fall In Bitcoin (BTC) Shorts Means For The Price
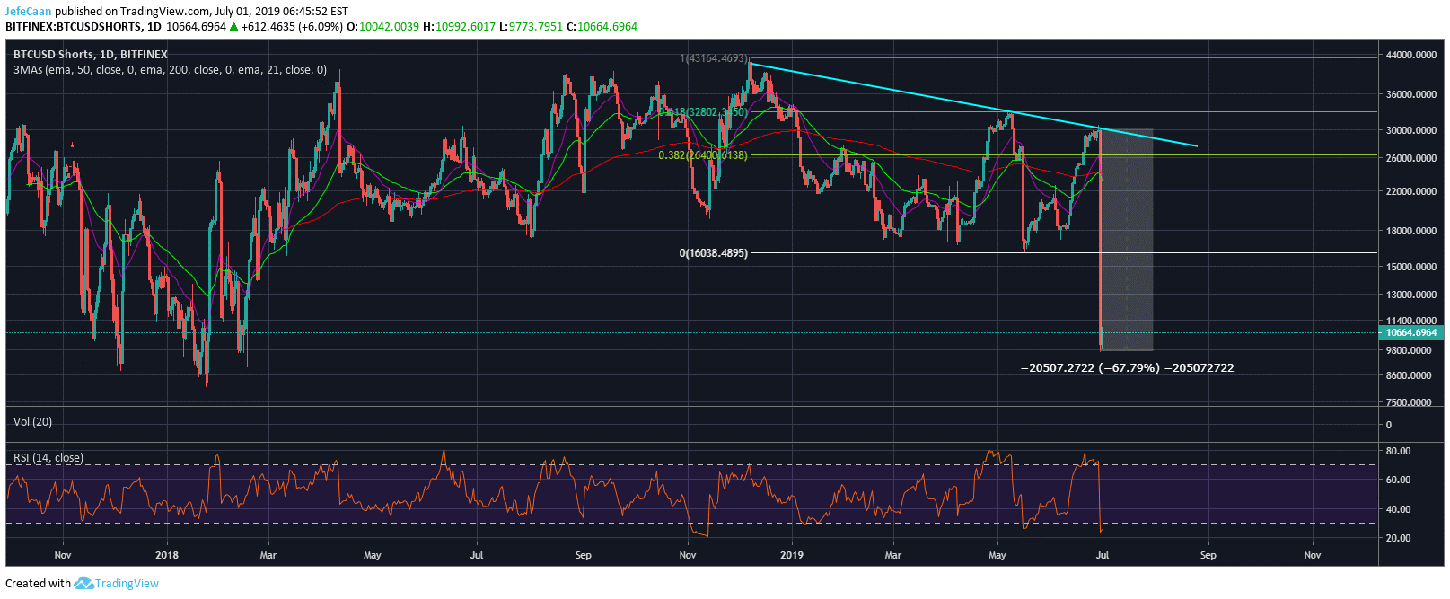
Bitcoin (BTC) price continues to show weakness yet the number of shorts fell by 20,000 BTC in one day yesterday. A lot of traders are wondering what this might mean for the price of Bitcoin (BTC) as it is clearly not a short squeeze. If it were a short squeeze, we would have seen a strong pump in the price of Bitcoin (BTC). Well, if we take a look at the daily chart for BTCUSDShorts, we cans see that this is the chart for the number of margined shorts on the Bitfinex exchange. Normally, if such shorts were to be covered, there would be buying and we would see a rise in the price of Bitcoin (BTC) but Bitfinex has a feature called “claiming”. This allows investors to trade their margined shorts for Bitcoin (BTC) without affecting the price.
It is quite clear at this point that what we have here is a case of “claiming” as this is certainly not a short squeeze. However, we still need to understand why someone would “claim” this many Bitcoin (BTC) in one day. 20,000 Bitcoin is the equivalent of more than $200 million which means that this is likely to be the act of a group of whales or institutional investors. The question still remains, “why would they do this?” First of all, if we go back a few months, we can see that the price of Bitcoin (BTC) started to rise around the time Bitfinex ran into legal trouble. Since then we have seen continuous Tether (USDT) printing and rise in the price of Bitcoin (BTC). So, there is no doubt that those on the inside know what is going on and they are preparing for it. However, they do not want the general public to know what is going on.
So, if the number of margined shorts falls like this, the bulls are left scared thinking a short squeeze may not happen now. Some delusional bulls might even take this as a sign of bears getting wiped out and they’d buy more. The net effect of this move is that it left the market clueless. The BTCUSDShorts chart that everyone used to swear by is now of not much use all of a sudden. It used to be a good indicator of the big moves that were about to come but not anymore.

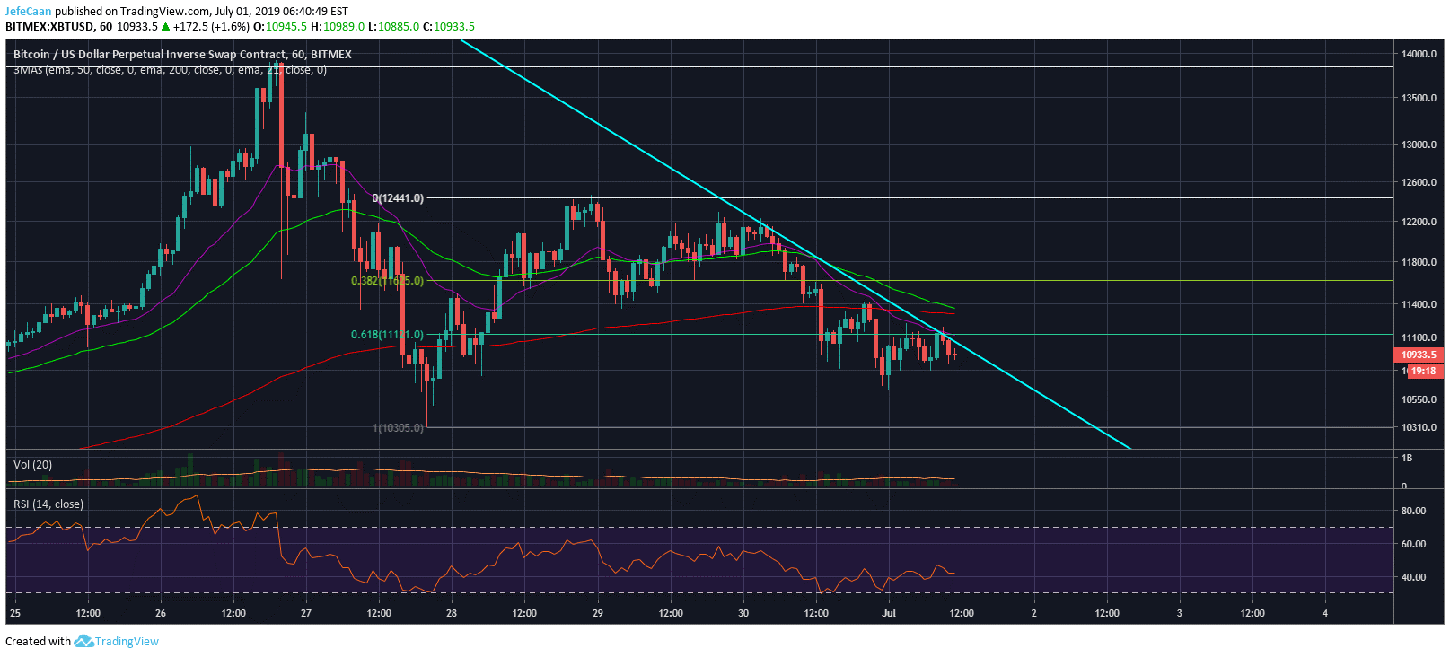
Now, if we take a look at the 1H chart for BTC/USD, we can see that the price is trading below the 61.8% fib retracement level. We could see a move to the upside short term to test the 38.2 fib retracement level again as the RSI shows a bullish divergence. However, this is not going to stop the price from eventually doing the inevitable which is to fall towards the lows of 2018 and even lower to complete this correction. As long as BTC/USD remains below $12,500 investors would be better off looking for bearish setups both short term and long term.