Sally Ho's Technical Analysis 27 June 2019
Bitcoin
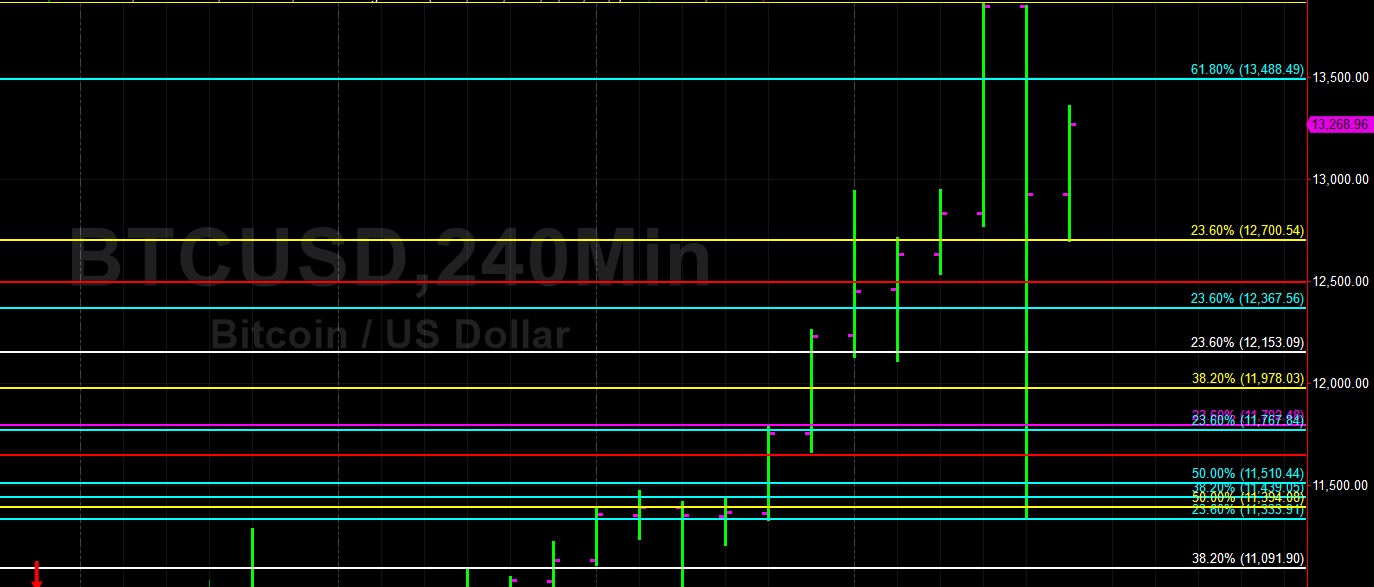
Bitcoin (BTC/USD) traded in an extremely volatile manner early in today’s Asian session as the pair fell to the 11350 area after trading as high as the 13868.44 area late in yesterday’s North American session. Buying activity started in size during yesterday’s Asian session and it accelerated during yesterday’s European and North American sessions, driving BTC/USD to its strongest print in 2019. Significant Stops were elected above the 11,510.44 area, representing the 50% retracement of the 19,891.99 – 3,128.89 range, and then above the 13,488.49 area, representing the 61.8% retracement of the same range.
Yesterday’s trading activity was some of the most volatile trading activity the market has seen since at least 2018. Above the market, chartists are citing some upside price extension objectives around the 15015 and 15935 levels. Below the market, technicians anticipate various Bids between the 10234 – 10810 areas. Also, the 11.333.91 area represents the 23.6% retracement of the move from 3128.89 – 13,868.44. Additionally, the 11362 level represents a key downside price extension objective related to yesterday’s trading activity.
Price activity is nearest the 50-bar MA (4-hourly) at 10,566.62 and the 50-bar MA (Hourly) at 11,976.00.
Technical Support is expected around 11510.44/ 11969.22/ 13347.06 with Stops expected below.
Technical Resistance is expected around 15015.01/ 15935.90/ 16,807.53 with Stops expected above.
On 4-Hourly chart, SlowK is Bearishly below SlowD while MACD is Bullishly above MACDAverage.
On 60-minute chart, SlowK is Bullishly above SlowD while MACD is Bearishly below MACDAverage.
Ethereum
Ethereum (ETH/USD) was extremely volatile early in today’s Asian session as the pair printed around the 364.49 area and then quickly depreciated to the 308.00 figure. Stops were elected above the 354.22 area, representing the 50% retracement of the move from 627.83 to 80.60. After the move higher after yesterday’s sharp selloff, Bids emerged around the 331.79 area, just below the 23.6% retracement of the move from 226.56 to 364.49.
Traders are closely watching price activity around the 337.33 area, a key upside price objective that was reached over the past couple of days. Above current market activity, the 371.61 area represents an upside price extension objective related to the recent low of 226.35. Below current market activity, Bids are cited around the 294 – 298 area with some demand likely around the 302.20 level. Additional technical Support is expected around the 289.64 and 272.56 levels.
Price activity is nearest the 50-bar MA (4-hourly) at 300.10 and the 50-bar MA (Hourly) at 323.72.
Technical Support is expected around 322.16/ 302.20/ 272.56 with Stops expected below.
Technical Resistance is expected around 364.49/ 391.32/ 413.15 with Stops expected above.
On 4-Hourly chart, SlowK is Bearishly below SlowD while MACD is Bullishly above MACDAverage.
On 60-minute chart, SlowK is Bullishly above SlowD while MACD is Bearishly below MACDAverage.
