Bitcoin (BTC): Why Retail Bulls And Bears Are Both Wrong Short Term
There is a serious lack of patience in this market. Big moves in the last two years have left everyone expecting the same roller coaster rides over and over again. While it is true that BTC/USD had a parabolic growth since its creation and has outperformed most financial assets to date, it is important to realize that this cannot go on forever. In fact, I believe that the next bull run will perhaps be the last bull run in the crypto sense of the word. After that, we will see more stability and Bitcoin (BTC) will be on its way to become a true store of value without big price swings. Now, what most retail bulls and bears do not realize is that even though BTC/USD might repeat certain parts of the previous cycle, it does not mean that it has to repeat them in the exact same way.
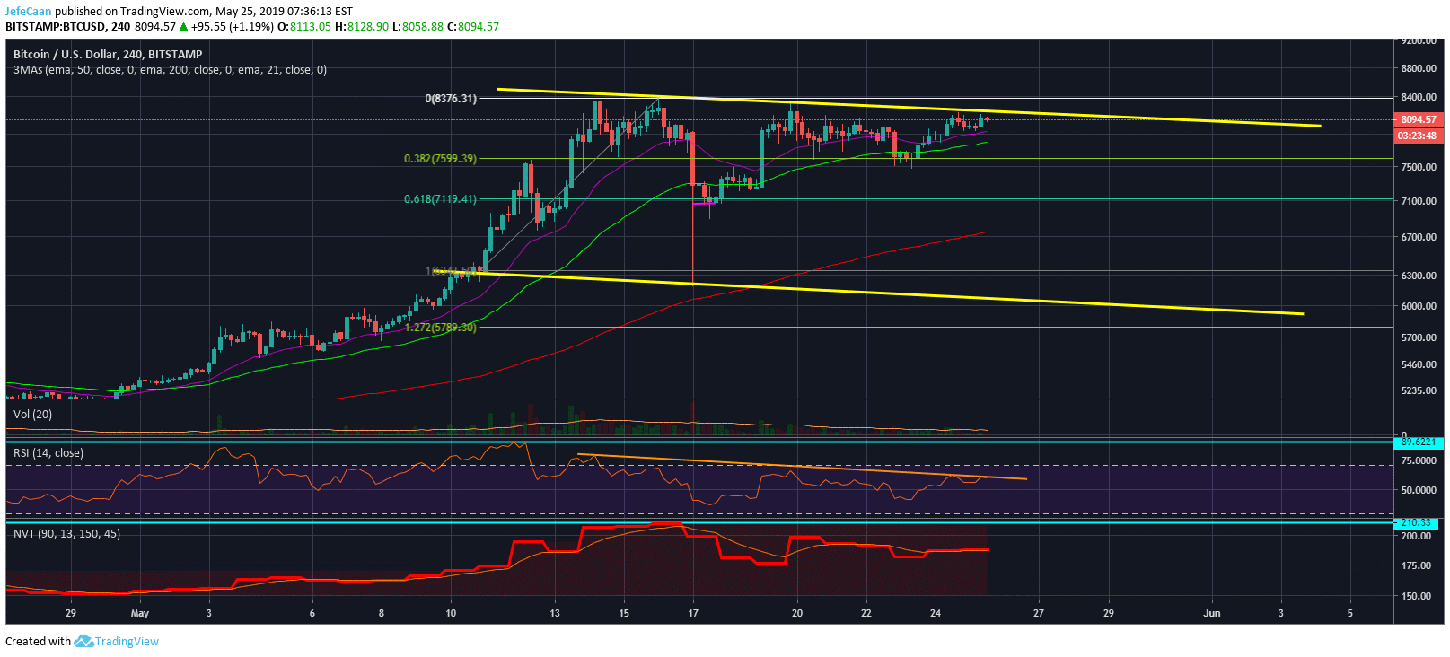
Once you make your peace with the fact that the ongoing market cycle has to be longer not shorter than the previous market cycle, everything changes. In our previous analyses on Bitcoin (BTC) we have discussed in detail why we think the ongoing market cycle has to be longer than the previous one. If the existing market cycle is longer than the previous one, it is going to be more boring as well. In other words, there will be less action. We will see a lot of sideways movement like we have in the last few weeks. However, retail bulls are expecting the price to fly towards $10,000 like yesterday just as the retail bears expect it to fall below $3,000 now. People have grown so impatient with the recent sideways movement that when they come across an analysis calling for the price to end up falling below $3,000 they expect it to happen tomorrow otherwise they consider the analysis invalid. Same goes for those calling for the price to eventually begin a new bullish cycle.
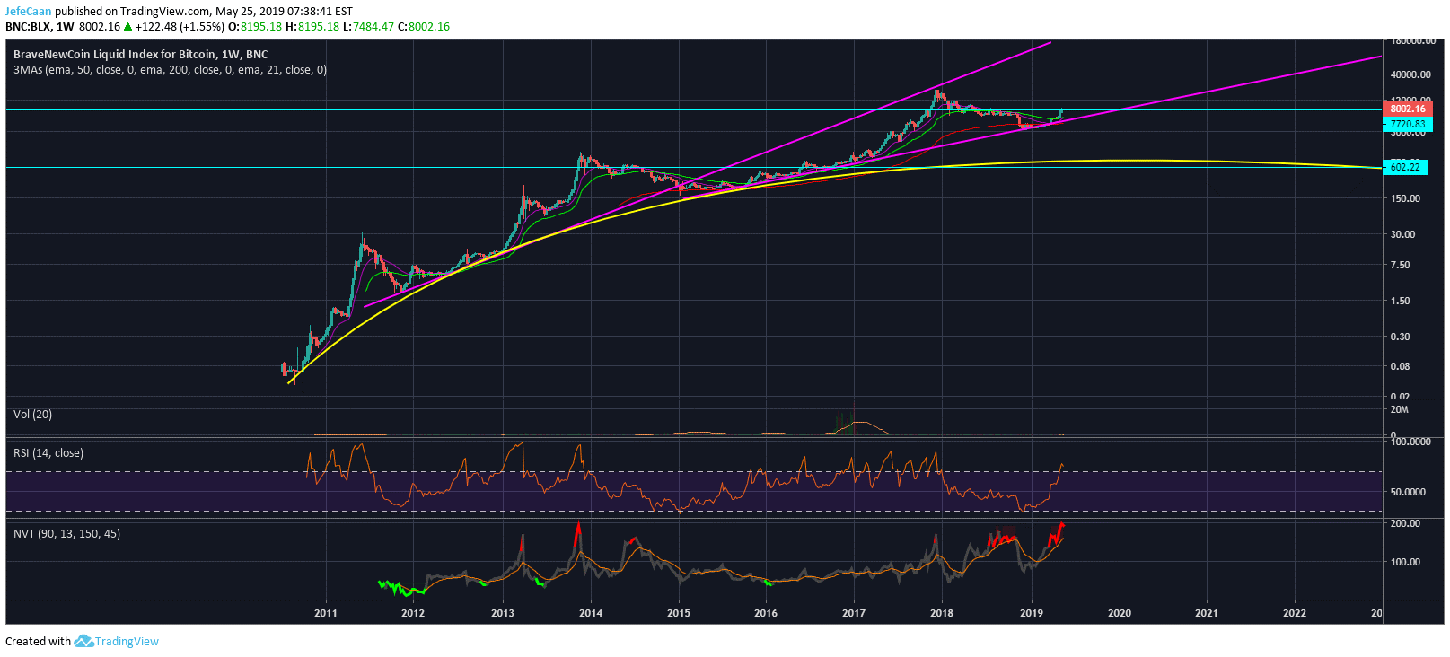
The first thing to look at when considering the future price outlook of any financial asset is the big picture. The monthly chart for BraveNewCoin Liquid Index for Bitcoin (BLX) is as big as that big picture gets. It shows exactly what has been going on since the creation of Bitcoin (BTC) and regardless of the specifics of the price action, two things are very clear. Firstly, we have seen a decline in the rate of growth i.e. the gradient of the slope has decreased. If we look at the price (y axis) and time (x axis) we can see that with the passage of time, BTC/USD has made smaller price gains relative to time.
Another pattern that stands out is that every market cycle is longer than the previous one. The price took almost half a year to bottom between 2011 and 2012. It took more than a year to bottom during the next cycle which makes it reasonable to assume that it is going to take even longer during the ongoing cycle. The price of Bitcoin (BTC) has yet to break below the trend line support of the ongoing cycle. This has to happen before BTC/USD can begin its new cycle. The trend line support will then become trend line resistance for the new cycle. However, given the recent outlook of Bitcoin (BTC) it might take years before it reaches its previous all-time high of $20,000 but the good part is that this is going to be the longest bullish cycle in Bitcoin (BTC) history.
