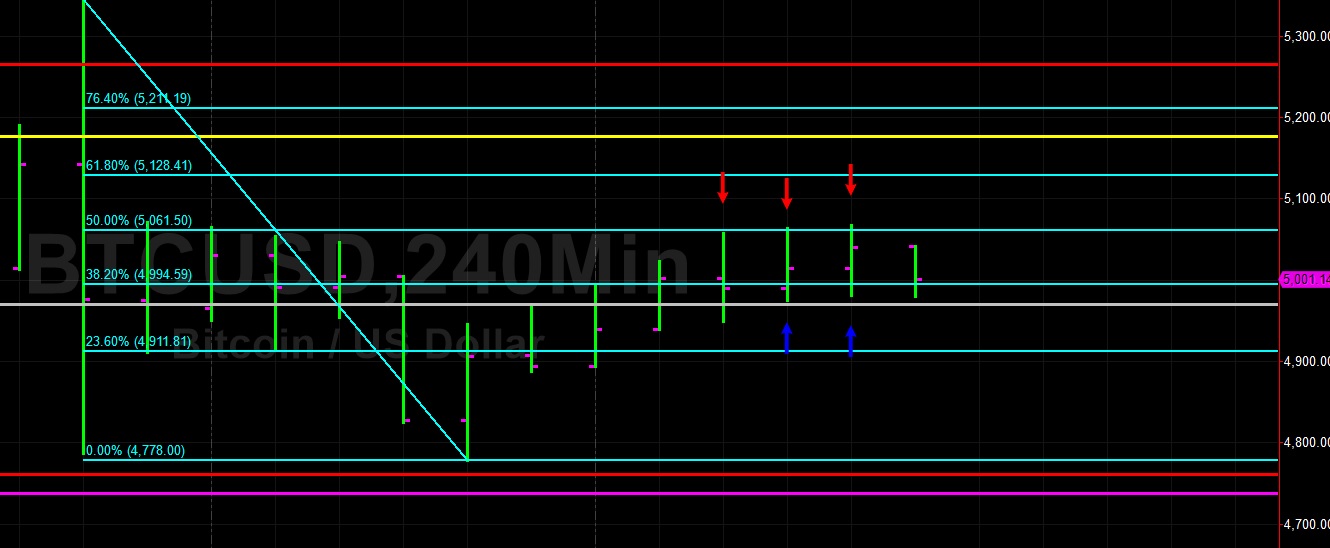
Bitcoin (BTC/USD) extended its recent run higher following its test and bounce above the 4761.41 level earlier this week, trading as high as the 5066.59 level during today’s Asian session. As noted in our 4 April 2019 analysis, the 4761.41 area remains a key technical level, representing the 38.2% retracement of the 7402.50 – 3128.89 range.
Traders were unable to take BTC/USD too far above the 5061.50 level, representing the 50% retracement of the 5345.00 – 4778.00 range. Short-term related upside technical Resistance is also expected around the 5128.41 and 5211.19 levels.
Price activity is nearest the 50-bar MA (4-hourly) at 4500.76 and the 50-bar MA (Hourly) at 4975.51.
Technical Support is expected around 4393.64/ 4137.46/ 3997.63 with Stops expected below.
Technical Resistance is expected around 5769.98/ 5941.26/ 6393.93 with Stops expected above.
On 240-minute chart, SlowK appears to be Bearishly converging with SlowD while MACD remains Bearishly below MACDAverage.
On 60-minute chart, SlowK is Bearishly below SlowD while MACD and MACDAverage have Bearishly converged.
Ethereum
Ethereum (ETH/USD) has largely been rangebound following its most recent test of the 168.47 area, representing the 61.8% retracement of the 222.78 – 80.60 range. As noted in our 4 April 2019 analysis, the 172.88 level also represents the 38.2% retracement of the move from 322.16 – 80.60.
Above this technical congestion, technical Resistance is expected around the 169.94 and 173.82 levels, representing related upside price objectives with Stops expected above.
Price activity is nearest the 50-bar MA (4-hourly) at 151.31 and the 50-bar MA (Hourly) at 161.70.
Technical Support is expected around the 144.66/ 134.91/ 130.29 levels with Stops expected below.
Technical Resistance is expected around the 180.10/ 191.40/ 201.38 levels with Stops expected above.
On 240-minute chart, SlowK has Bearishly converged with SlowD while MACD is Bearishly converging with MACDAverage.
On 60-minute chart, SlowK has Bearishly crossed below SlowD while MACD is Bullishly diverging from MACDAverage.