Published
1 week ago on
April 22, 2024

Polkadot (DOT) is showing signs of a recovery. It bucked its downward trajectory after finding strong support at the $6.40 mark.
DOT has been on a downward spiral for over a month but now stands at a crucial juncture. A potential breakout could see the cryptocurrency surge past the $8 mark.
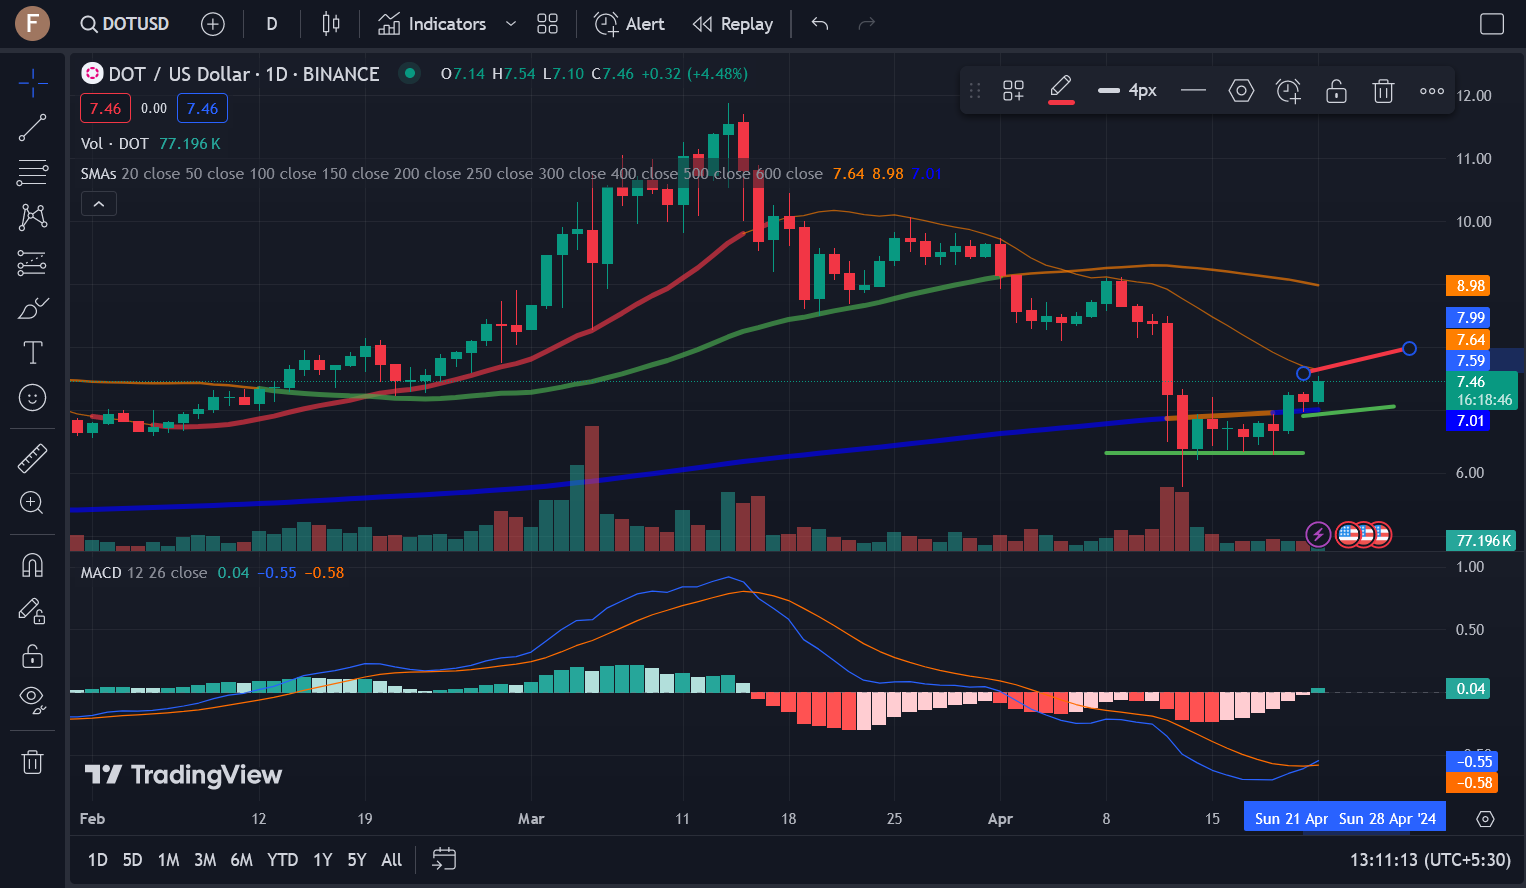
Has DOT turned a corner? A look at the daily price chart shows a strong recovery over the weekend. DOT had seen a significant drop over the past weekend, dropping from $8.38 to $6.40, but making a solid recovery on Sunday, rising by 7.19% to $6.86. However, at this point, DOT faced significant resistance thanks to the 200-day SMA, as can be seen in the chart below. As a result, DOT was back in the red on Monday, dropping by 2.19% to $6.71, although it was able to reach a high of $7.21 before bearish sentiment took over. Tuesday saw hardly any movement in price, while Wednesday registered a drop of 1.79%.
However, with strong support around the $6.40 mark, DOT recovered on Thursday, rising by just over 3% to $6.79. However, it could not test the resistance at $7 and dropped back to $6.68 on Friday. Looking at the price chart over the price movement, we can see a period of consolidation around the $6.40 and the $6.60 mark, suggesting an impending battle between buyers and sellers looking to take control over the weekend.
Buyers won the battle over the weekend, as DOT registered an increase of 8.38% on Saturday. This was enough to push it past the 200-day SMA and settle at $7.24. Sunday saw a drop of 1.38%, but with the 200-day SMA now acting as support, DOT quickly recovered during the ongoing session. Currently, DOT is up by 4.48% and is trading at $7.46, with buyers firmly in control.
Now, let’s take a look at the indicators to gauge how the DOT price could play out. As we can see from the chart above, DOT has strong support at around the $6.40 mark. Now, it also has support at $7, thanks to the 200-day SMA. The next major resistance lies at the 20-day SMA at $7.70. If DOT is able to break past this price level, we could see a surge toward $8.50 or $9, which is where the 50-day SMA could act as resistance.
However, should sellers retake control of the session, DOT could drop back to $7. If this level of support is breached, DOT could drop to the support at $6.40. Looking at the technical indicators, the MACD has flipped to bullish, indicating that we could see the DOT price continue its upward momentum. However, the Parabolic SAR is still bearish but could flip to bullish if buyers remain in control.
Polkadot has seen a lot happening recently, with the blockchain network hitting several notable milestones. The weekend, Polkadot founder Gavin Wood introduced a Gray Paper discussing the upcoming Join Accumulate Machine (JAM) upgrade. Wood introduced the paper during his presentation at the Token2049 conference in Dubai. Wood described JAM as a groundbreaking protocol that merges elements from Polkadot and Ethereum. The release comes a decade after the release of the Yellow Paper and marks a significant evolution that will ultimately see Polkadot’s Relay Chain replaced with a more modular and minimalistic design.
“Earlier today @gavofyork unveiled the JAM Gray Paper. JAM is a protocol combining elements of both Polkadot and Ethereum. It is a prospective path to replace the Relay Chain with a more modular, minimalistic design.”
Disclaimer: This article is provided for informational purposes only. It is not offered or intended to be used as legal, tax, investment, financial, or other advice.
Investment DisclaimerCrypto Analysts Tip this New Token to be the Next Big Solana Meme Coin
Tether Implements USDT Surveillance in Partnership with Chainalysis