Bitcoin $3,000 reversal: Healthy correction or the start of something bigger?
 Laurie Dunn

With the U.S. stock market on the slide again Bitcoin was not able to hold its recent rally, giving back all the gains made on Tuesday and into Wednesday. Was this a standard healthy correction, or could this be the start of a bigger reversal?
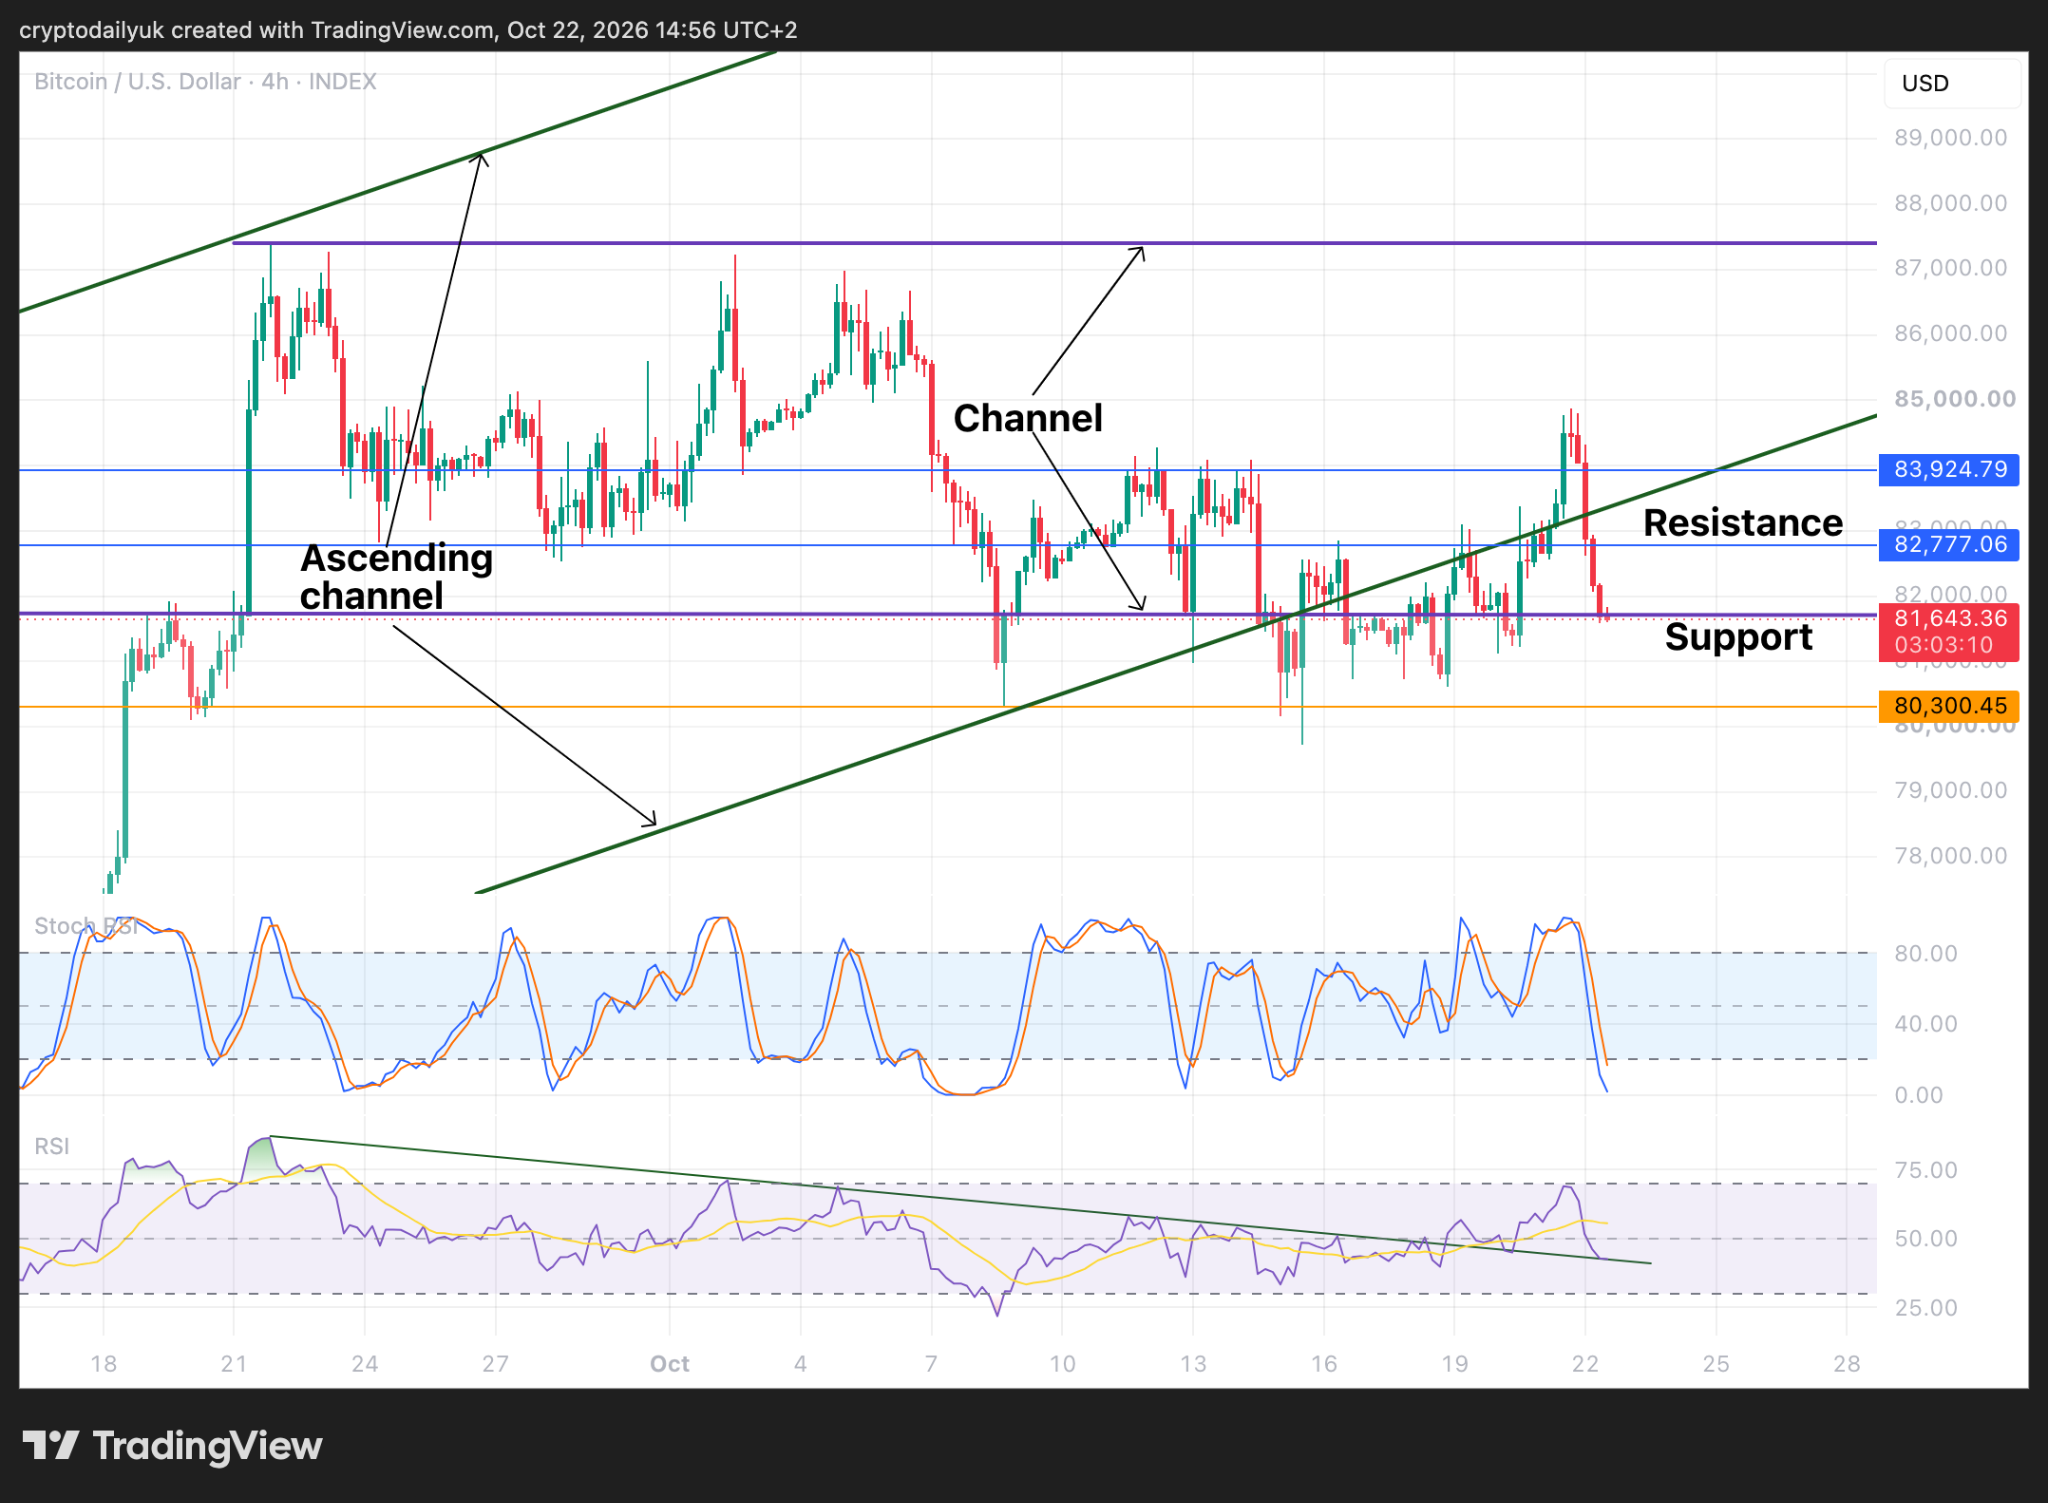
If support fails, $BTC price could lose touch with the ascending channel
Source: TradingView
After a quick correction the $BTC price is back holding support at the bottom of the parallel channel. Is the correction over? It could be, but it will depend on whether the channel support holds. If it doesn’t, there is horizontal support at $81K, and then at $80,300. If these fail, the $BTC price could very well lose touch with the ascending channel and a target in the low $70K range could be on the table.
One important thing to bear in mind if a short-term trader is that the S&P 500 is opening almost a full percentage point down as per the futures chart. This is depressing the stock market, which is bound to also affect the crypto market.
The indicators at the bottom of the chart could save the day. The Stochastic RSI indicators are bottoming and could signal a bounce soon. While the RSI indicator has come back to retest the descending trendline. This trendline goes back about a month, so it should be fairly reliable support. A bounce here is also quite likely.
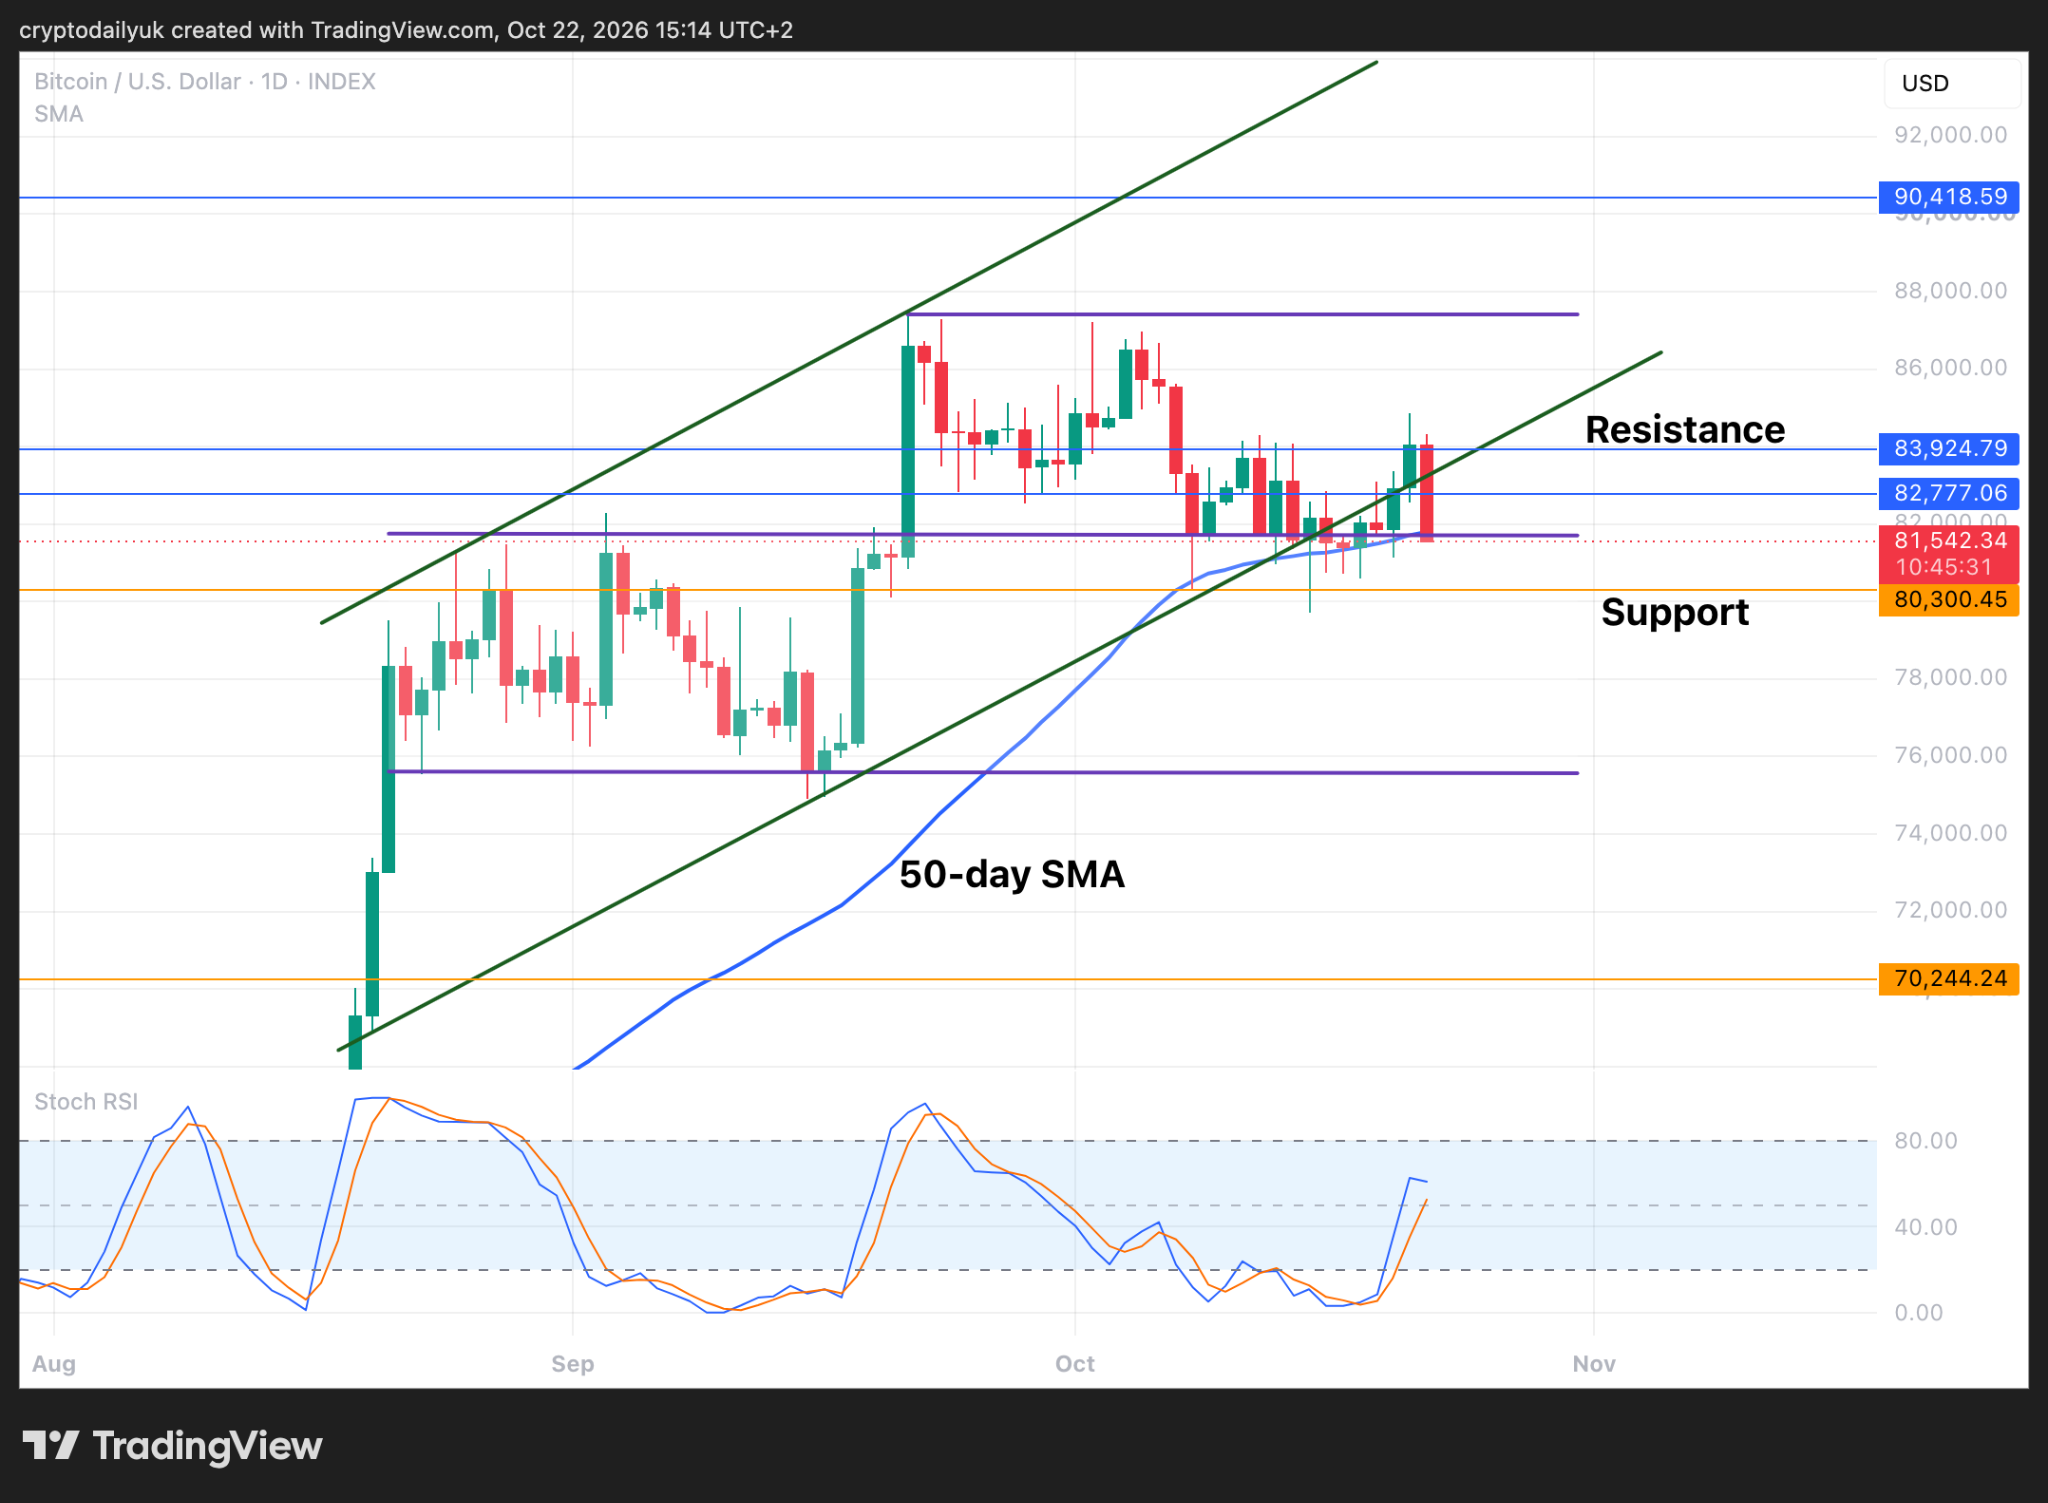
Channel bottom and 50-day SMA provide strong support
Source: TradingView
The daily time frame reveals that the $BTC price is nudging down below the boundary between the two parallel channels. This is also where the 50-day simple moving average (SMA) is offering its support. As can be seen previously, a few candle tails came down below these supports, but all were eventually bought back up. Is it going to be the same thing again this time?
If this big rally out of the bear market is to continue, the bulls will need to push the $BTC price back inside the ascending channel - yet again. A full correction is going to happen at some point, but can the bulls tick off a couple more key resistance levels first?
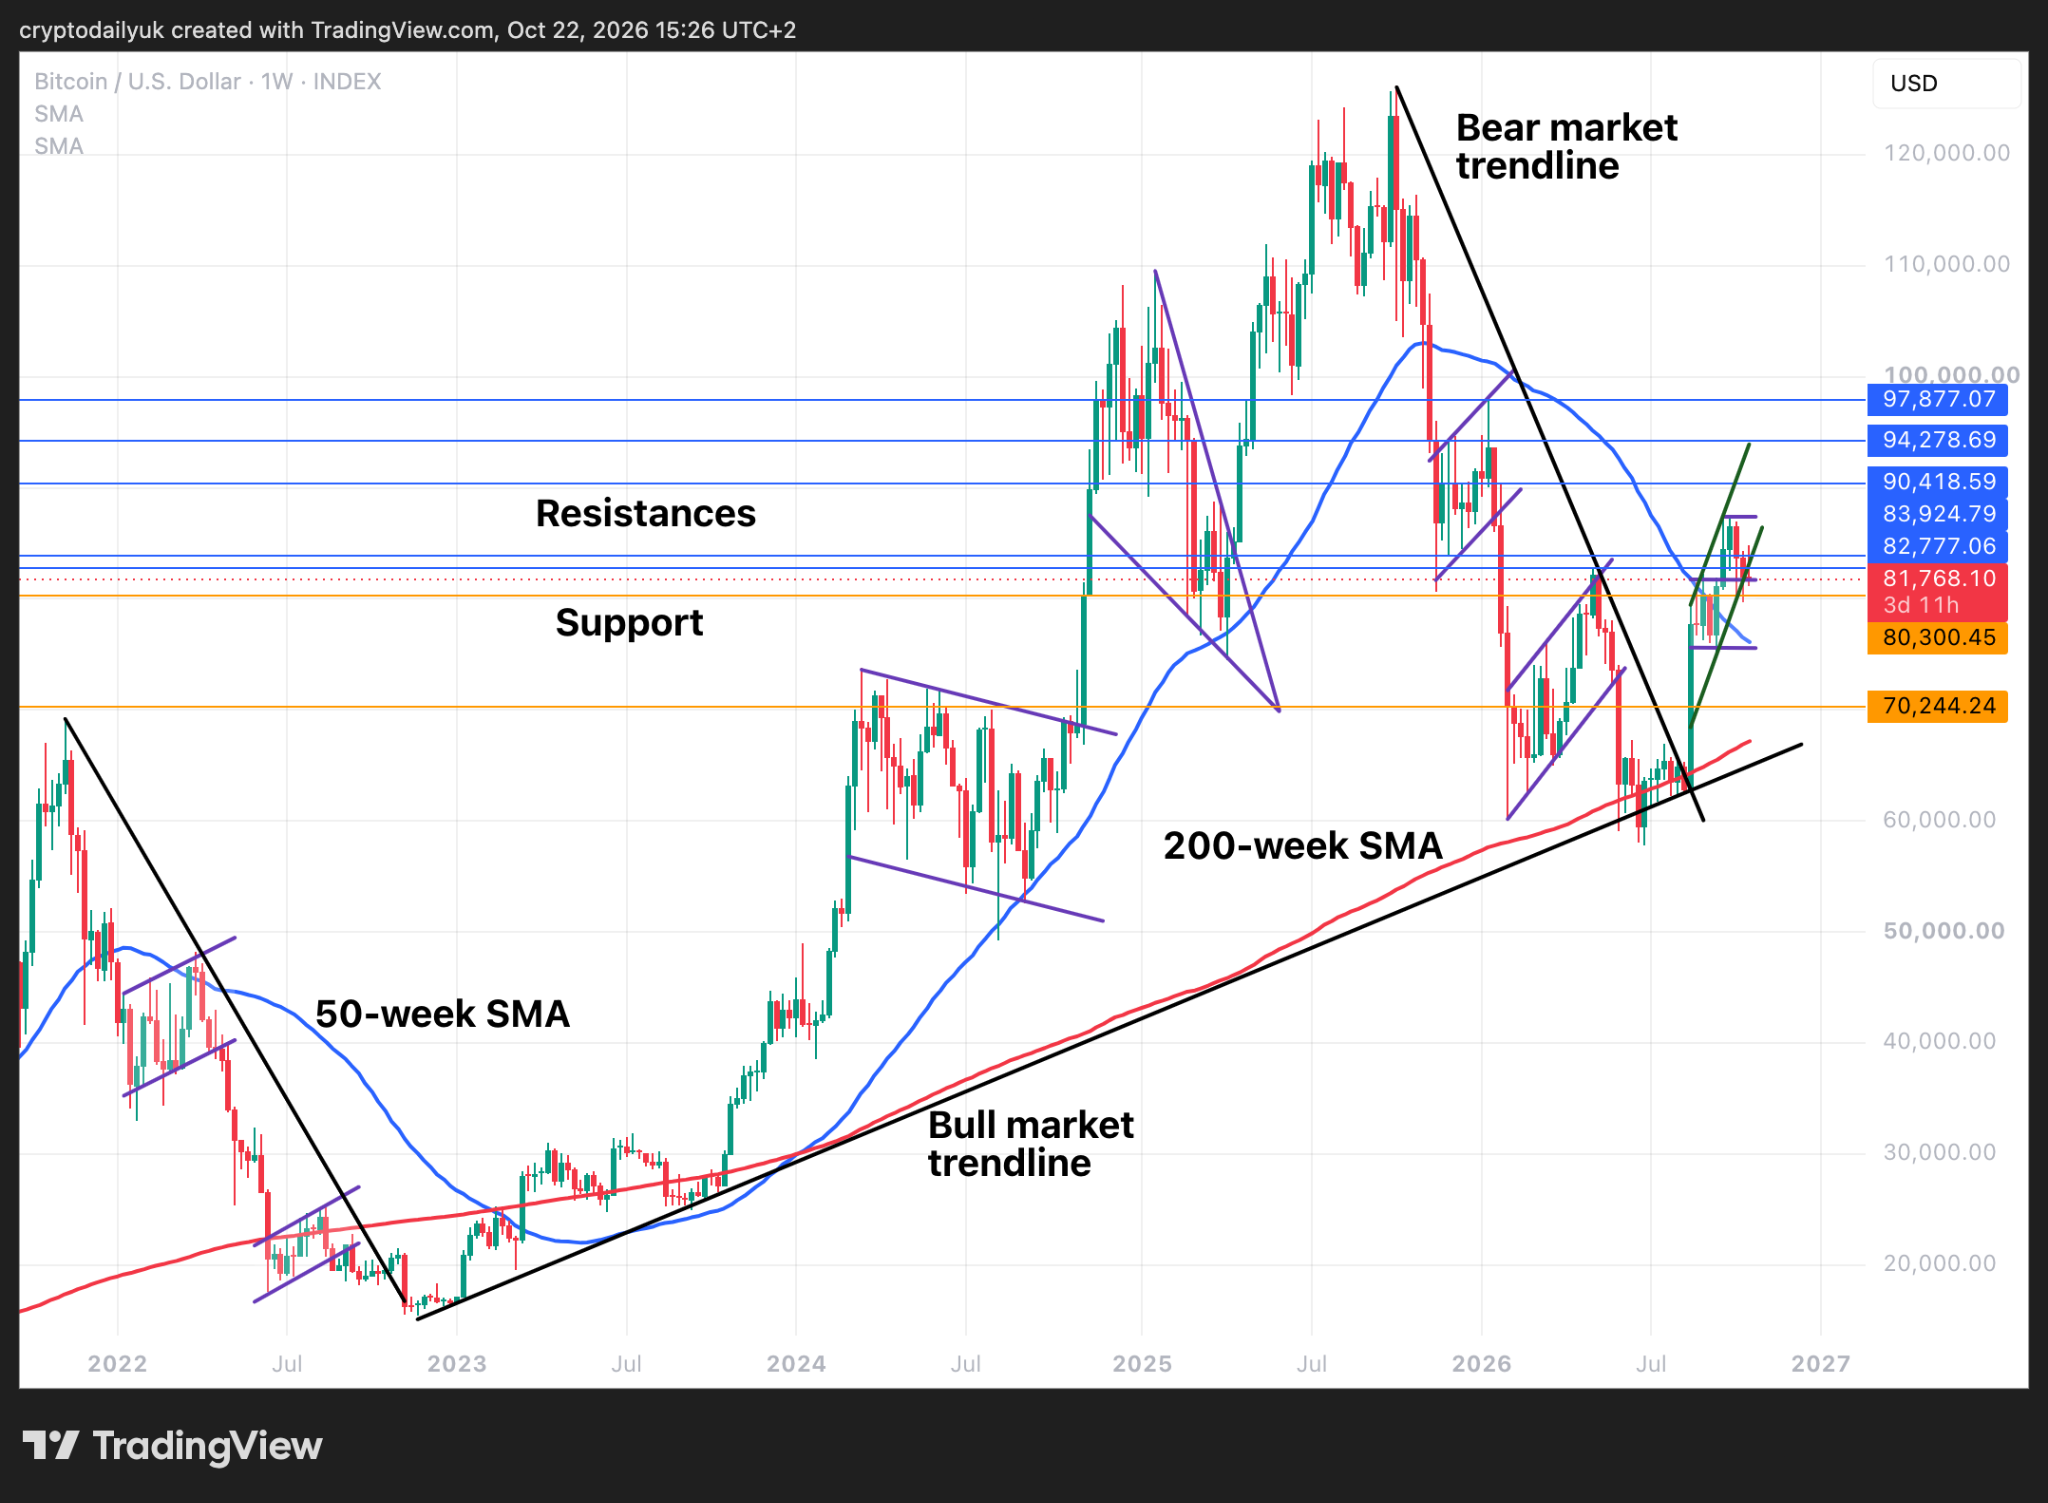
50-week SMA getting ready to turn back around and provide bull market support
Source: TradingView
Zooming right out into the weekly chart we can see that the trajectory of the 50-week SMA is becoming less steep. As per the previous bull market, it should start to flatten out, pass through the 200-week SMA (death cross) and then bottom, before heading up and back over the 200-week SMA (golden cross). If all goes as per the previous bull market, the $BTC price will stay above this moving average for the entirety of this new bull market.
Disclaimer: This article is provided for informational purposes only. It is not offered or intended to be used as legal, tax, investment, financial, or other advice.
Related Stories