Bitcoin dips to test support: Will it hold?
 Laurie Dunn

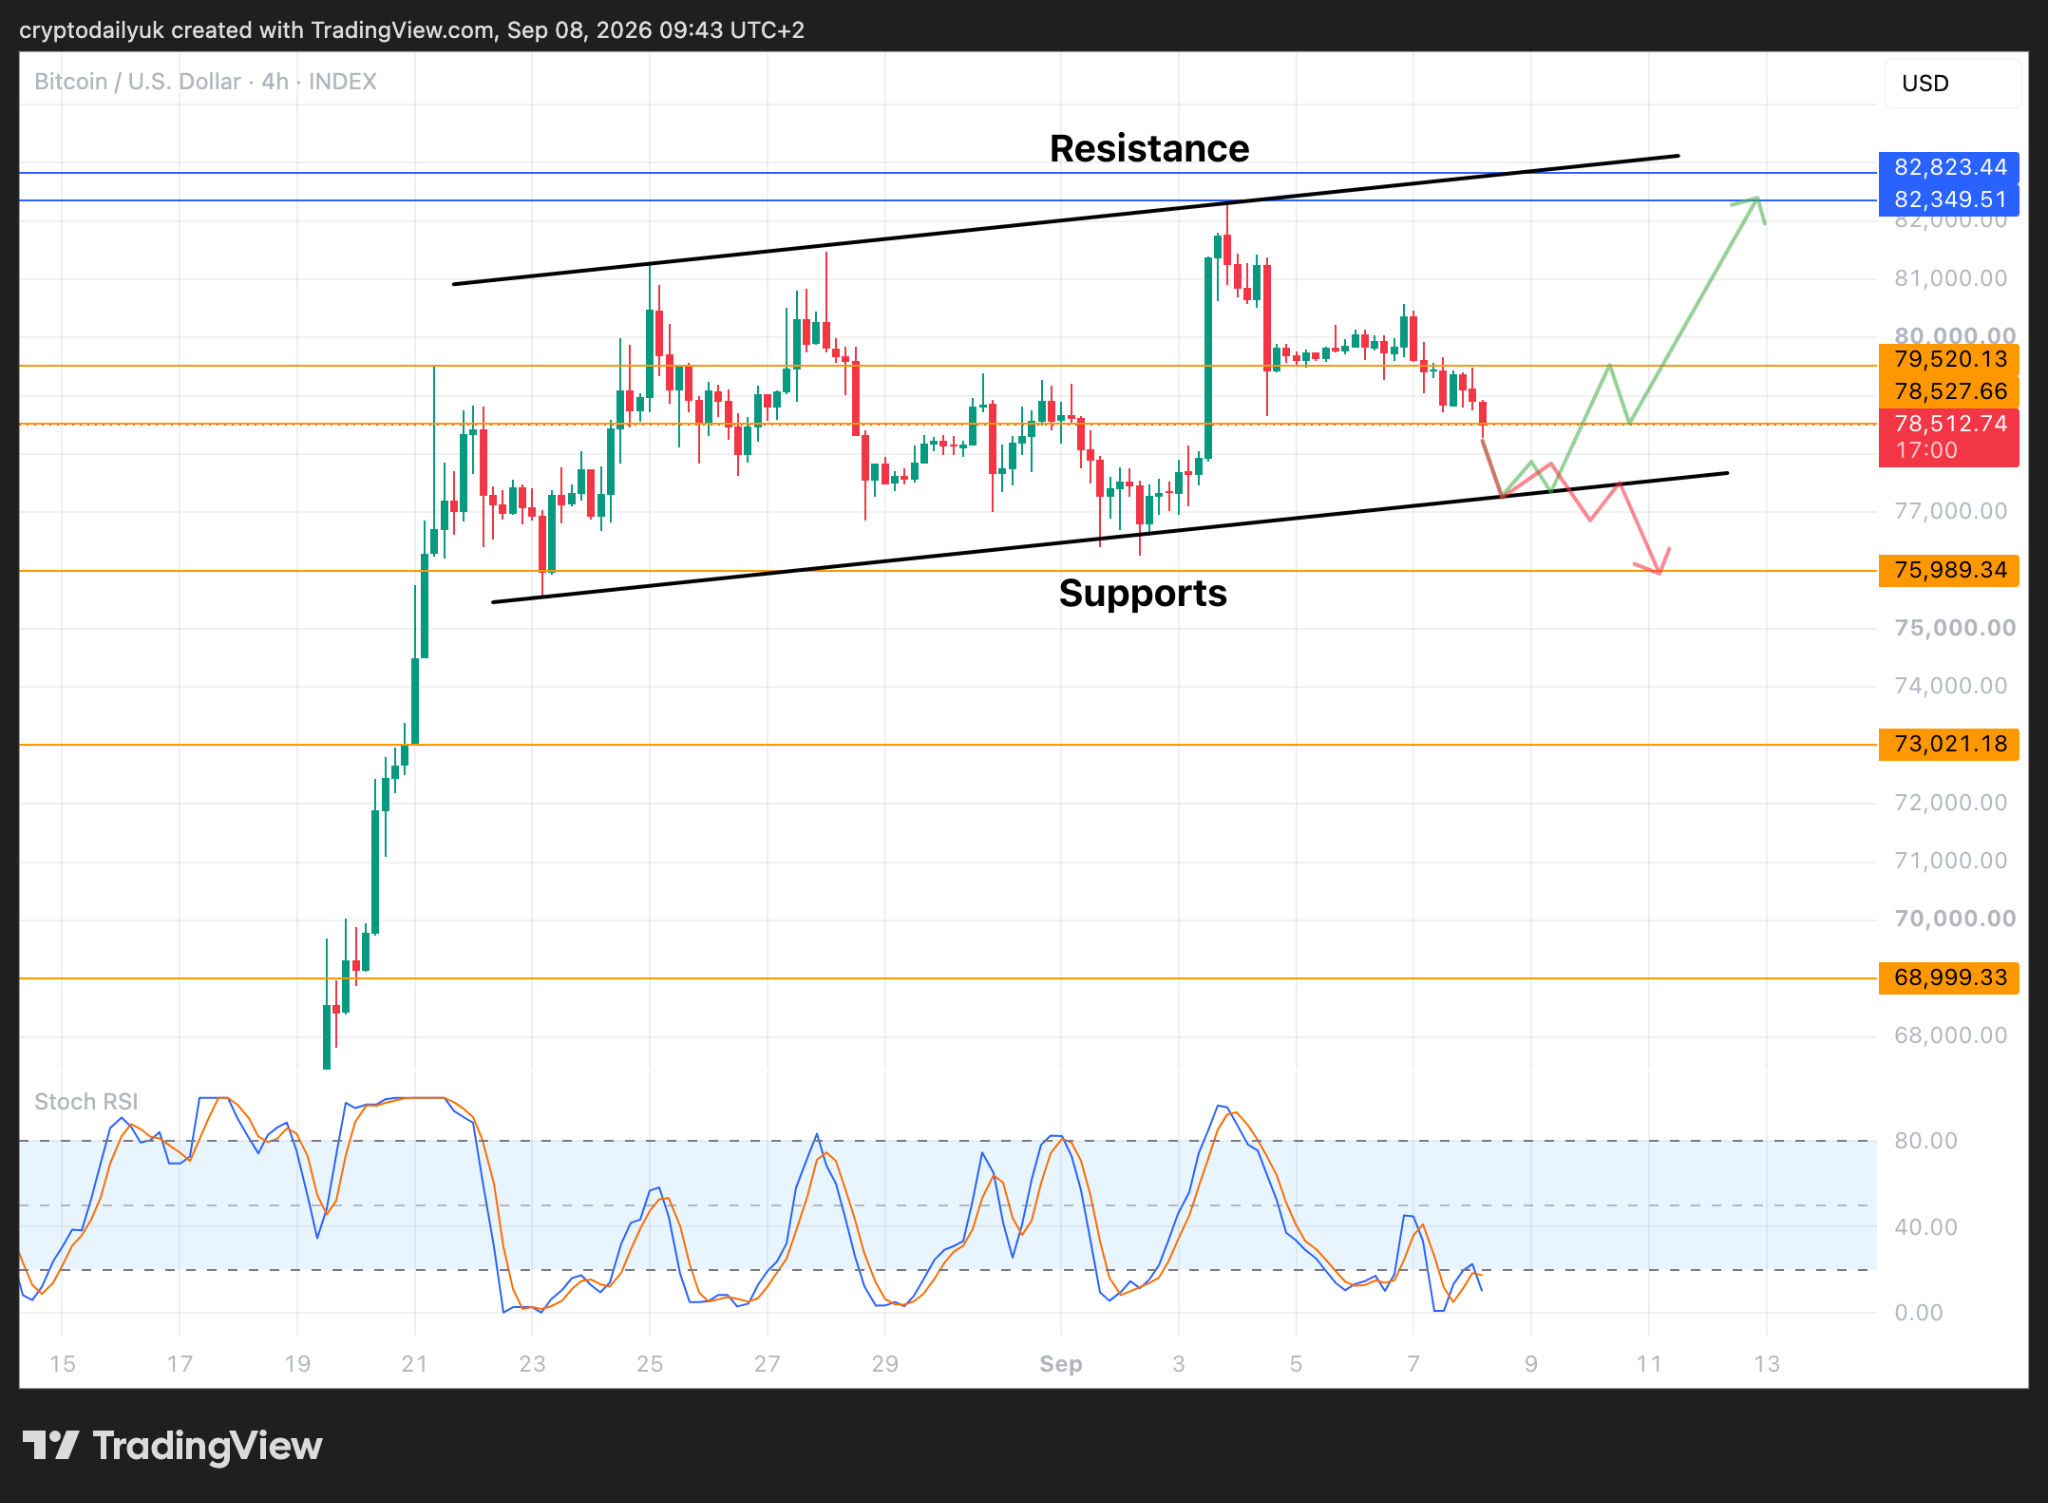
The Bitcoin price has been steadily losing ground since making the last local high at $82,300. Currently at $78,400, the $BTC price could be heading back to the bottom of a channel at $77K, or perhaps to strong support at $76K. If these don’t hold, $73K comes into play.
Retest of the channel bottom, or breakdown?
Source: TradingView
The 4-hour chart shows the slightly upsloping channel that the $BTC price has been navigating within for the last couple of weeks or so. After three touches to the top of the channel, it may be that the price comes down for an extra touch of the bottom of the channel now. After this, it remains to be seen whether there will be a bounce back to the top of the channel, or if the price will fall through the bottom of the channel?
If the $BTC price does break down out of the channel, the first level of support is at $76K, which is a good one. However, if the measured move out of the channel is completed, this could take the price all the way down to the low $70K region.
This isn’t an expected scenario, given that all the shorter term Stochastic RSI indicators are at or near the bottom of their ranges, so they should start to cross back up in the next day or so. Therefore, the green arrow path could be more likely.
Will support hold?
Source: TradingView
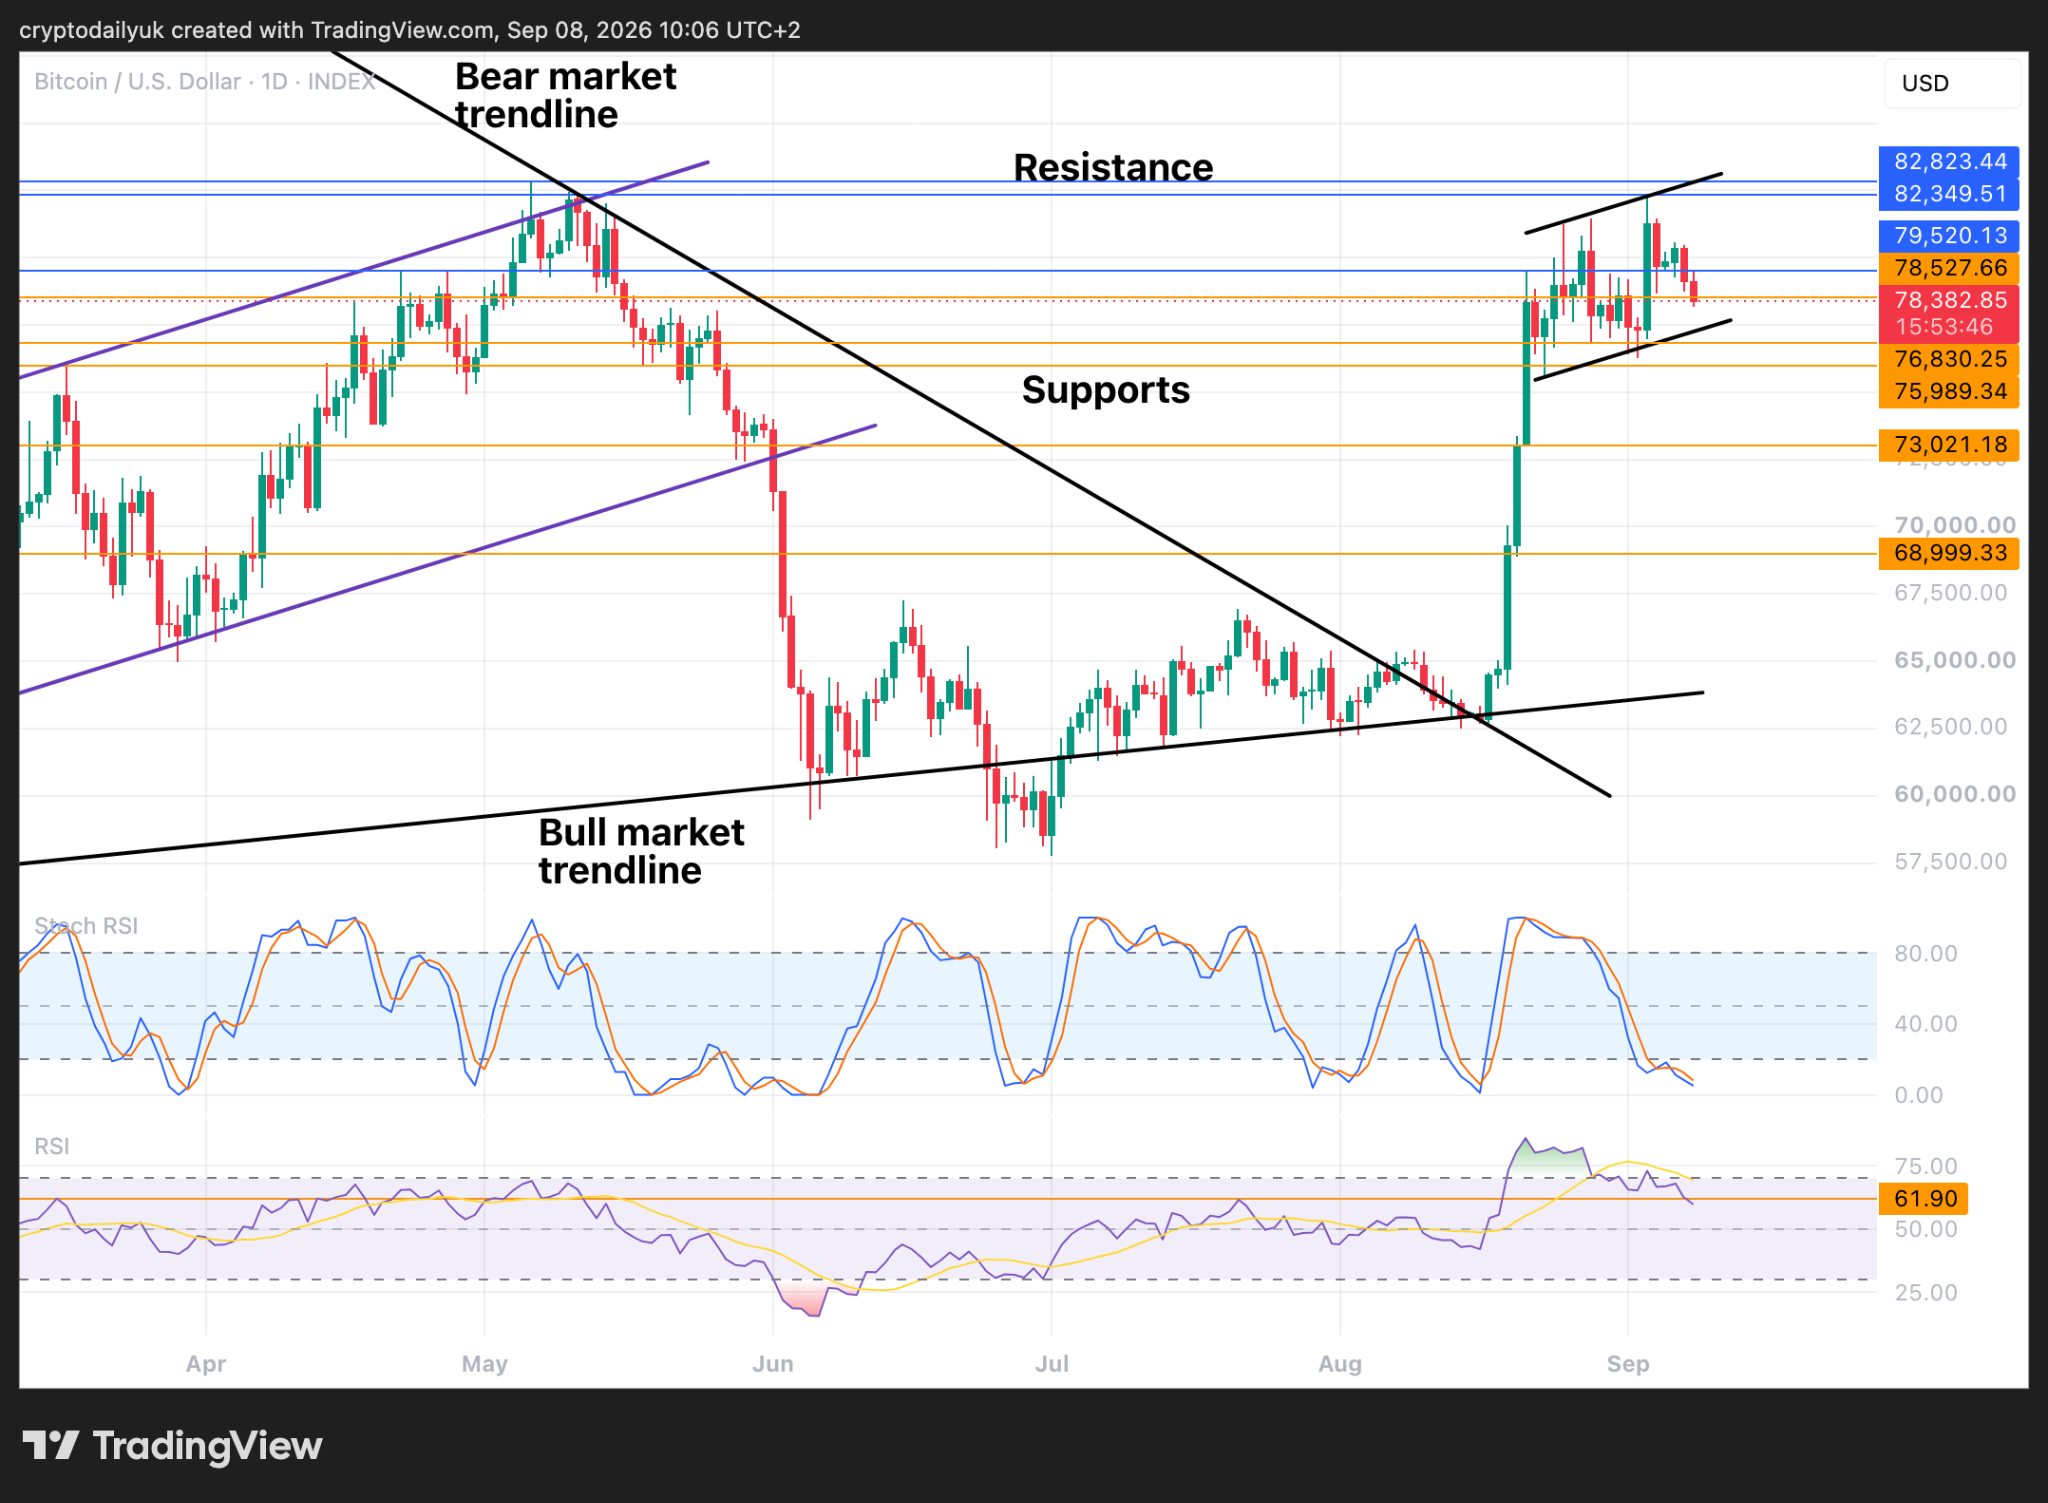
Now into the daily time frame it can be seen that the horizontal support at $78,530 could be about to break. This would leave the path clear to the bottom of the channel and the support levels just below.
As can be observed in the Stochastic RSI, the indicator lines in this time frame are also practically at the bottom, although as can be seen after the $BTC price hit the last high, the indicator lines can bounce along the bottom for quite a while, bringing the price down much further.
In the Relative Strength Index (RSI) there is a support level at 61.90 which would be good for the indicator line to hold. If it does break down, the next support is the mid-level at 50.00.
Lower high, or continuation of the rally?
Source: TradingView
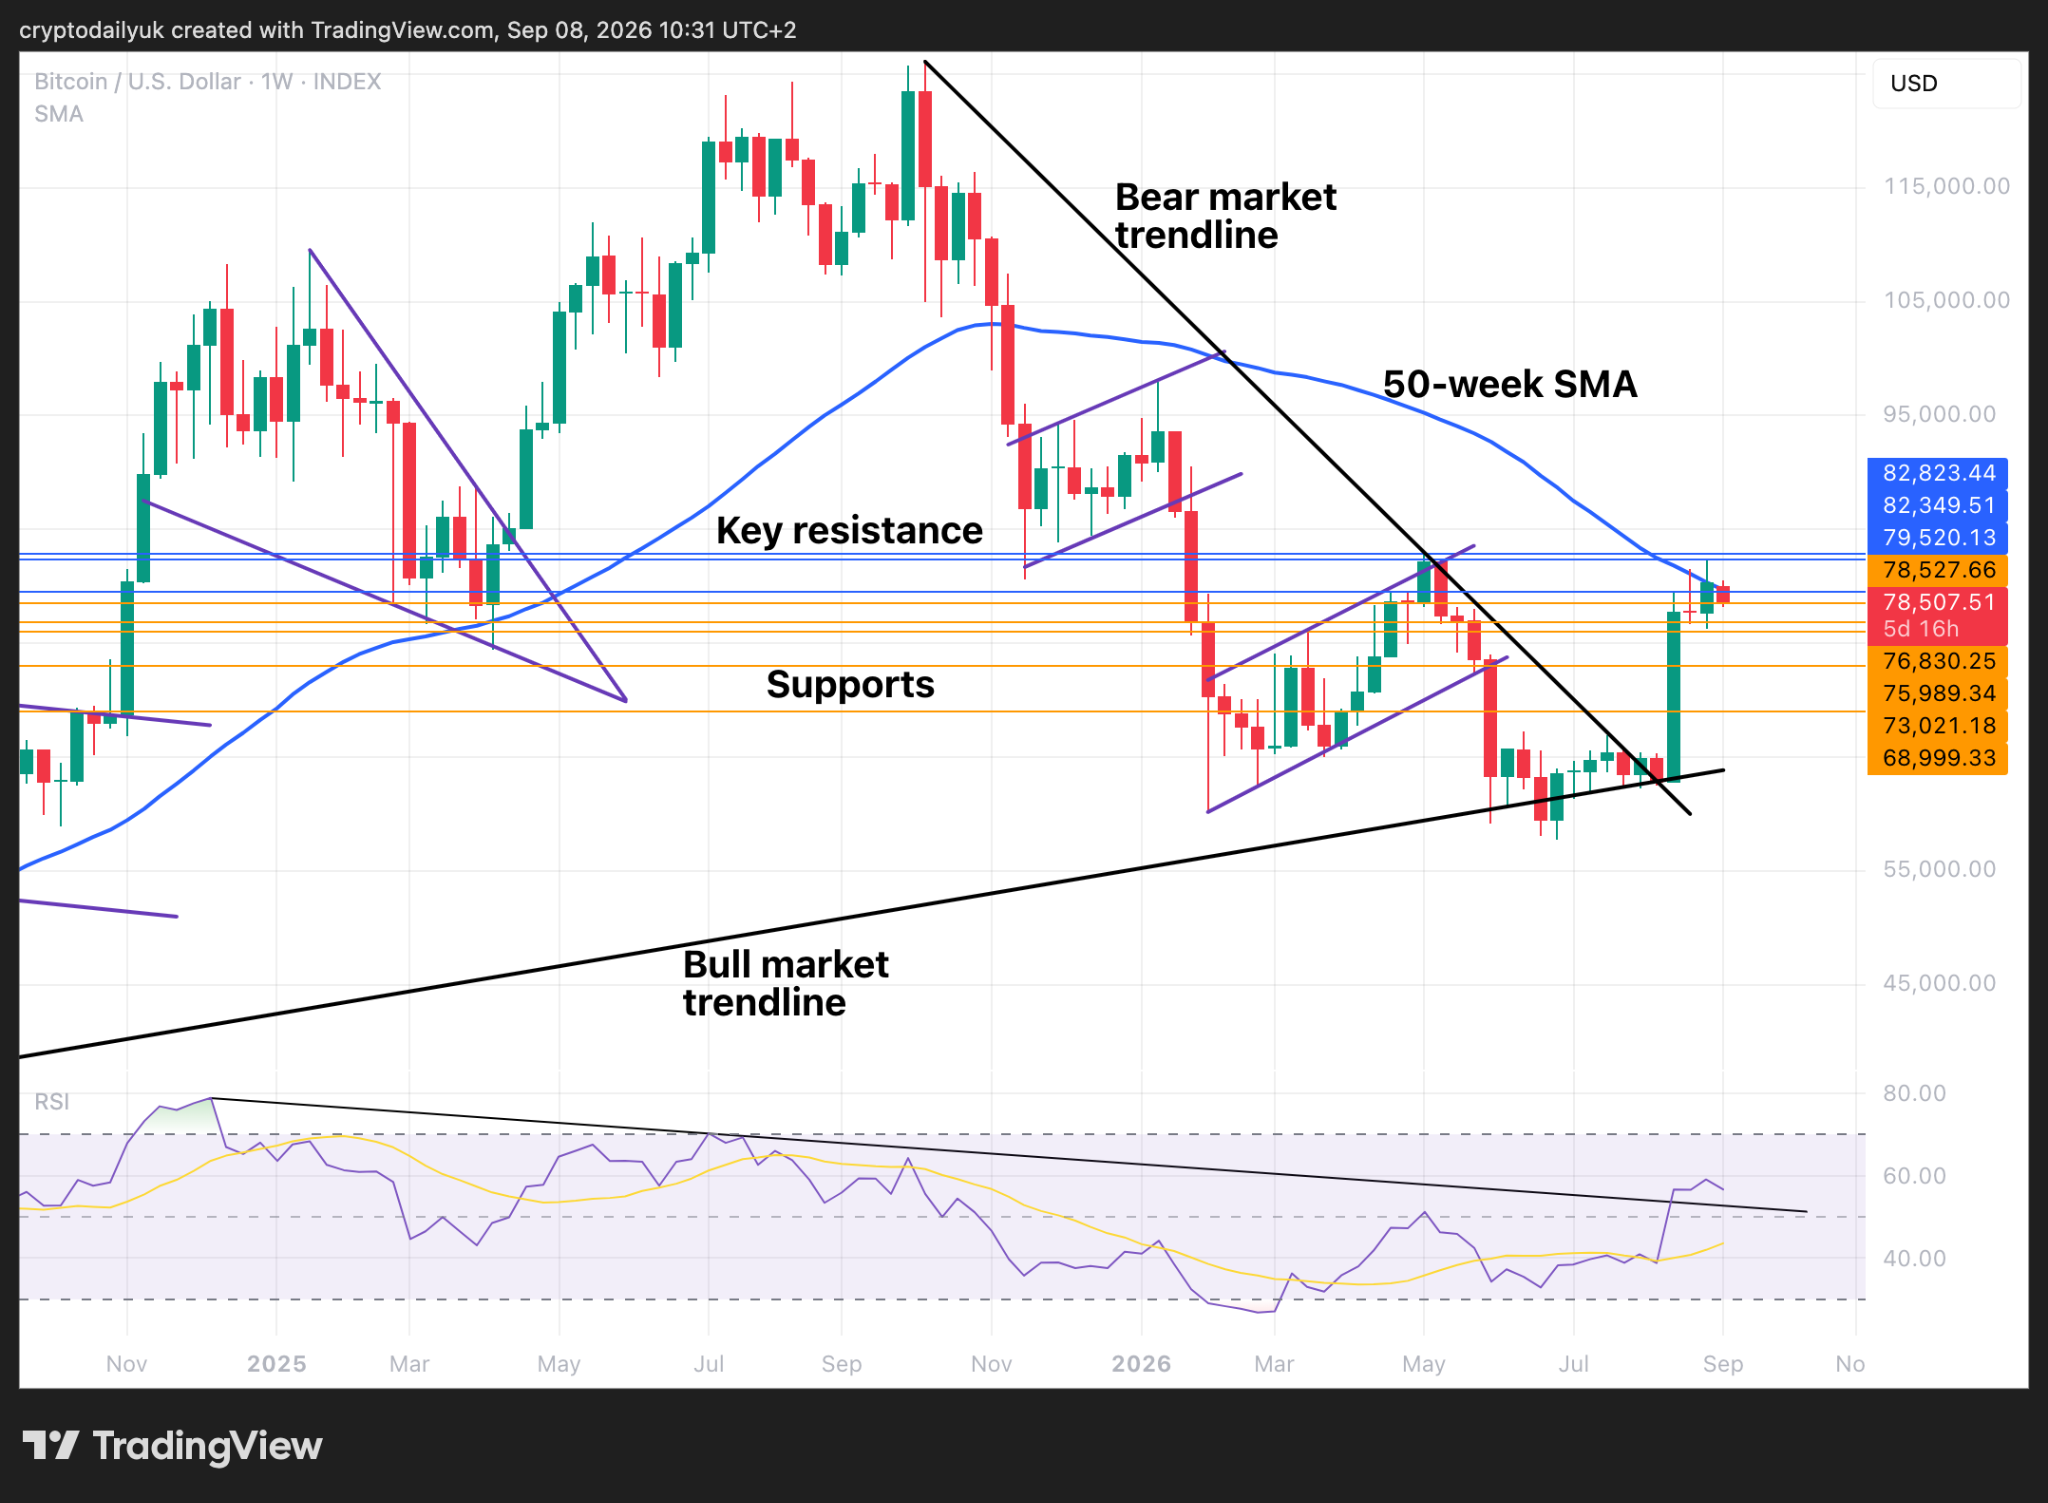
The weekly time frame reveals that the $BTC price is rejecting from the key resistance, as well as the 50-week SMA. As discussed in an article last Thursday, if this correction continues, the price will have made a lower high. Could it then go on to make a lower low?
This is the bearish thesis, but having broken out of the bear market down trend, and with such a powerful green candle, the bulls still have the upper hand. After such an explosive breakout, there was bound to be a decent period of consolidation, and it would appear that this is probably it. The three more likely levels for the $BTC price to hit and bounce are at $76K, $73K, and $70K. This is assuming that it breaks down out of the ascending channel.
At the bottom of the chart, the RSI indicator line is bending back around. After breaking out of a 22-month down trend, the indicator line is likely coming back to test the breakout. If it holds and bounces higher, this will be the signal that the upside rally is to continue.
Disclaimer: This article is provided for informational purposes only. It is not offered or intended to be used as legal, tax, investment, financial, or other advice.
Related Stories