Bitcoin Bulls Fight Back as $76K Support Holds
 Laurie Dunn

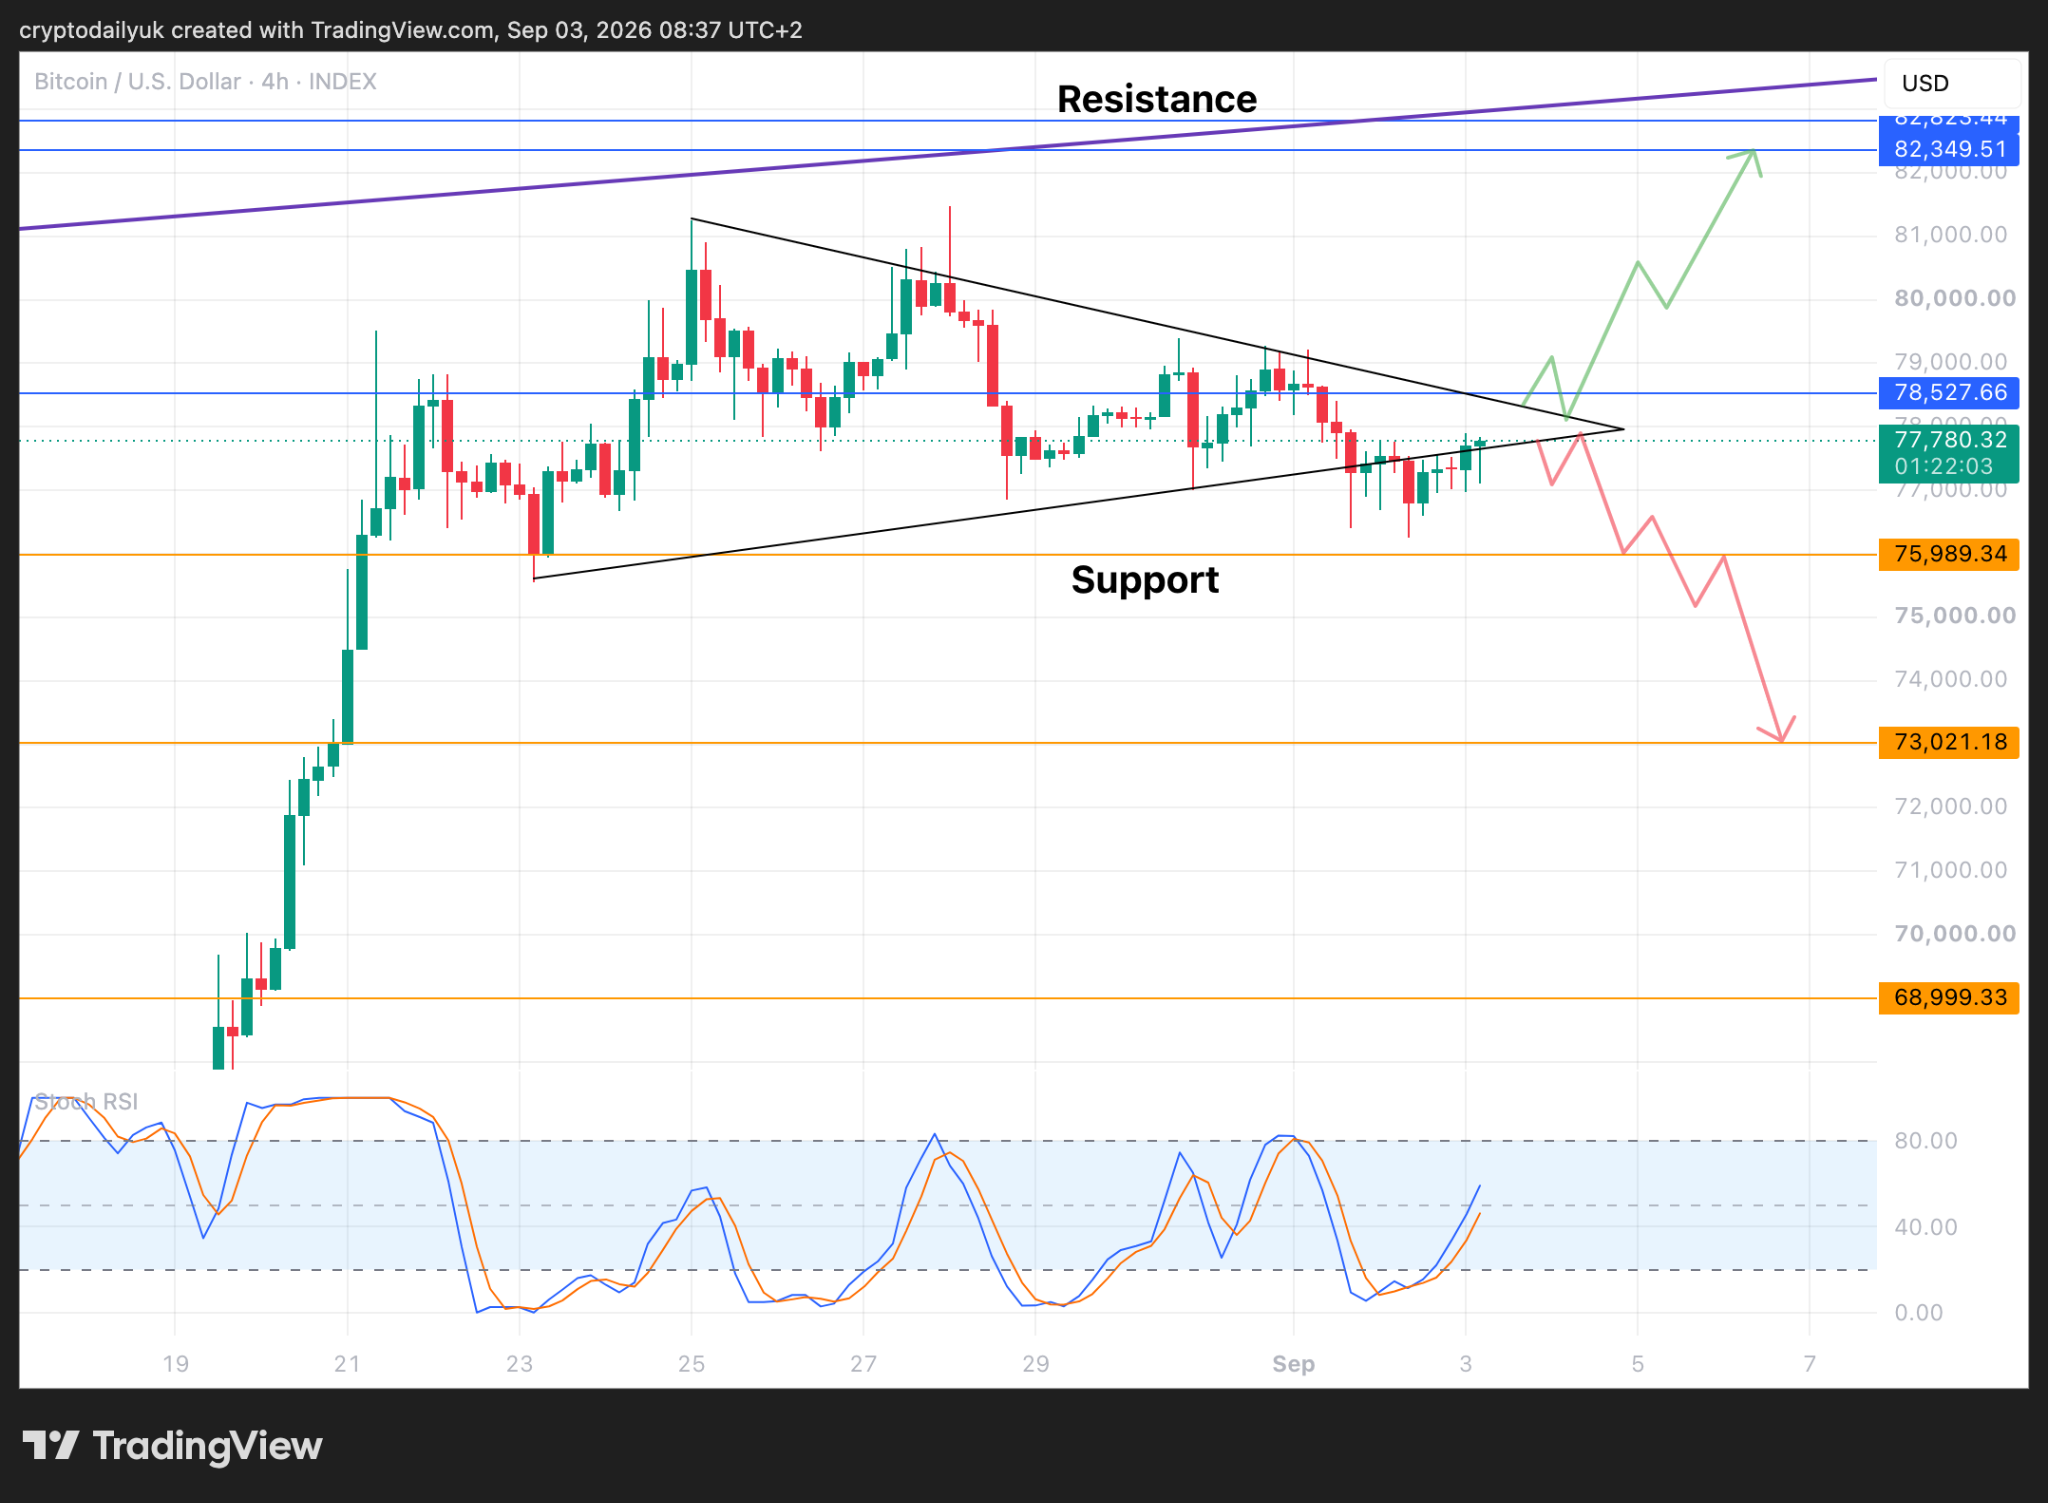
After continuing a dip from $79K, the $BTC price held above the $76K horizontal support and the bulls were able to send the price back up again. Having attained the bottom of the bull pennant can the price reestablish itself inside again?
Fakeout as bulls recover?
Source: TradingView
Did we just witness the dip that really wasn’t? Was this just a fakeout after all? As can be seen, the $BTC price is in the process of trying to reestablish itself back inside the bull pennant. It will or it won’t, but it is starting to run out of room, at least as far as this pennant is concerned.
If the bulls do succeed in thrusting the price back inside the pennant, a decision is fast approaching as to whether the price will then break to the upside and make its way to the key overhead resistance, or if the price will properly break down this time and head for $73K or even lower.
A continuation of the rally?
Source: TradingView
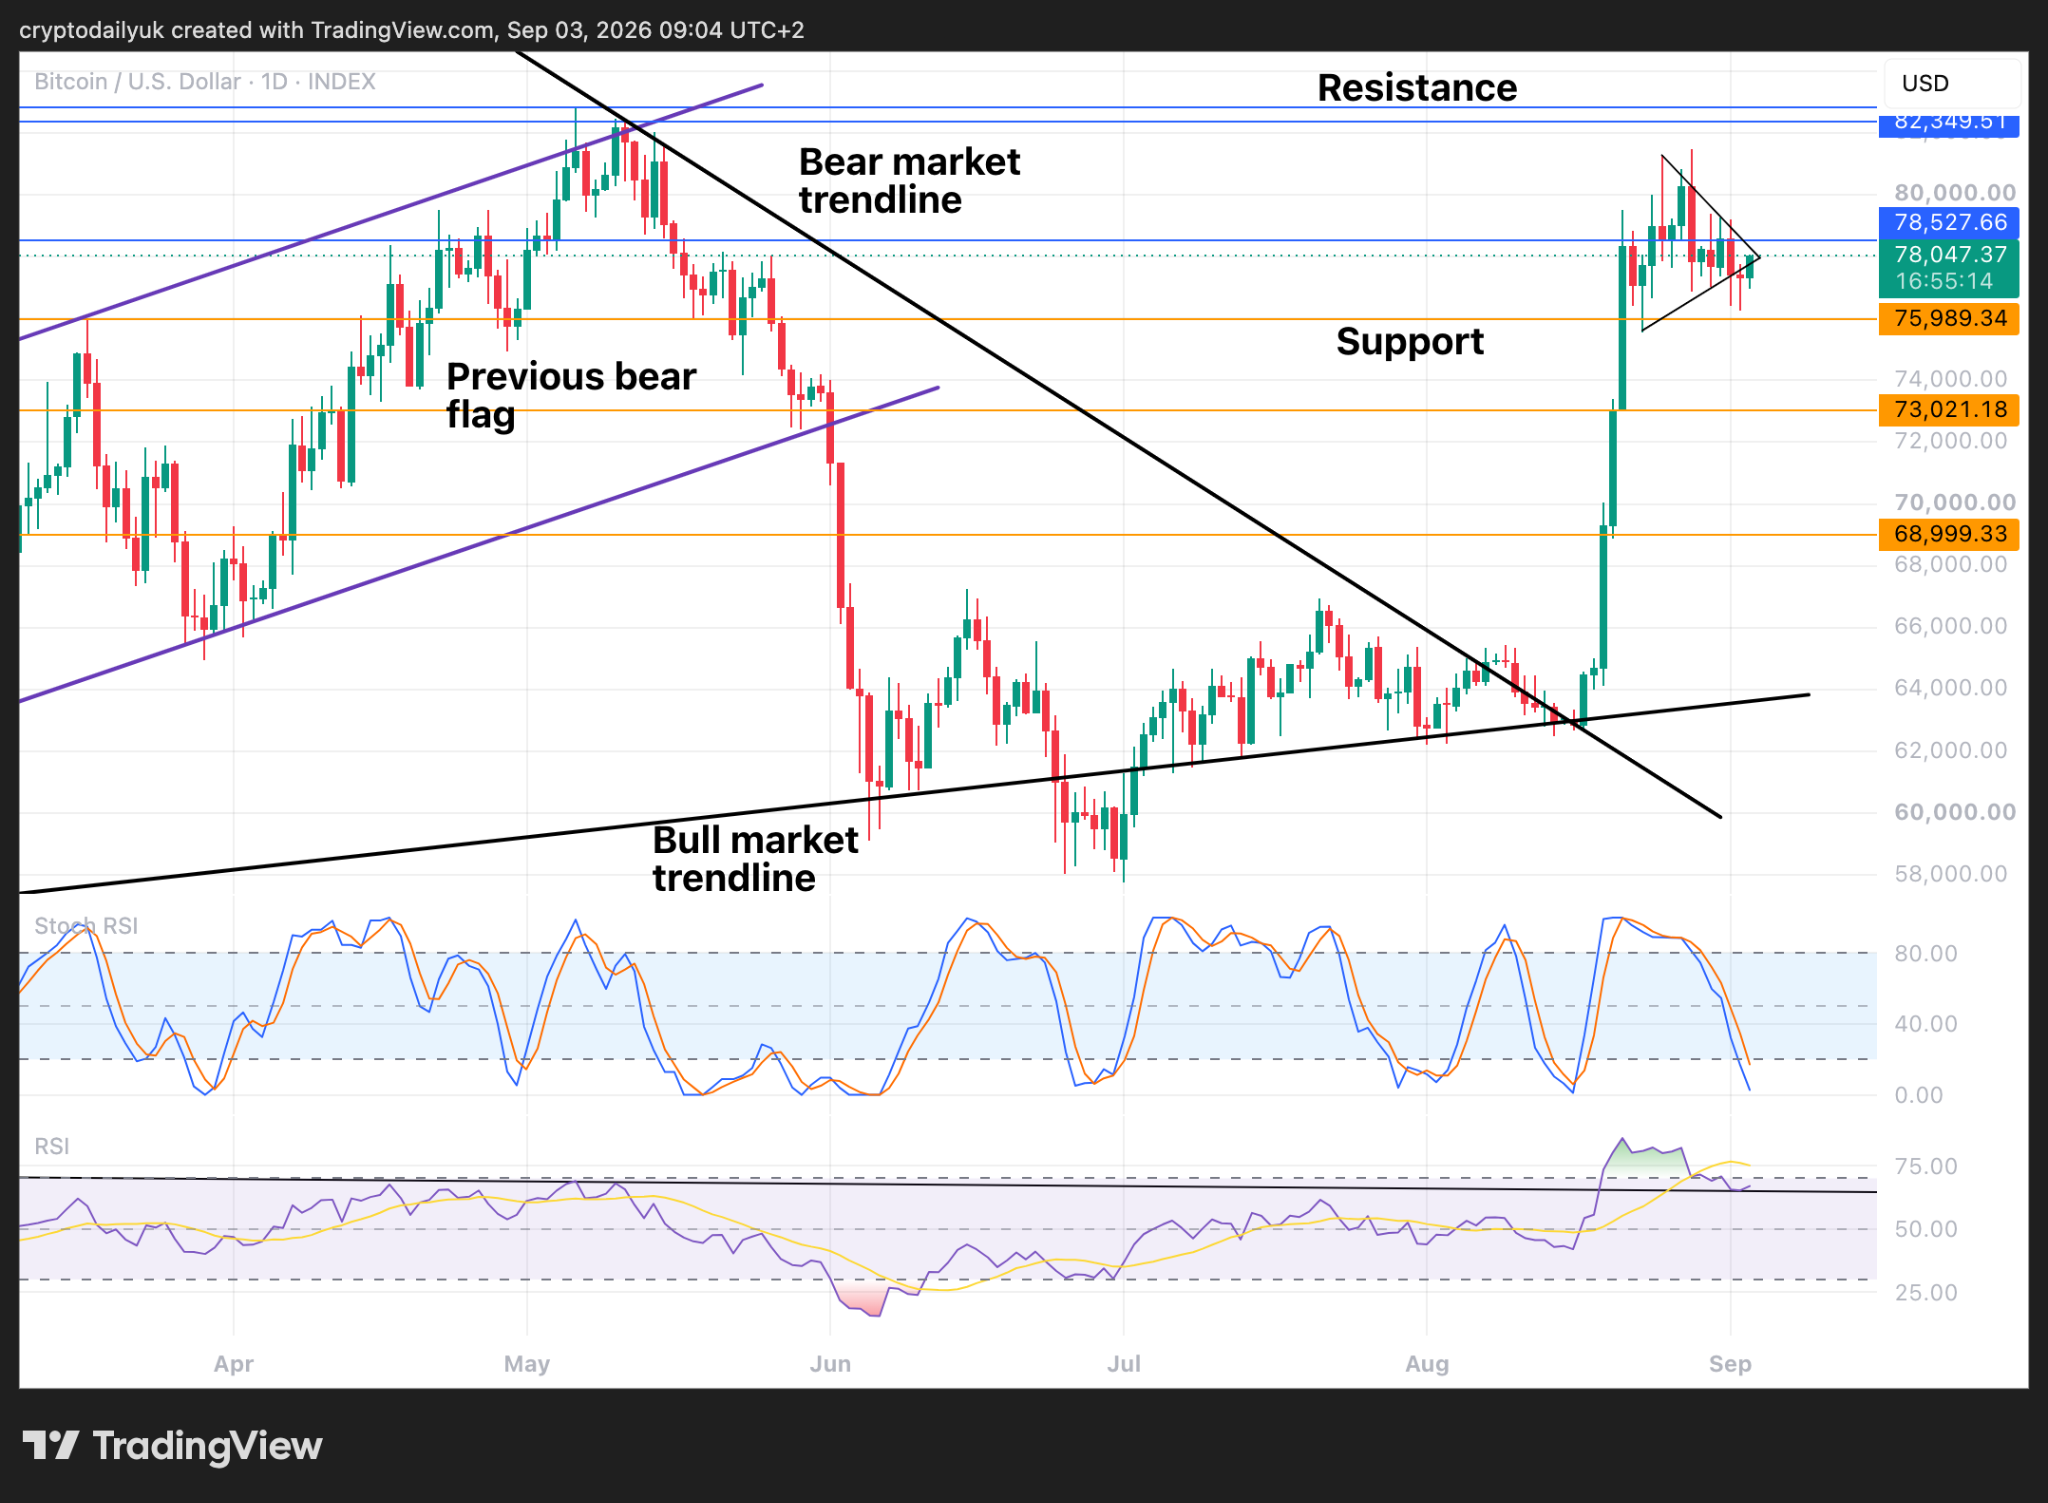
The daily time frame shows that the $BTC price is now thrusting strongly back inside the pennant formation. If it does break out to the upside it has the $79K horizontal resistance to deal with, but it would have the momentum from just having broken out of the pennant.
At the bottom of the chart, the Stochastic RSI indicator lines for the daily time frame are finally about to hit the bottom. That would be all the short to medium term time frame momentum indicators having reset. This could be what helps the $BTC price climb up to the key overhead resistance.
The daily RSI is also looking very good for supporting a continuation of the rally. The recent huge rally sent the indicator line up and through a descending trendline that stretches all the way back to November 2024. As can be noted, the indicator line has come back to test this trendline as support. A bounce would potentially signal the next leg up.
Can the bulls negate the shooting star candle?
Source: TradingView
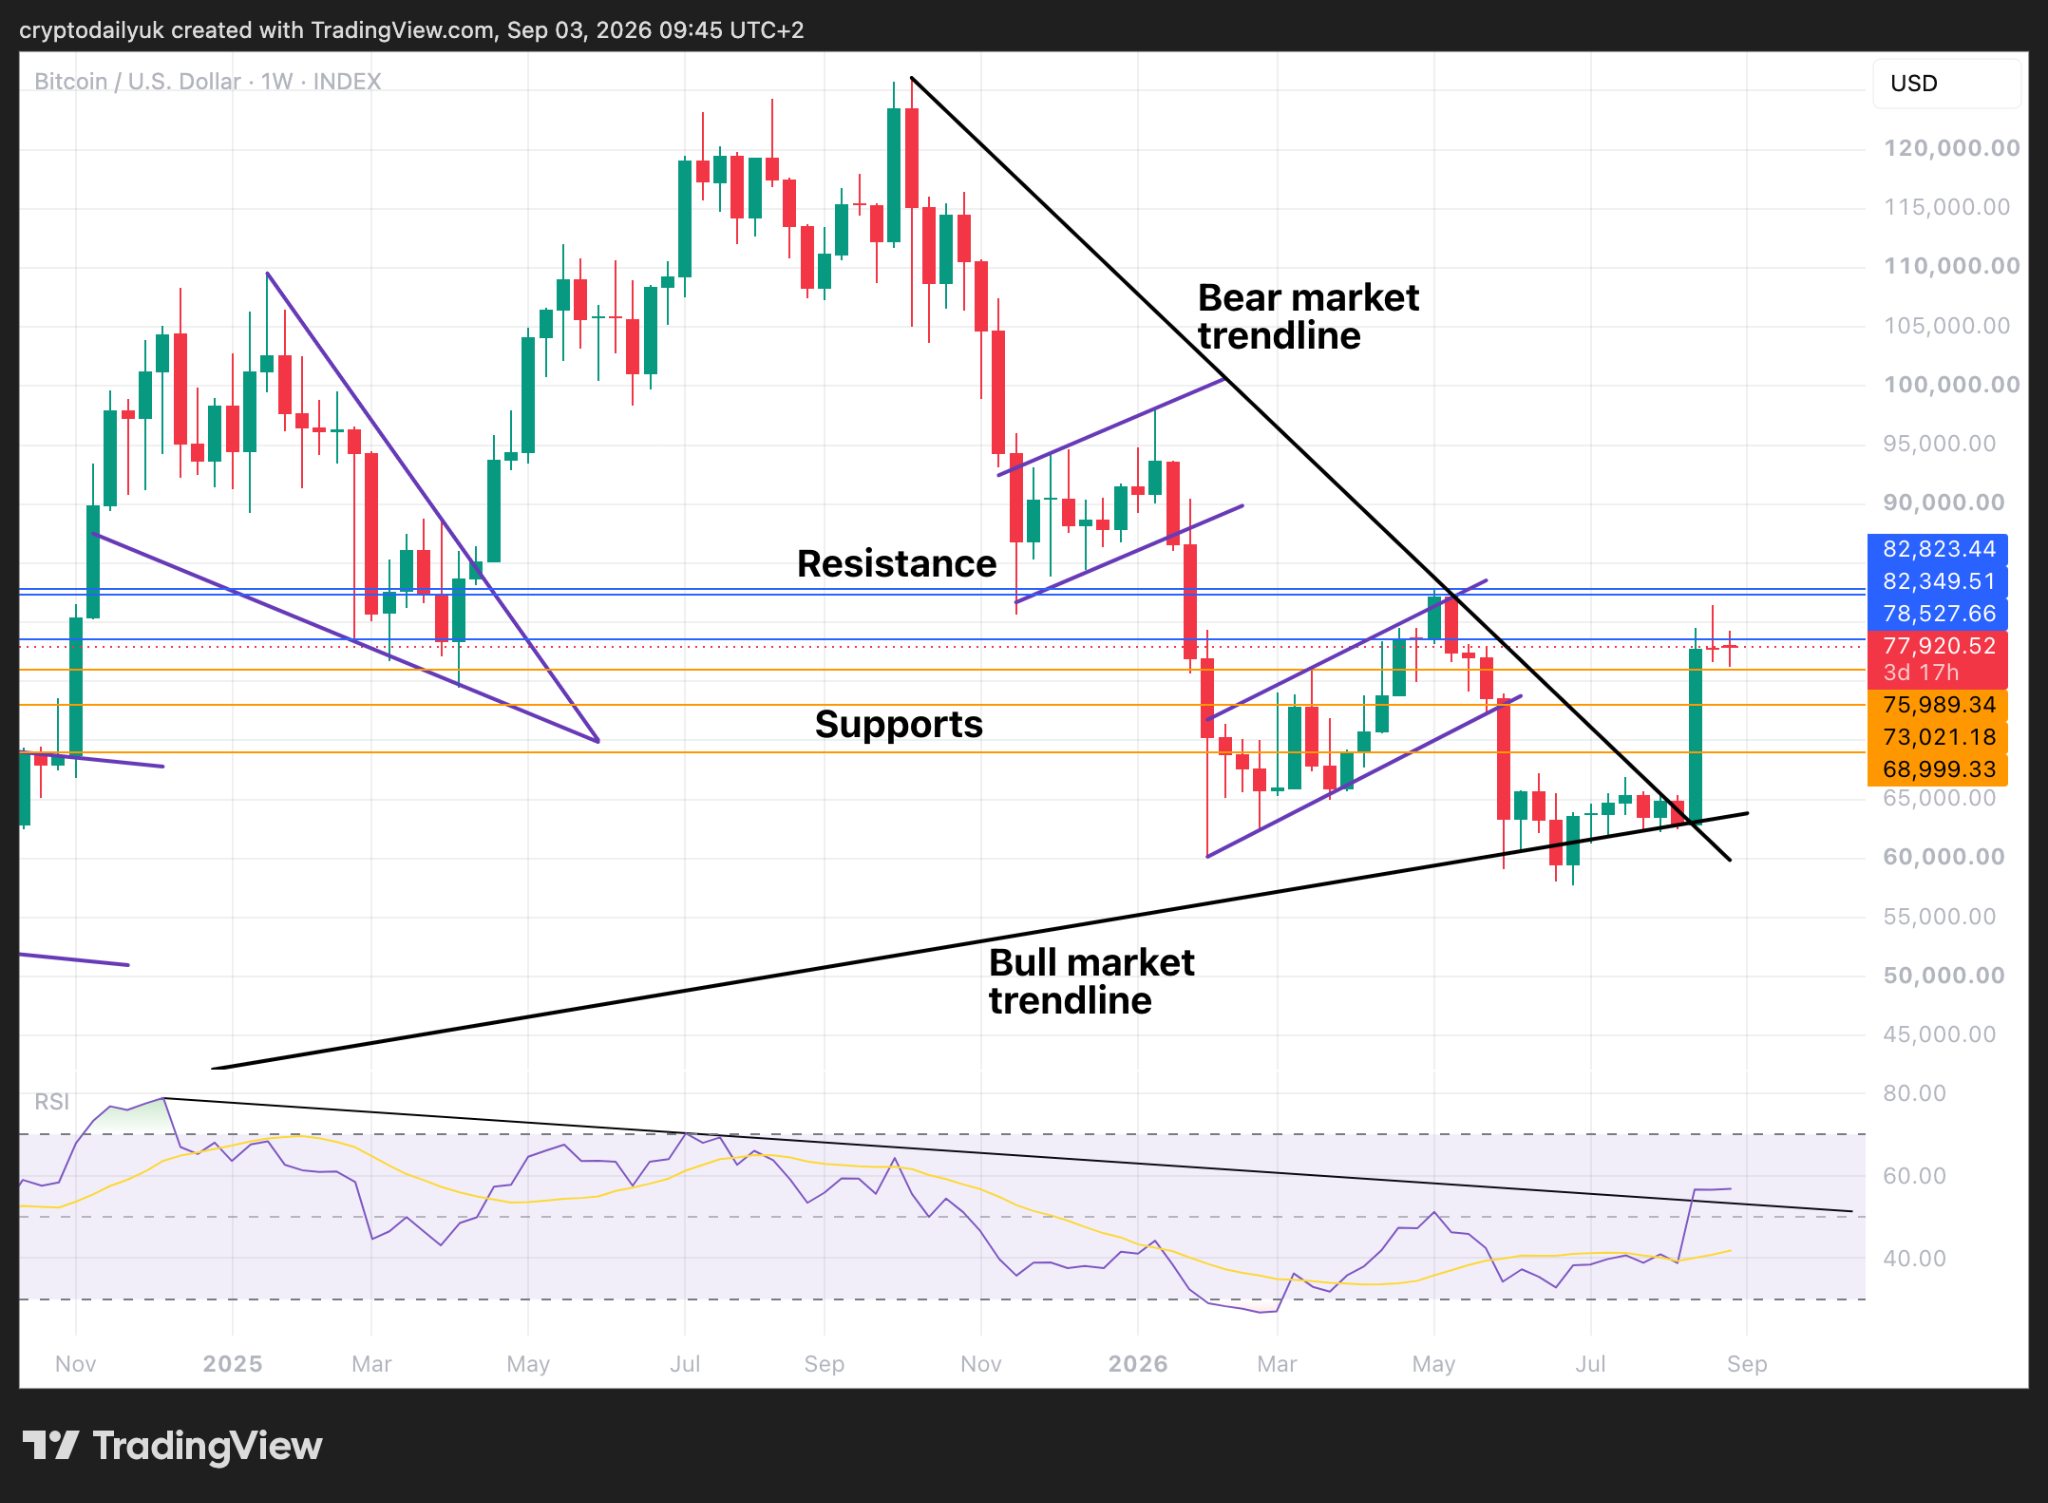
In the weekly time frame we can observe that a nasty looking candle is still sitting at the top of the towering green candle that came before it. This candle is a shooting star, although the body of the candle is very small. This kind of candle sometimes appears at the top of an uptrend and can signal that the previous bullish momentum is fading and that the bears could be about to take control. If the bullish momentum is to continue, the only way to try and negate this candle is if the price rises above the top of the upper wick.
Looking at the RSI in the weekly it can be observed that the indicator line has also pierced through a trendline in this high time frame. If the indicator line can hold above, this could provide the signal that the bulls could be about to nullify the shooting star candle. Much will depend on a breakout of the bull pennant and a possible surge up to the key resistance level.
Disclaimer: This article is provided for informational purposes only. It is not offered or intended to be used as legal, tax, investment, financial, or other advice.
Related Stories