Bitcoin Rallies Back: Breakdown Confirmation or Bulls Back in Control?
 Laurie Dunn

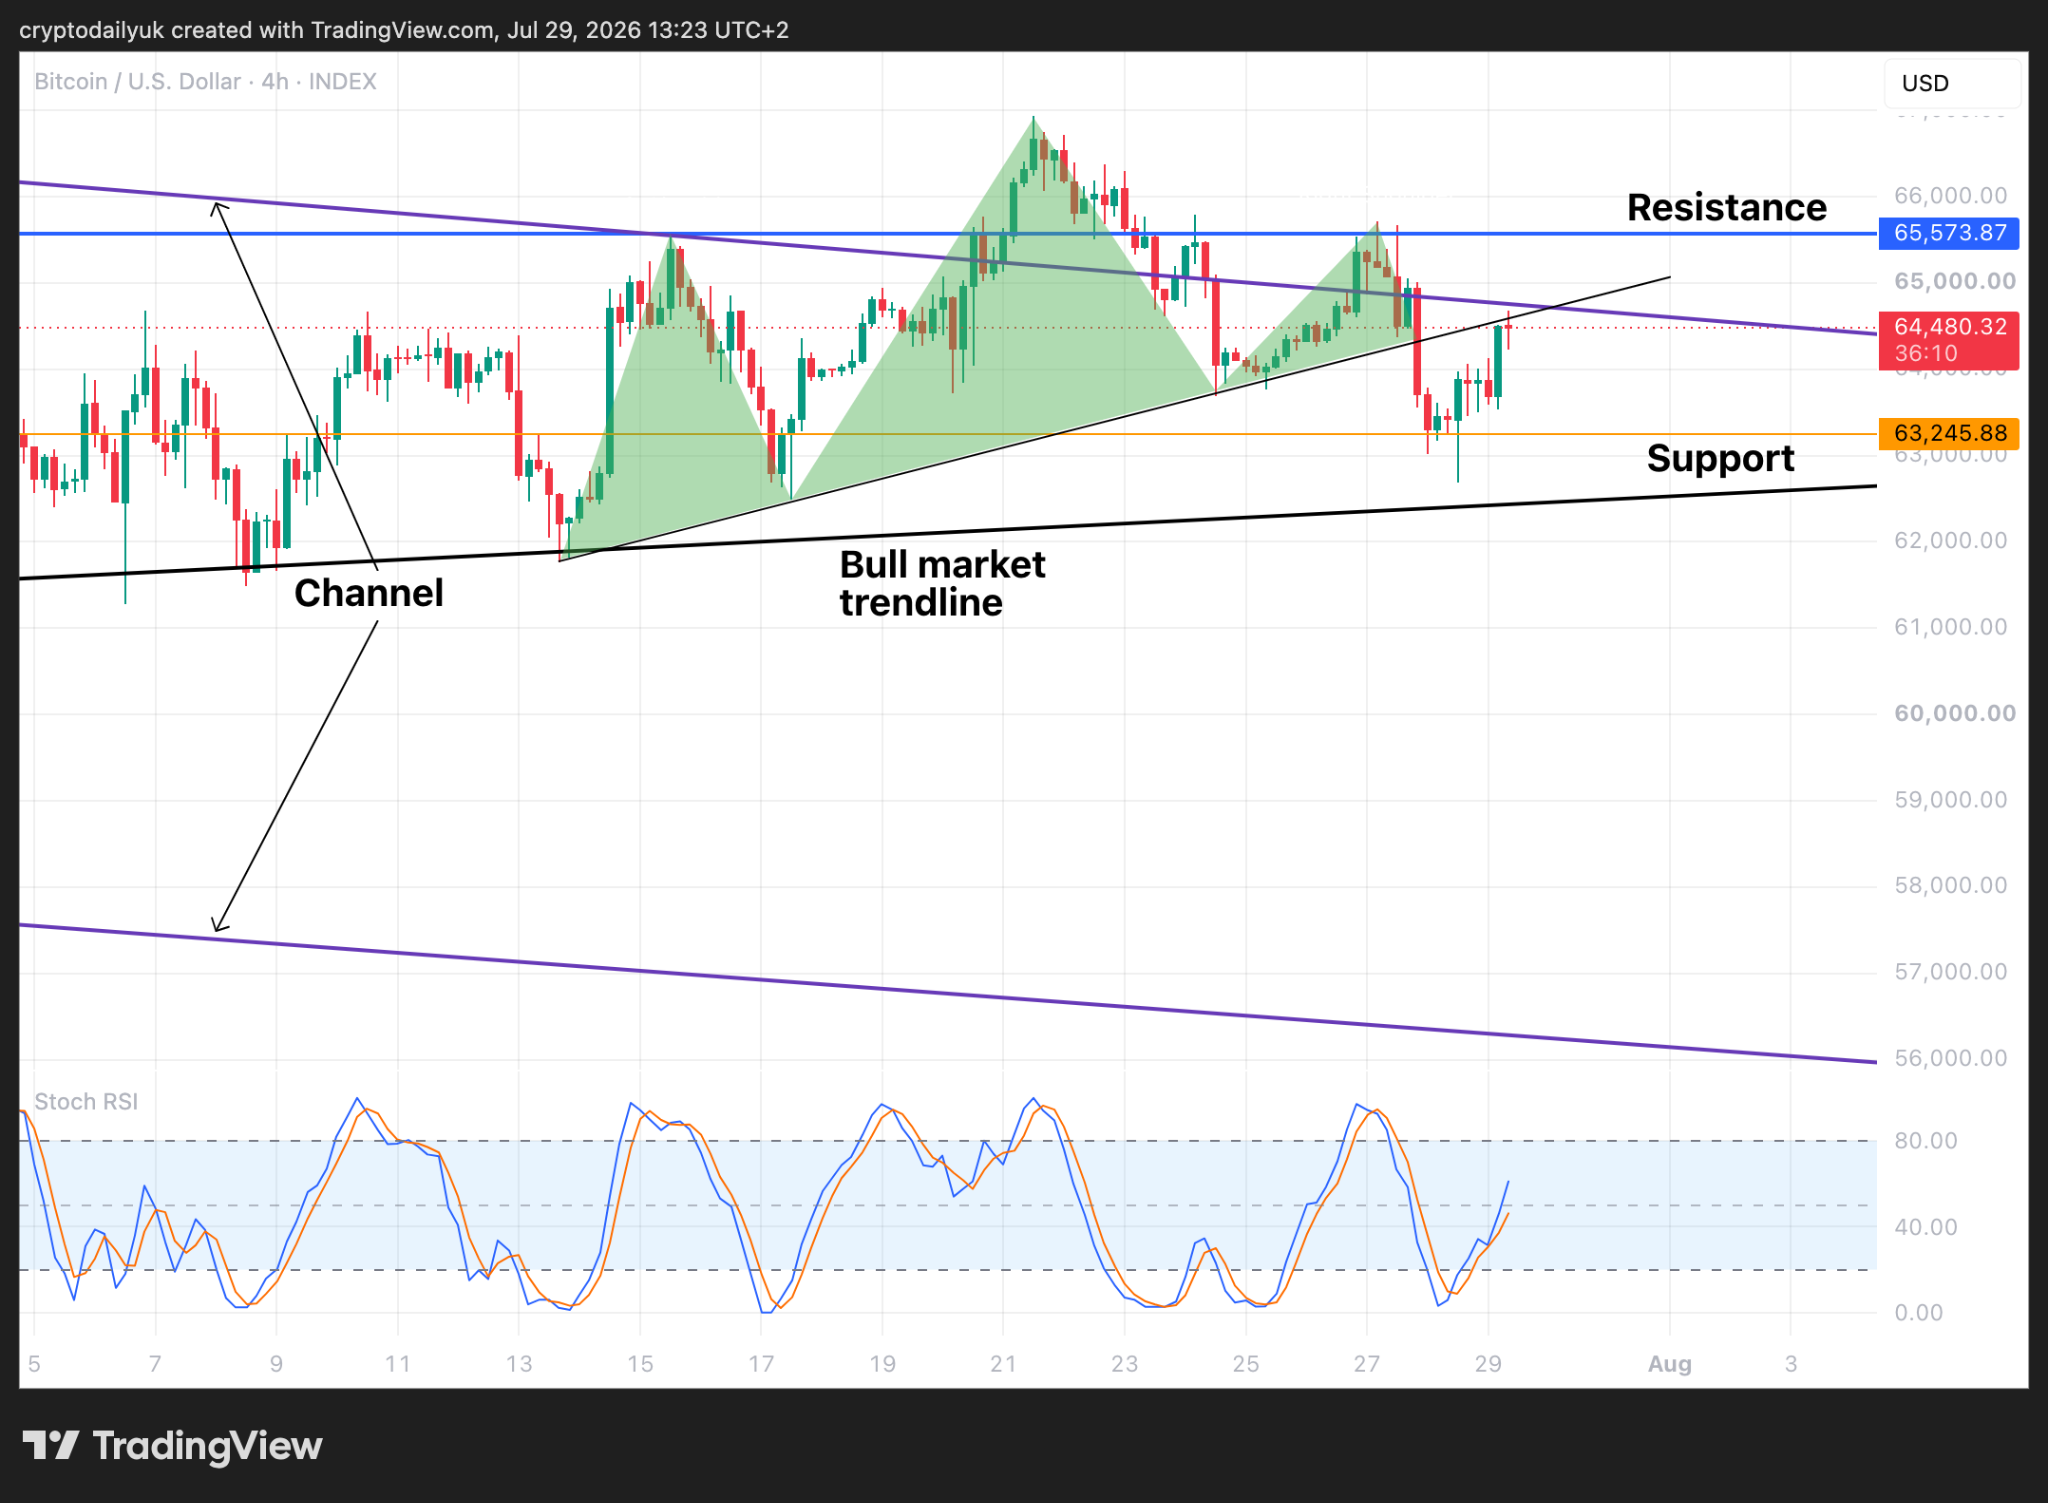
The Bitcoin price has come back to tag the neckline of a bearish head and shoulders pattern. Is this going to be a confirmation of the breakdown, or can the bulls negate the pattern and push the $BTC price back to the $66K horizontal resistance?
$BTC price returns to confirm head and shoulders pattern
Source: TradingView
The short-term time frame illustrates how the $BTC price has returned to the neckline of the head and shoulders pattern. As it stands, this is quite ominous. A rejection and a confirmation of the pattern looks to be the most probable outcome. If this is the case, the full measured move down would be to around $60K, which would be well below the bull market trendline and would potentially see the price carry on down to the bottom of the channel at least.
On the more optimistic side of things, previous head and shoulders patterns have failed to play out. Also, the short-term Stochastic RSI indicators are moving up, signalling upside price momentum. Will it be enough?
No major price correction yet is bullish for Bitcoin
Source: TradingView
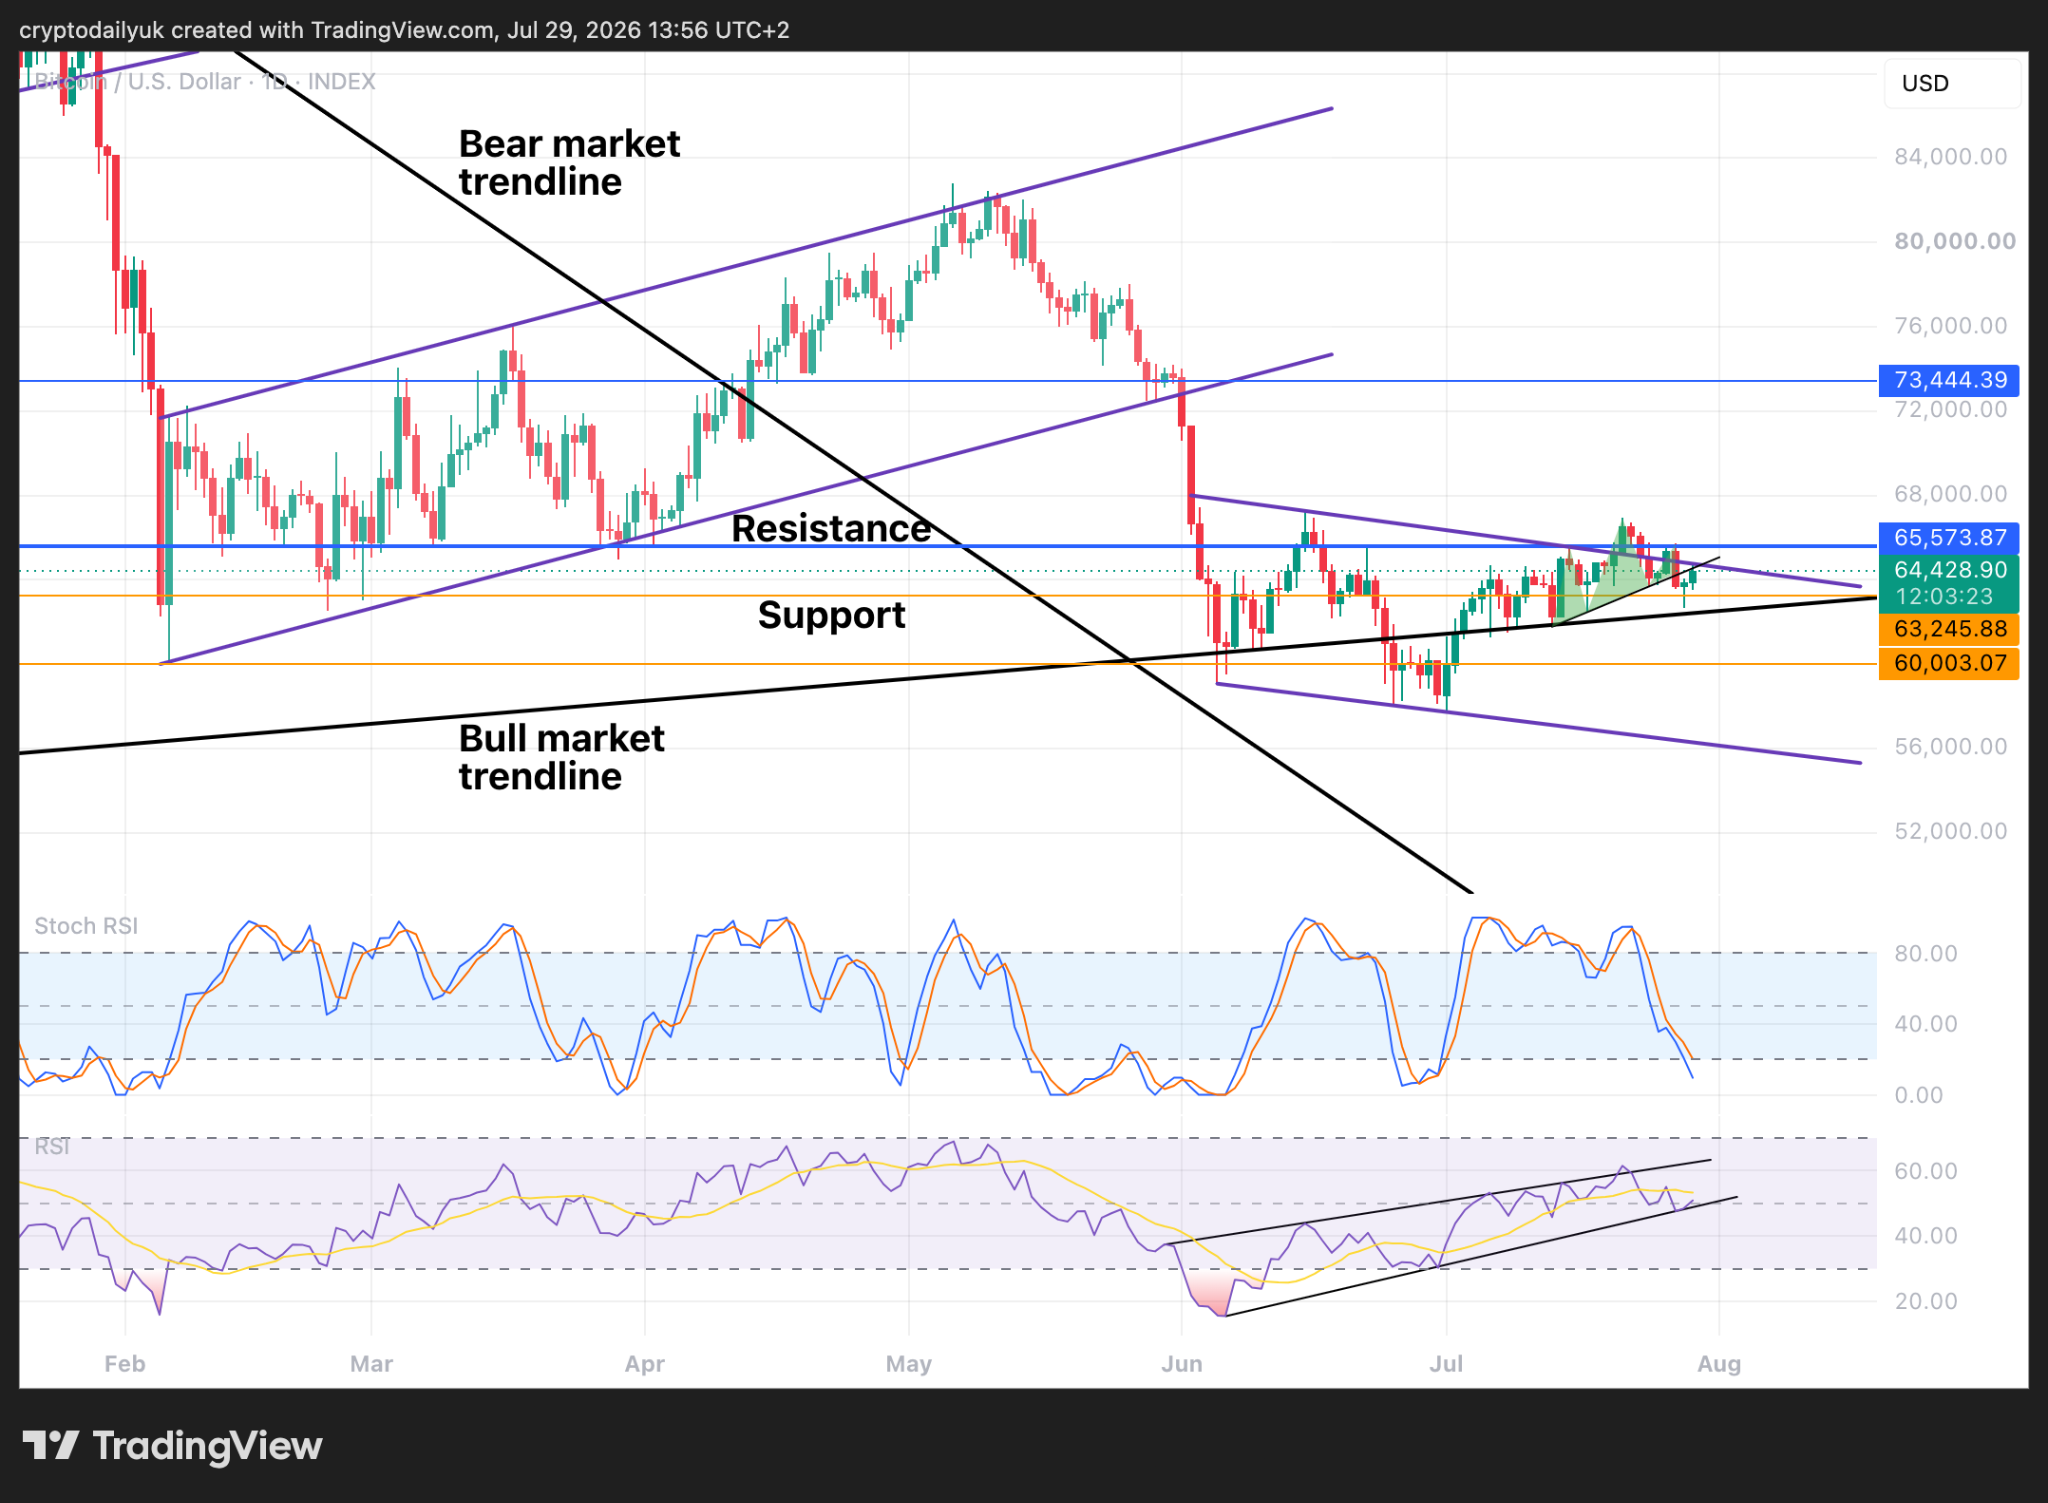
The daily time frame shows the horizontal support level at $60K should the $BTC price go down there. This corresponds to the bottom of the crash out of the bear flag, so would be a good place to reevaluate things.
While the shorter term momentum indicators rise from the bottom of their range, the daily Stochastic RSI indicators are reaching their bottom. This is quite bullish, given that the down leg for these indicators did not result in hardly any corrective price movement at all. Instead, the price action has gone sideways.
The wedge pattern in the RSI sees change once again as the indicator line manages to avoid falling through the bottom. If the bottom trendline can hold a while longer, a bounce from this lower edge of the wedge could correspond with a rally in the price action.
Bottoming pattern rather than last big crash?
Source: TradingView
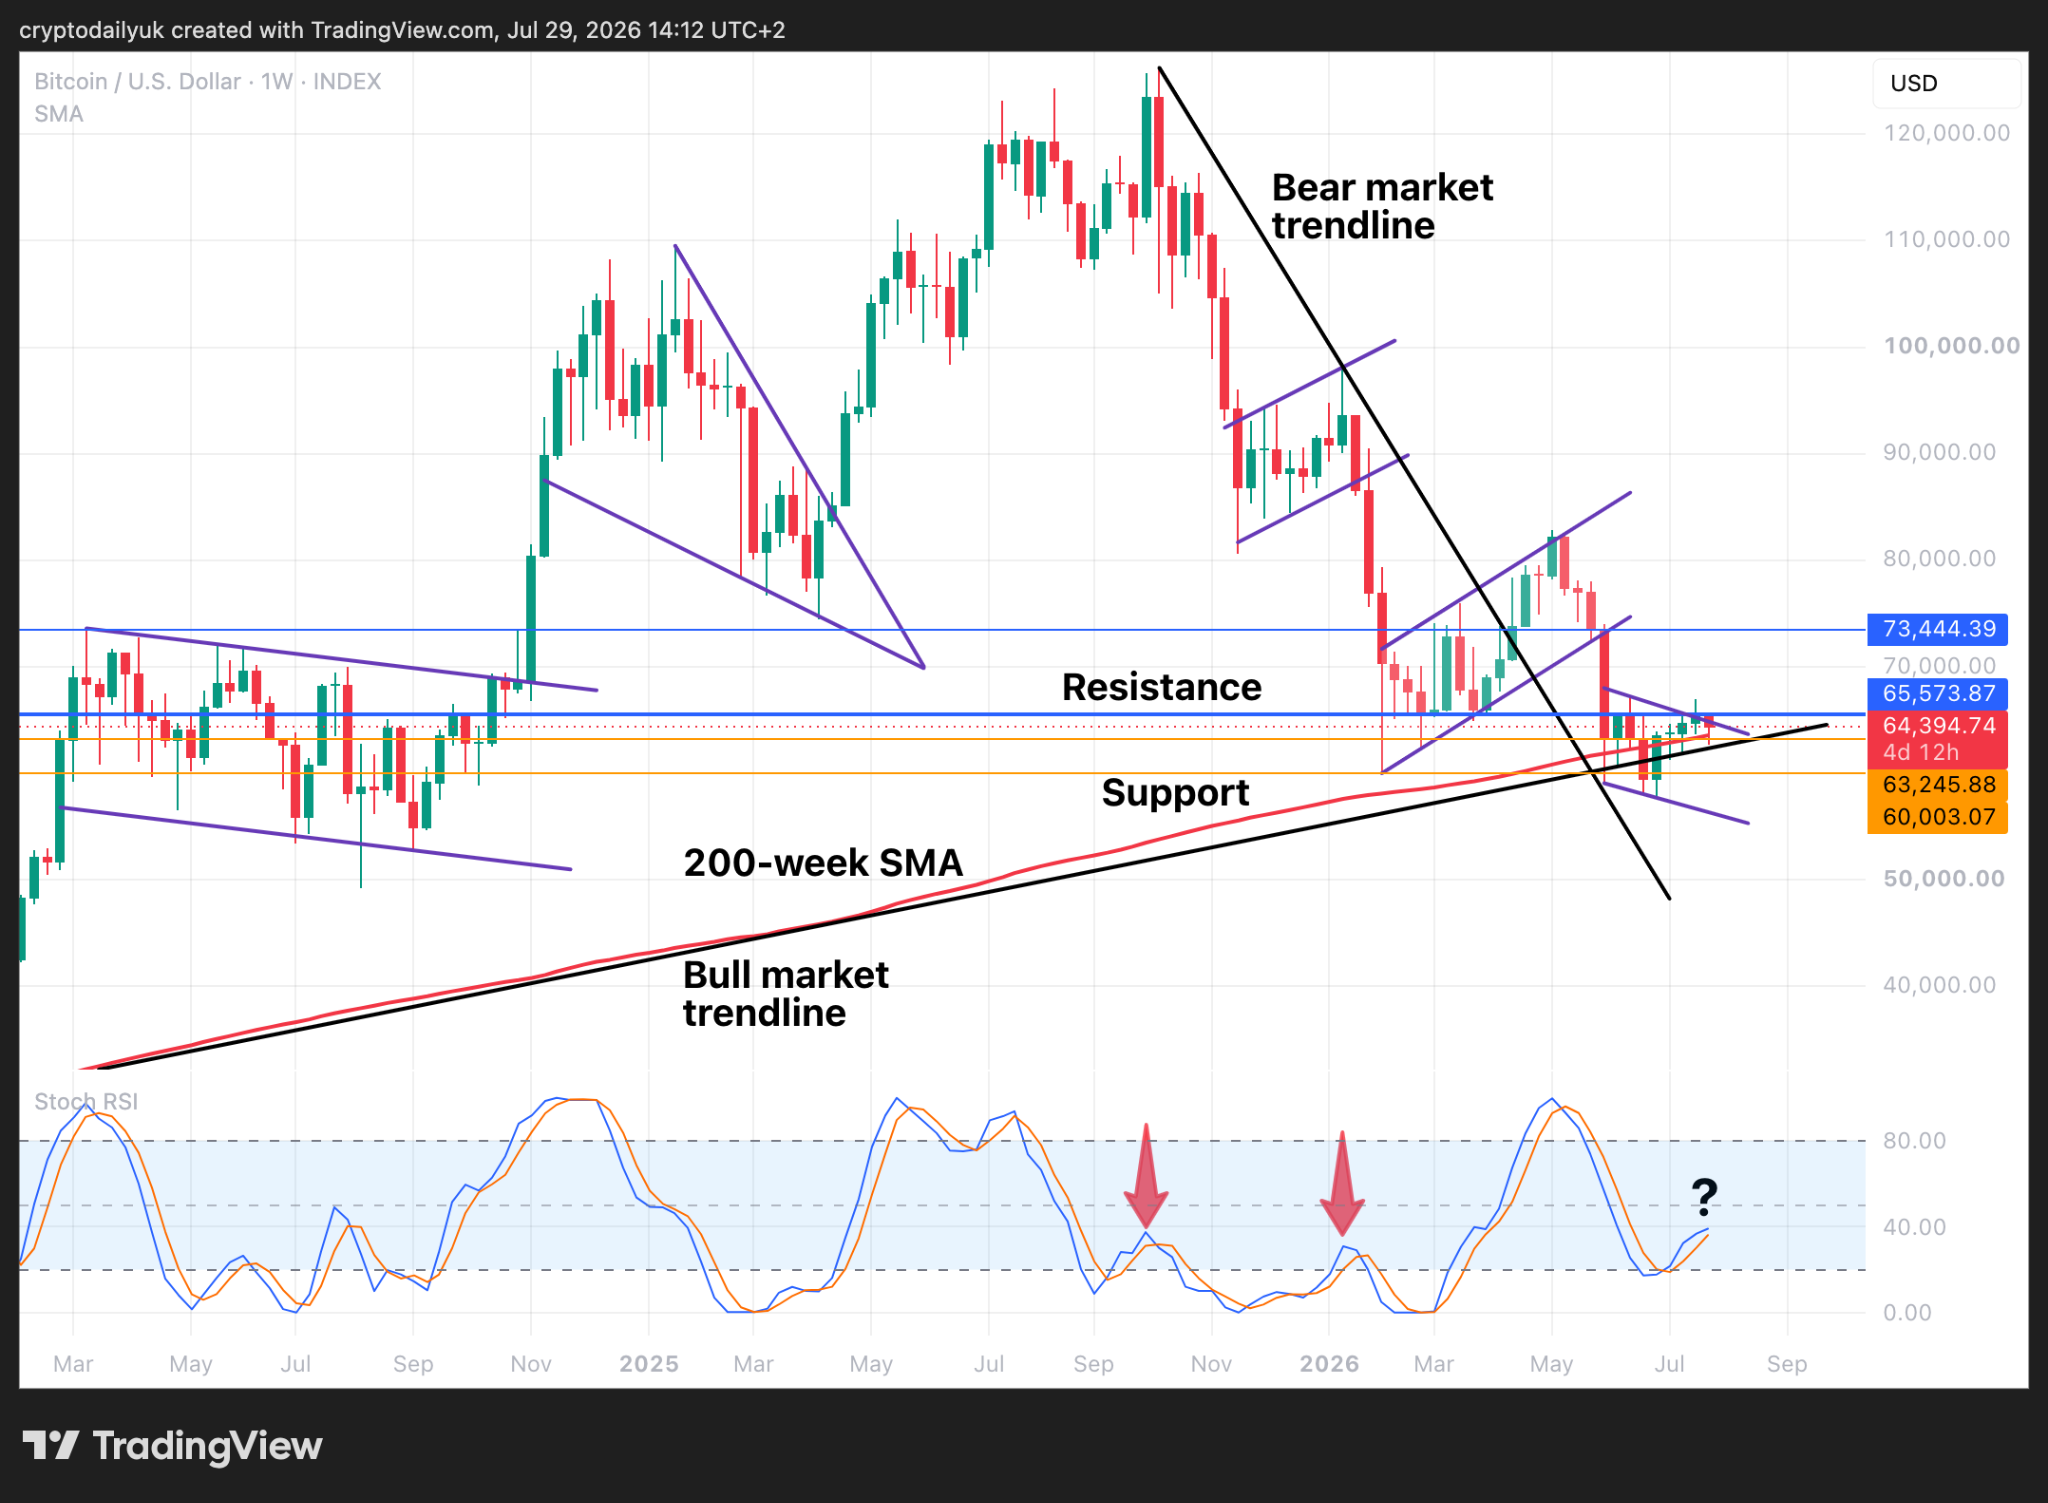
The weekly chart still remains in the balance, as it has done for the last few weeks. The bear market cross-downs in the Stochastic RSI for this time frame are highlighted with the red arrows. The resulting amount of damage to the $BTC price can be seen in the huge bearish corrections that corresponded above.
If the Stochastic RSI indicator lines cross down from here, which would be at a similar level, a last crash into the dying embers of this bear market could ensue.
In the favour of the bulls is that the current big pattern is a descending channel rather than a bear flag. The probabilities are that this is a bottoming pattern and that the $BTC price will eventually emerge from the top of this channel. Keep an eye on the Stochastic RSI indicator lines at the end of the week.
Disclaimer: This article is provided for informational purposes only. It is not offered or intended to be used as legal, tax, investment, financial, or other advice.
Related Stories