Bitcoin Price Survives $61K Dump: $64K Resistance Holds
 Laurie Dunn

Carrying on from Sunday’s retracement, the BTC price slid further on Monday and then dumped quickly, almost reaching $61K. However, as soon as it hit this point, also coming down below the bull market trendline, buyers stepped in and the price was bought up even quicker than it came down. What could be next?
Flash crash quickly bought up
Source: TradingView
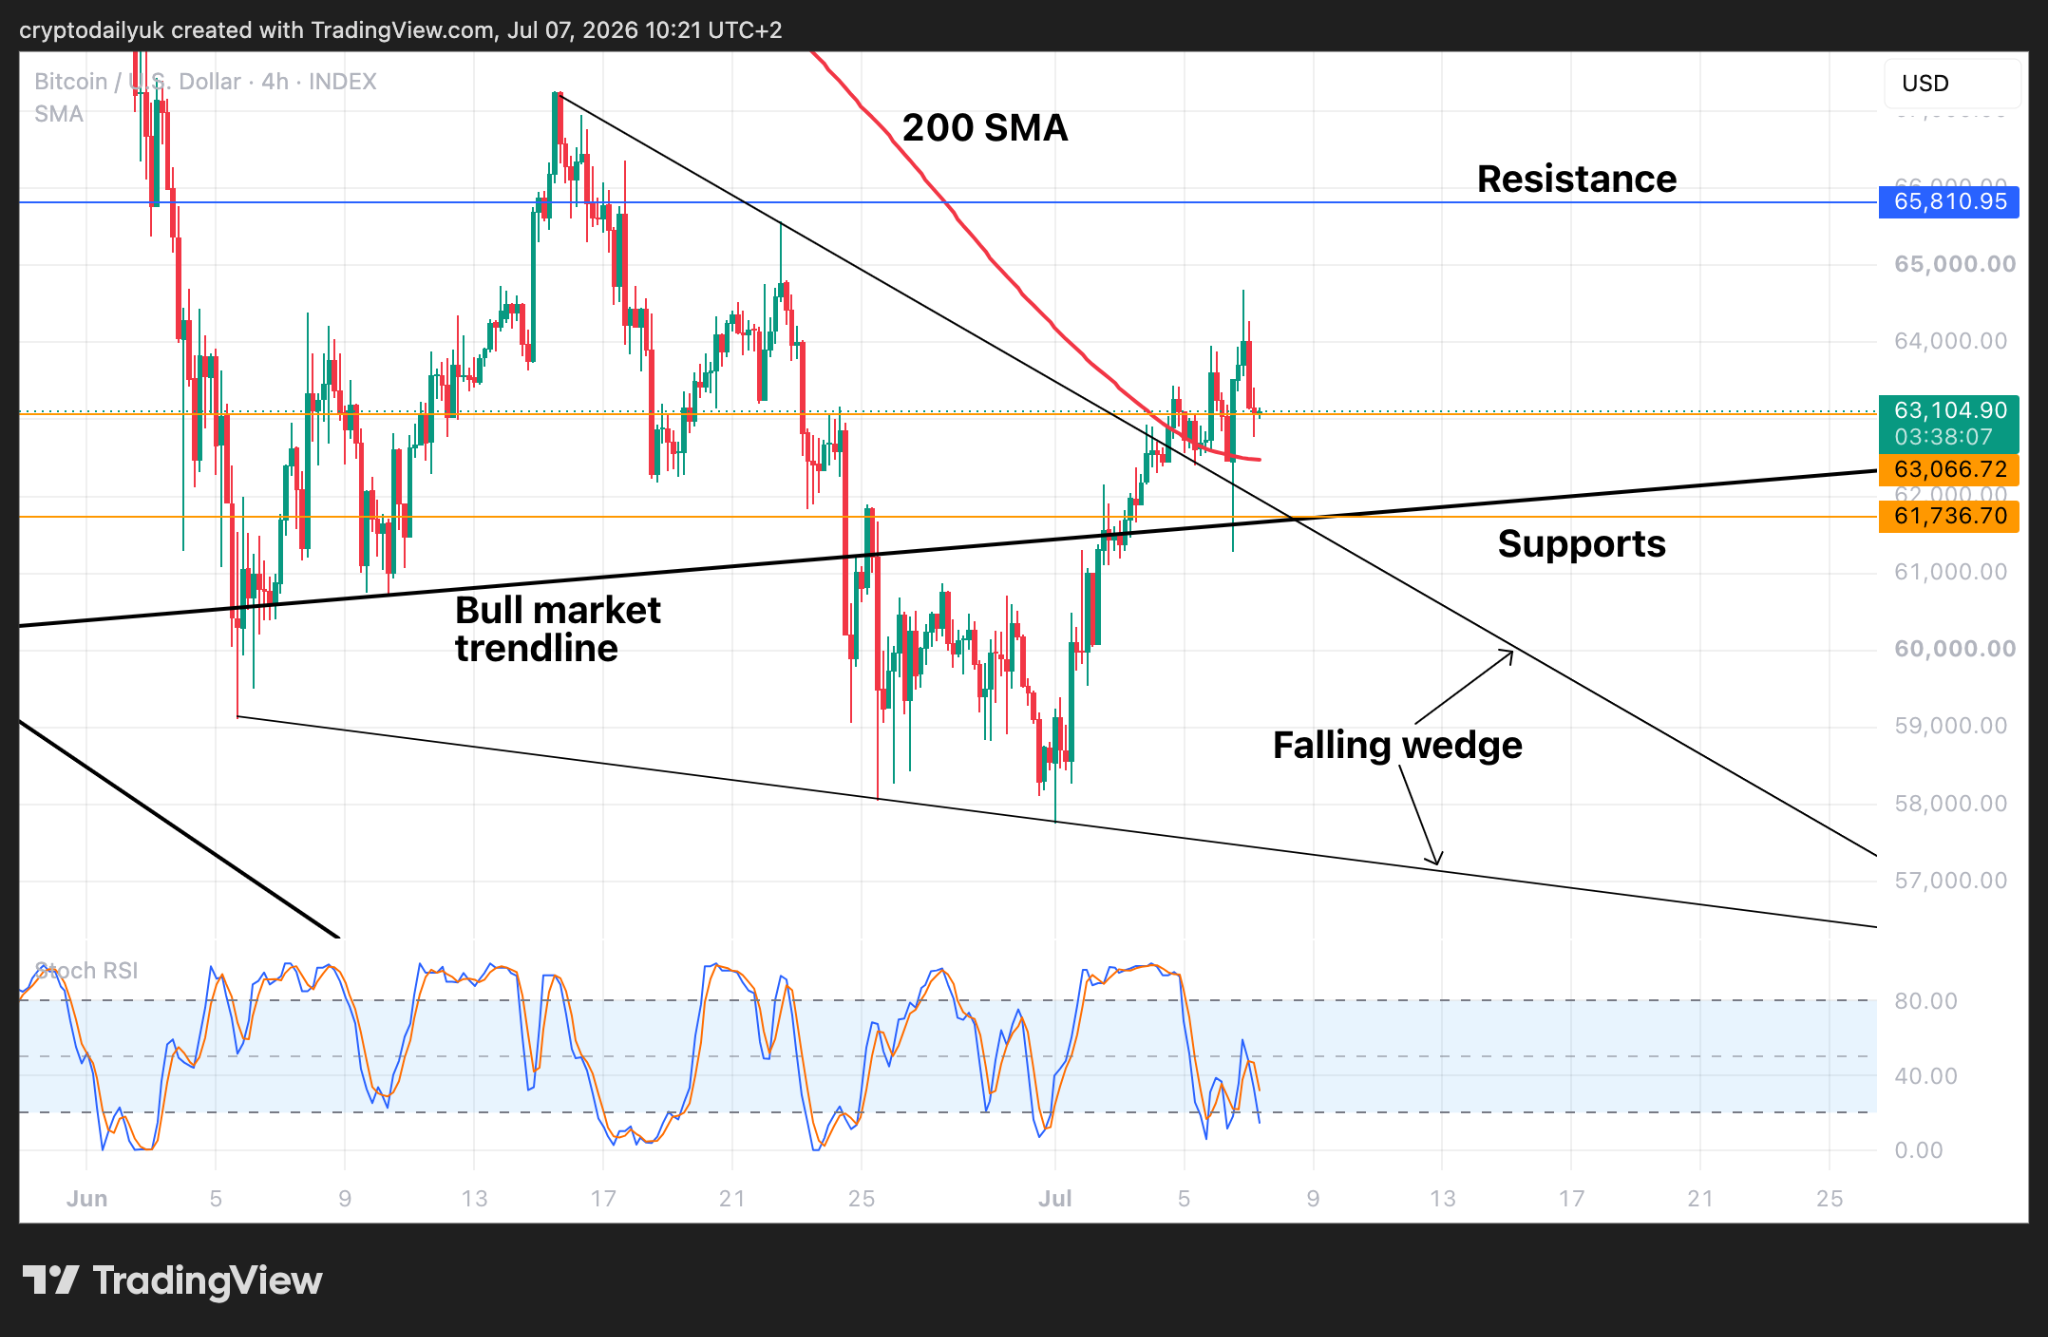
The 4-hour time frame chart shows us that the $BTC price broke out from the falling wedge, confirmed the breakout, and moved higher. It was at the point that a correction was expected, that a flash crash occurred, taking the price back into the wedge and below the bull market trendline. However, as can be seen, the crash was very short-lived. Buyers stepped in and the price was rapidly bought back up to the 200 SMA from where it rose higher.
The small crash left a substantial candle tail behind, and if one looks left at the other times the price came down to a bottom, in a similar way, fairly long candle tails were left to the downside, and were generally followed by price rises. Could this be a sign that this current rally is not over?
$66K next?
Source: TradingView
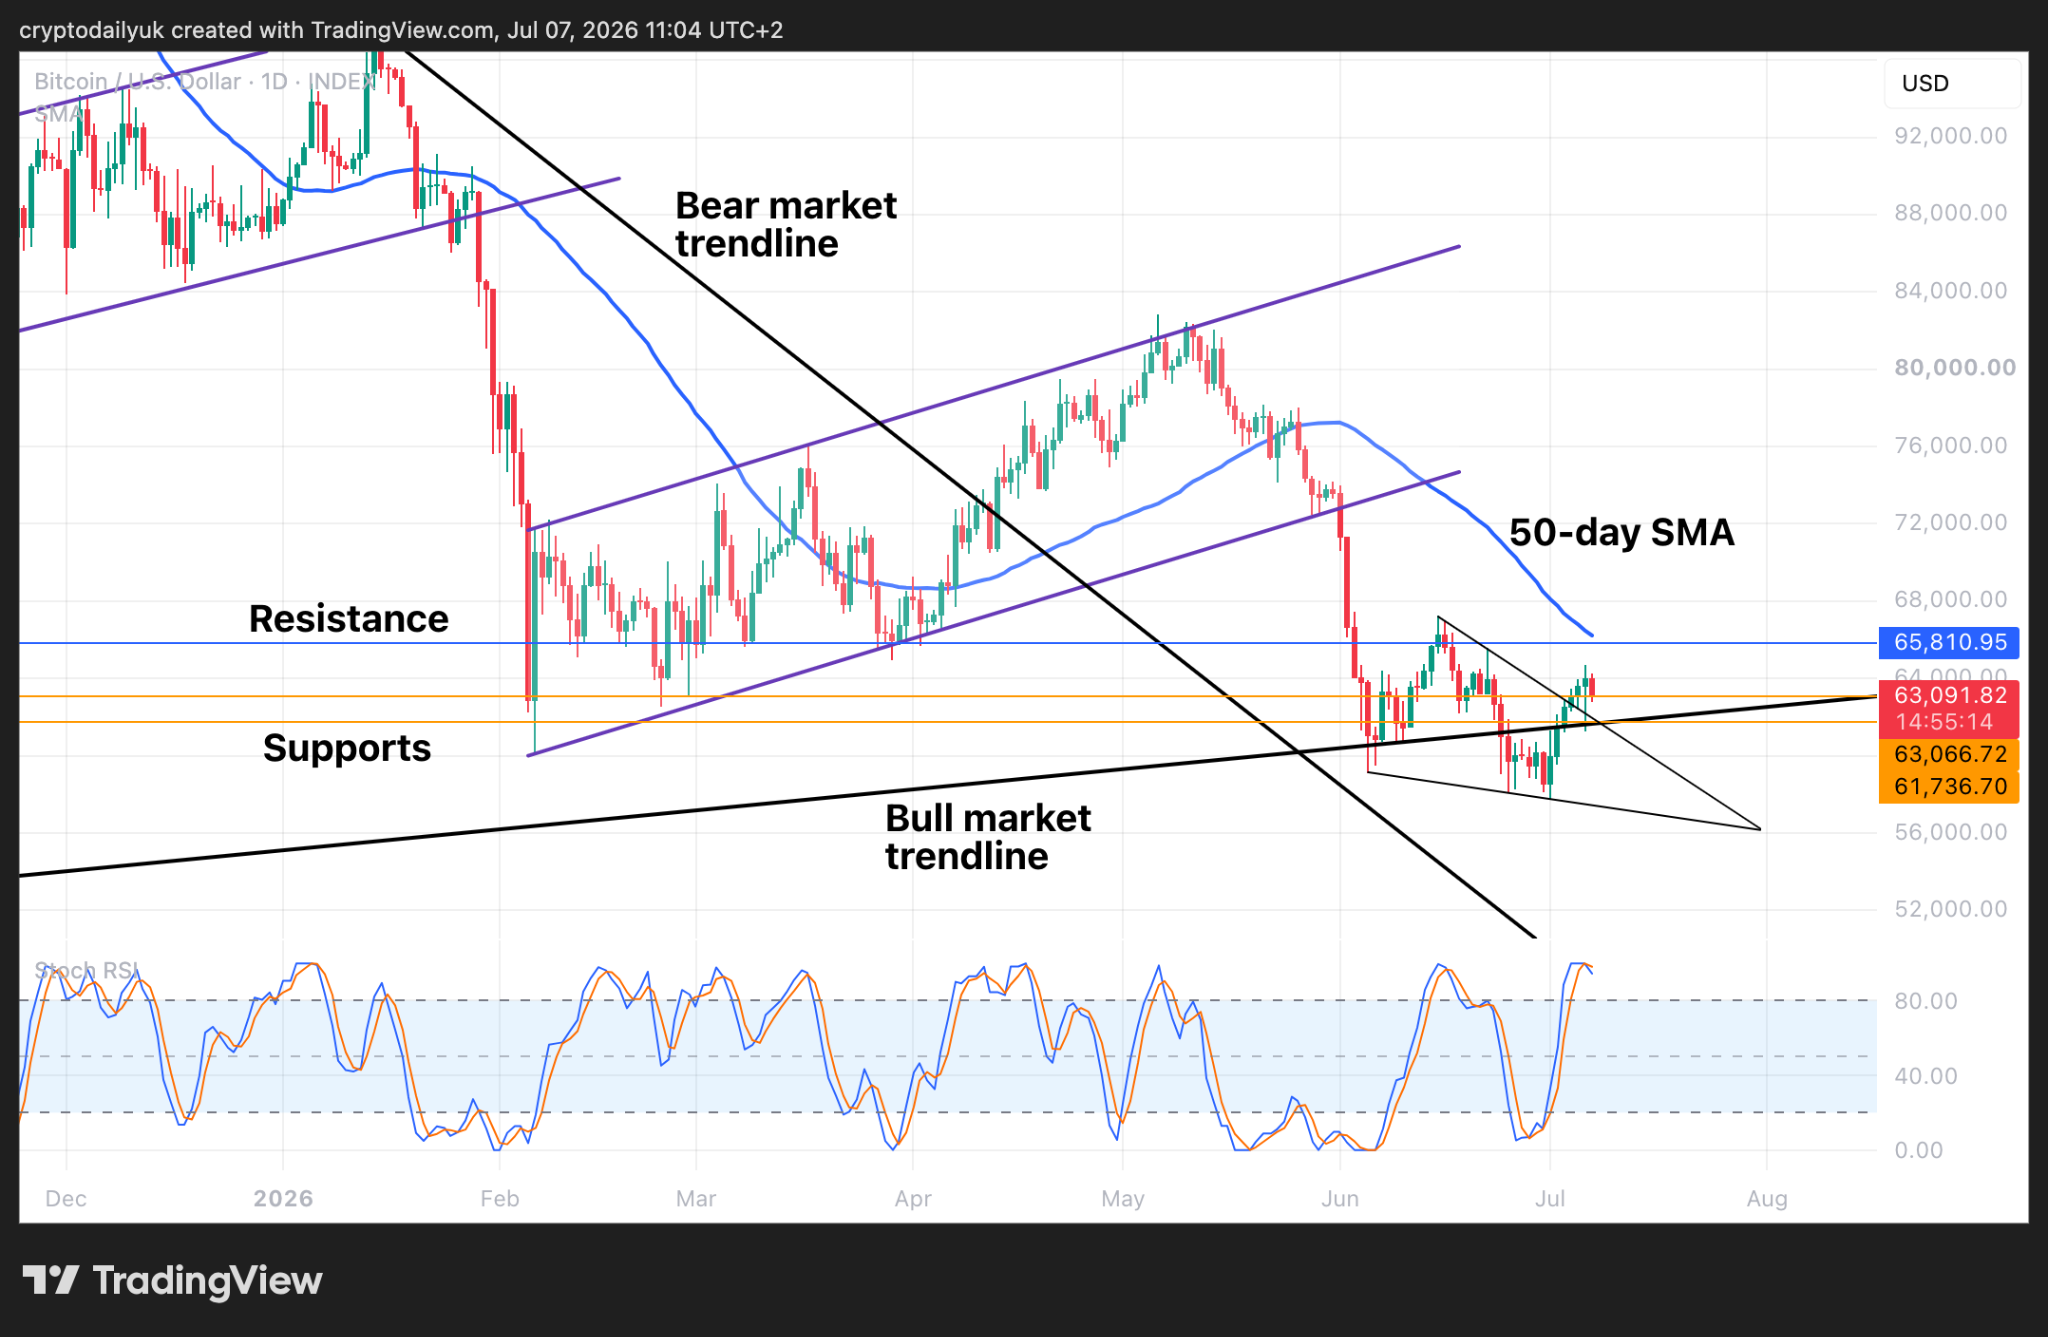
Stepping back out to the daily time frame and looking left, one can see that the current $63,000 support is a good one. If the bulls can hold strong here, a continuance of the rally up to the key $66,000 resistance level could be next. The 50-day SMA is also forming resistance at that level.
Other than that, it could be that the price chops around between the bull market trendline and that big resistance. It then remains to be seen if the $BTC price will break up or back down again.
As with the daily Stochastic RSI, the other shorter term Stochastic RSI indicators are making their way down. This would perhaps suggest that the price might lack the momentum to break out, at least for the next few days.
$BTC price on the verge of a big rally?
Source: TradingView
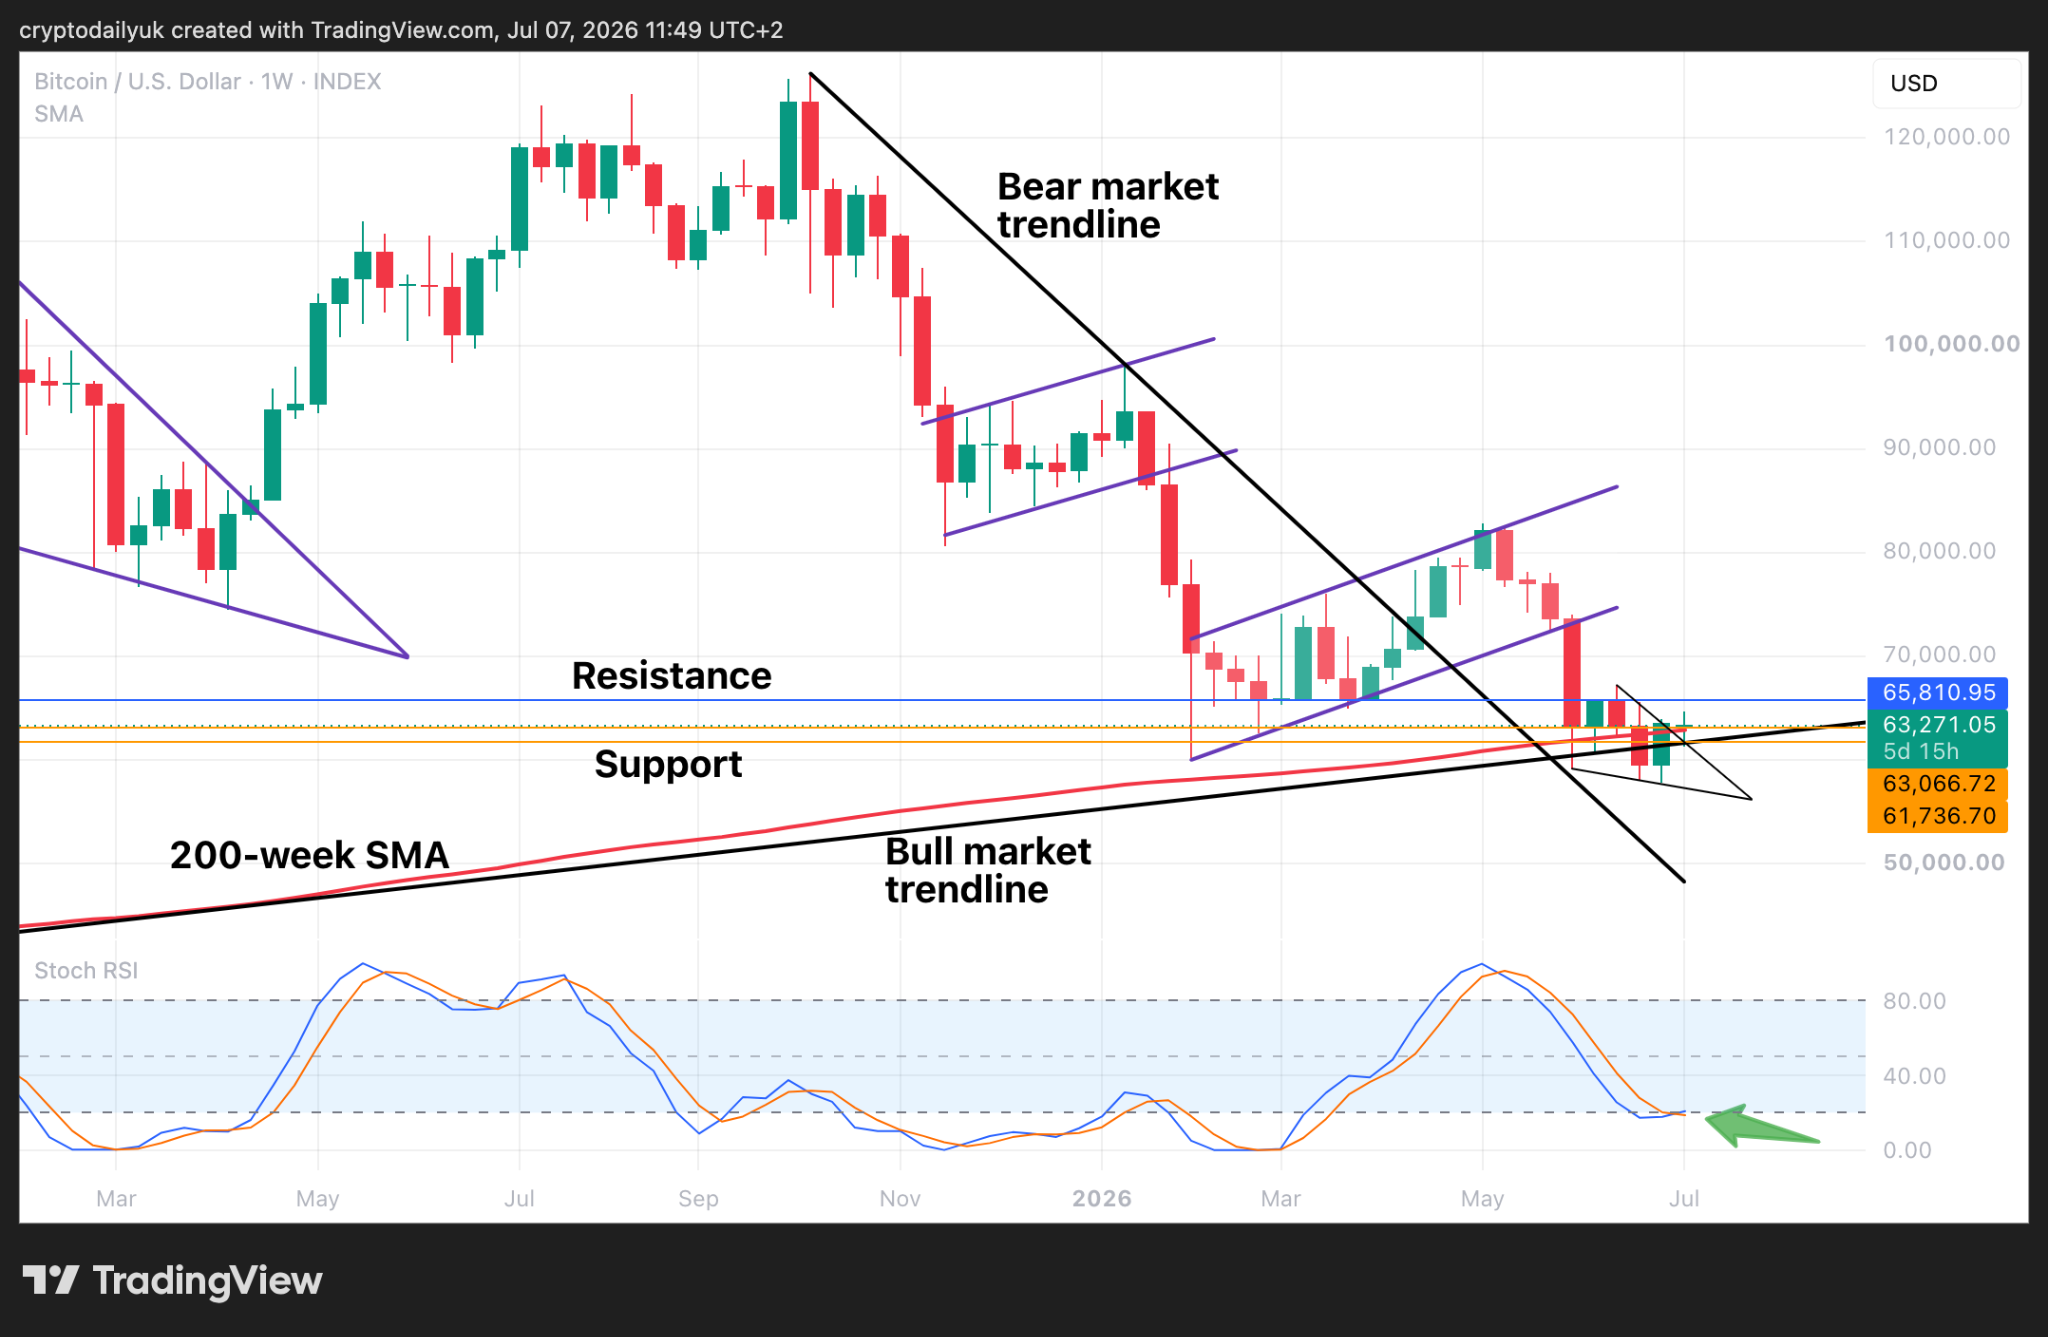
According to the weekly chart, the $BTC price could be on the verge of a rally, and it could be a big one. All that needs to happen is for the bulls to take charge here and push the price up above the $66K horizontal level and confirm this as support.
The bull market trendline is still intact, given that no weekly candle body closed beneath. The 200-week SMA is in a similar position. Therefore this could be the strong base that the bulls will need from which to launch a successful rally.
At the bottom of the chart, the Stochastic RSI indicators are looking to cross up. If the bulls can do their part, the indicators can signal the price momentum to get behind a big rally. Then again, the bears may have other ideas…
Disclaimer: This article is provided for informational purposes only. It is not offered or intended to be used as legal, tax, investment, financial, or other advice.
Related Stories