Bitcoin Correction Begins: Will $BTC Drop to $57K or Hold Bull Trendline Support?
 Laurie Dunn

After being rejected from the key $66K horizontal resistance level, the $BTC price is in a corrective phase. The question now is whether the bull market trendline will hold, or if the price will fall through to much lower levels?
Falling wedge becomes descending channel
Source: TradingView
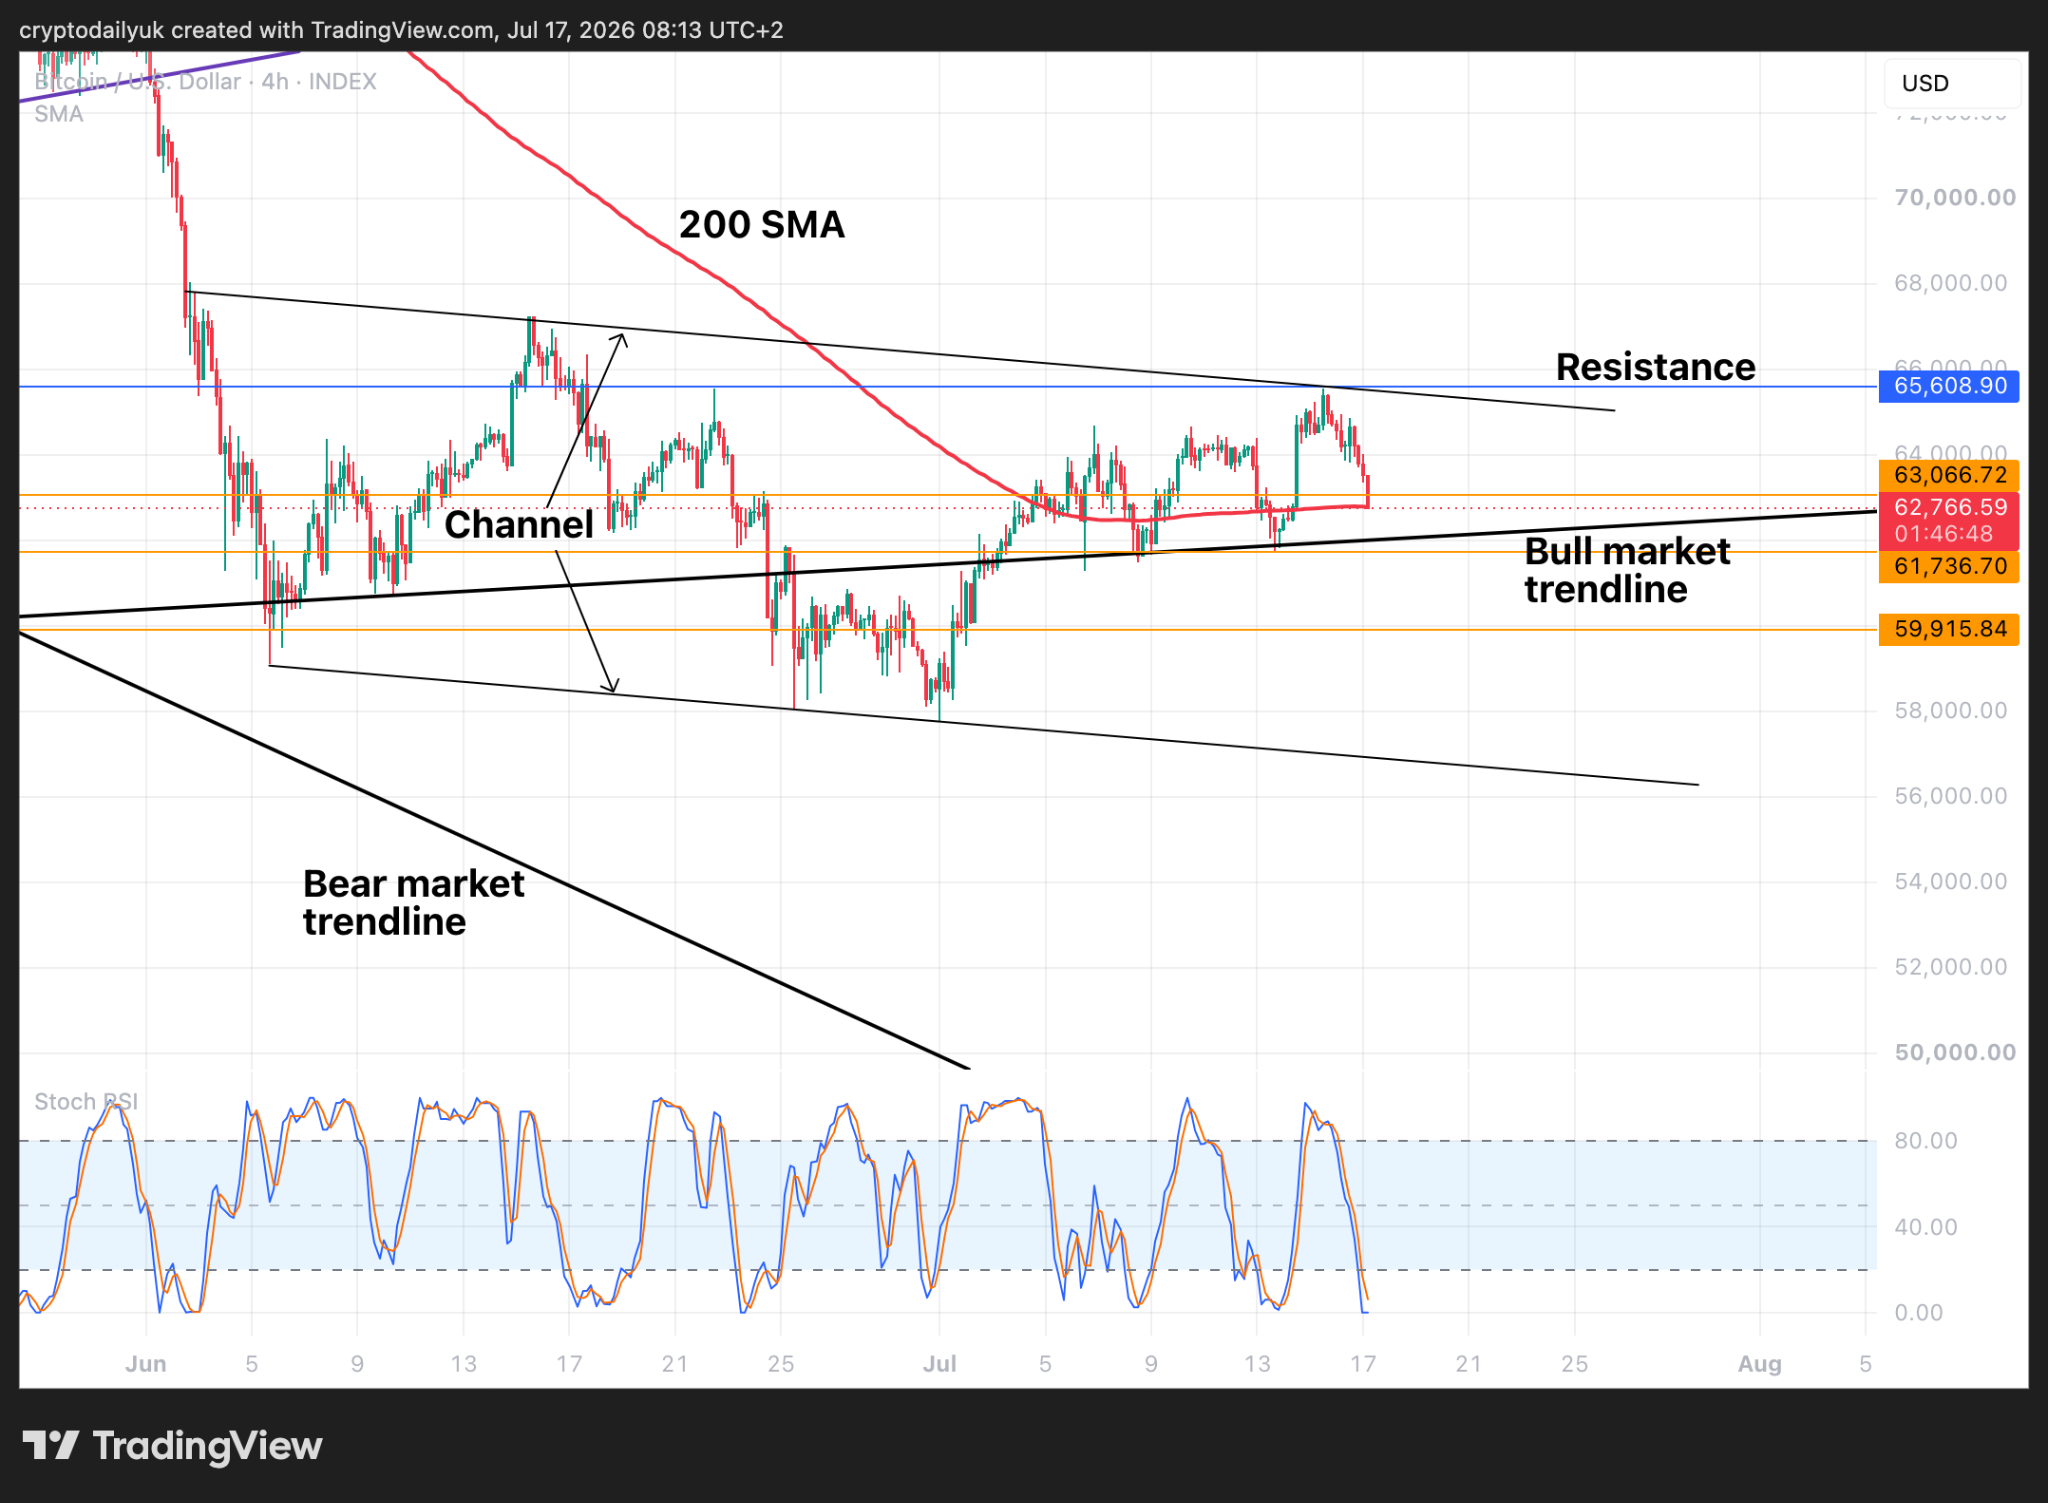
The first thing to notice in the short-term time frame is that the falling wedge has become a descending channel. The recent touch of the $65,600 horizontal resistance looks to have confirmed the pattern.
The next factor to be aware of is that the rally made a series of higher highs and higher lows. If there is a bounce from the $BTC price at either the 200 SMA or the bull market trendline, the series of higher lows will not be broken. That said, if these supports fail, a descent to around $57K marking the bottom of the channel would possibly be the next move.
At the bottom of the chart, the Stochastic RSI indicators are at their lower limit. As they turn back around and head back up, potentially signalling upside price momentum, this would tend to support the bounce thesis.
Rising wedge in RSI needs to be watched closely
Source: TradingView
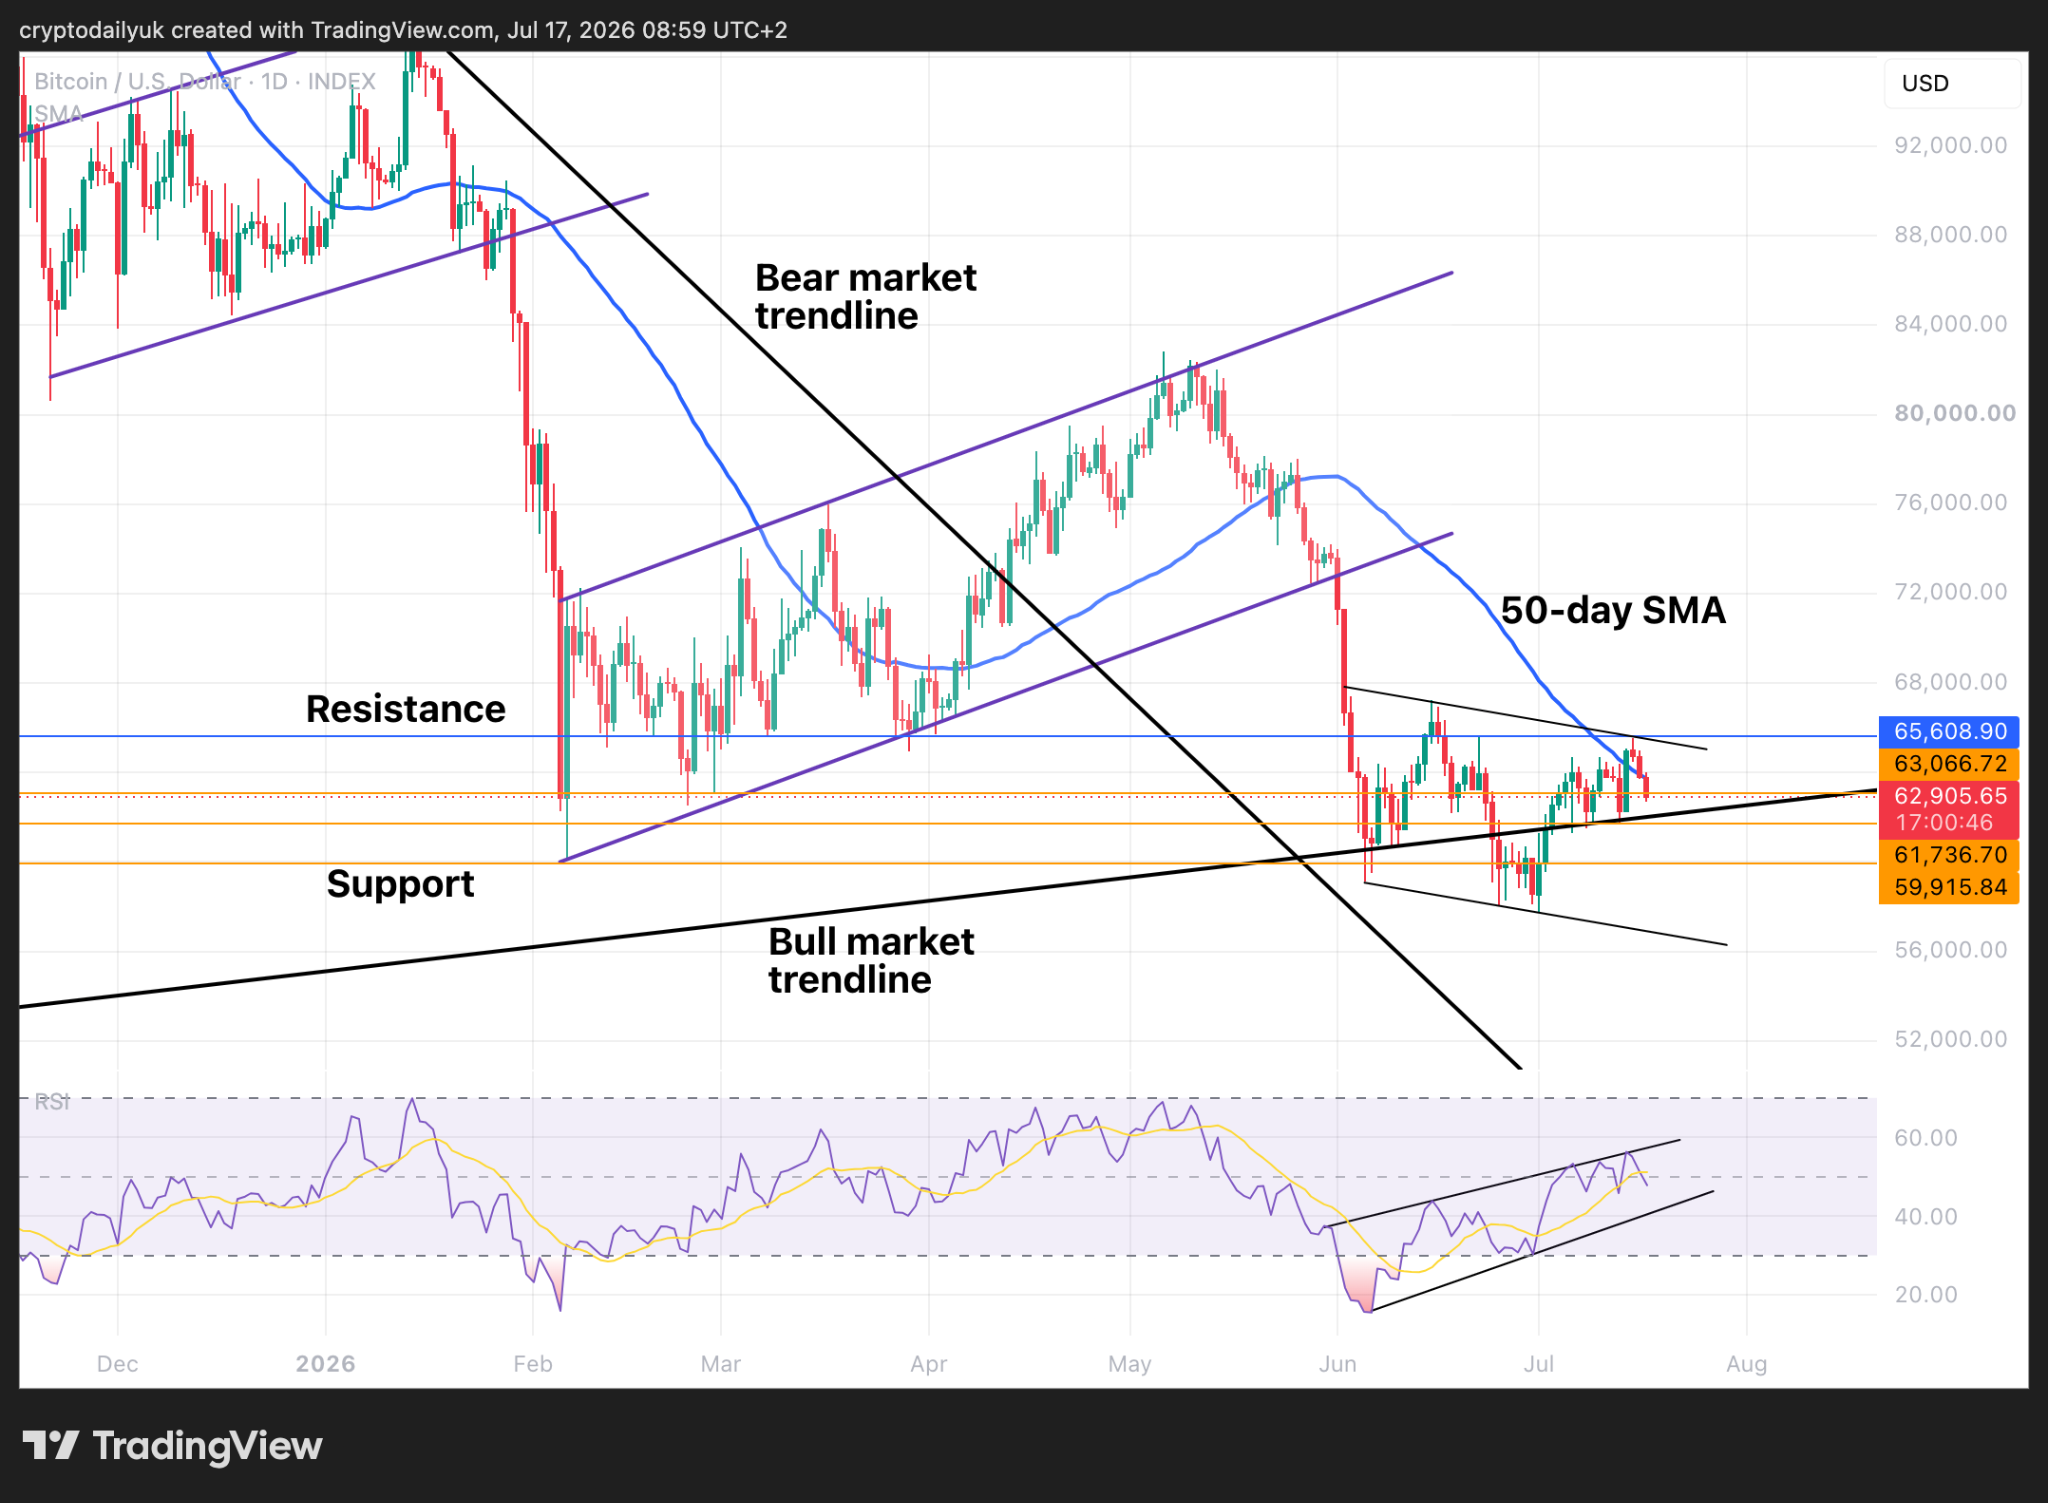
The daily chart shows the very different channel pattern compared with the two previous bear flags. Where the bear flags were very bearish, the channel leans towards bullishness. That said, there is still probably room for the $BTC price to descend to the bottom of the channel again. This would mean a lower low and a new floor to the bear market. However, this is still the preferable option for the bulls, rather than another big crash.
The RSI should be watched closely in this daily time frame. The indicator line is moving within an ascending wedge. If the line drops out of the bottom of this wedge, this could be the signal that the price action is heading down to the bottom of the channel.
One further point to note is that the $BTC price has just dropped below the 50-day SMA. If it holds below, there is the possibility of a crash to lower levels. The sharp corrections out of the two bear flags after dropping below the 50-day SMA are testament to such a possibility.
Bulls need to defend bull market trendline
Source: TradingView
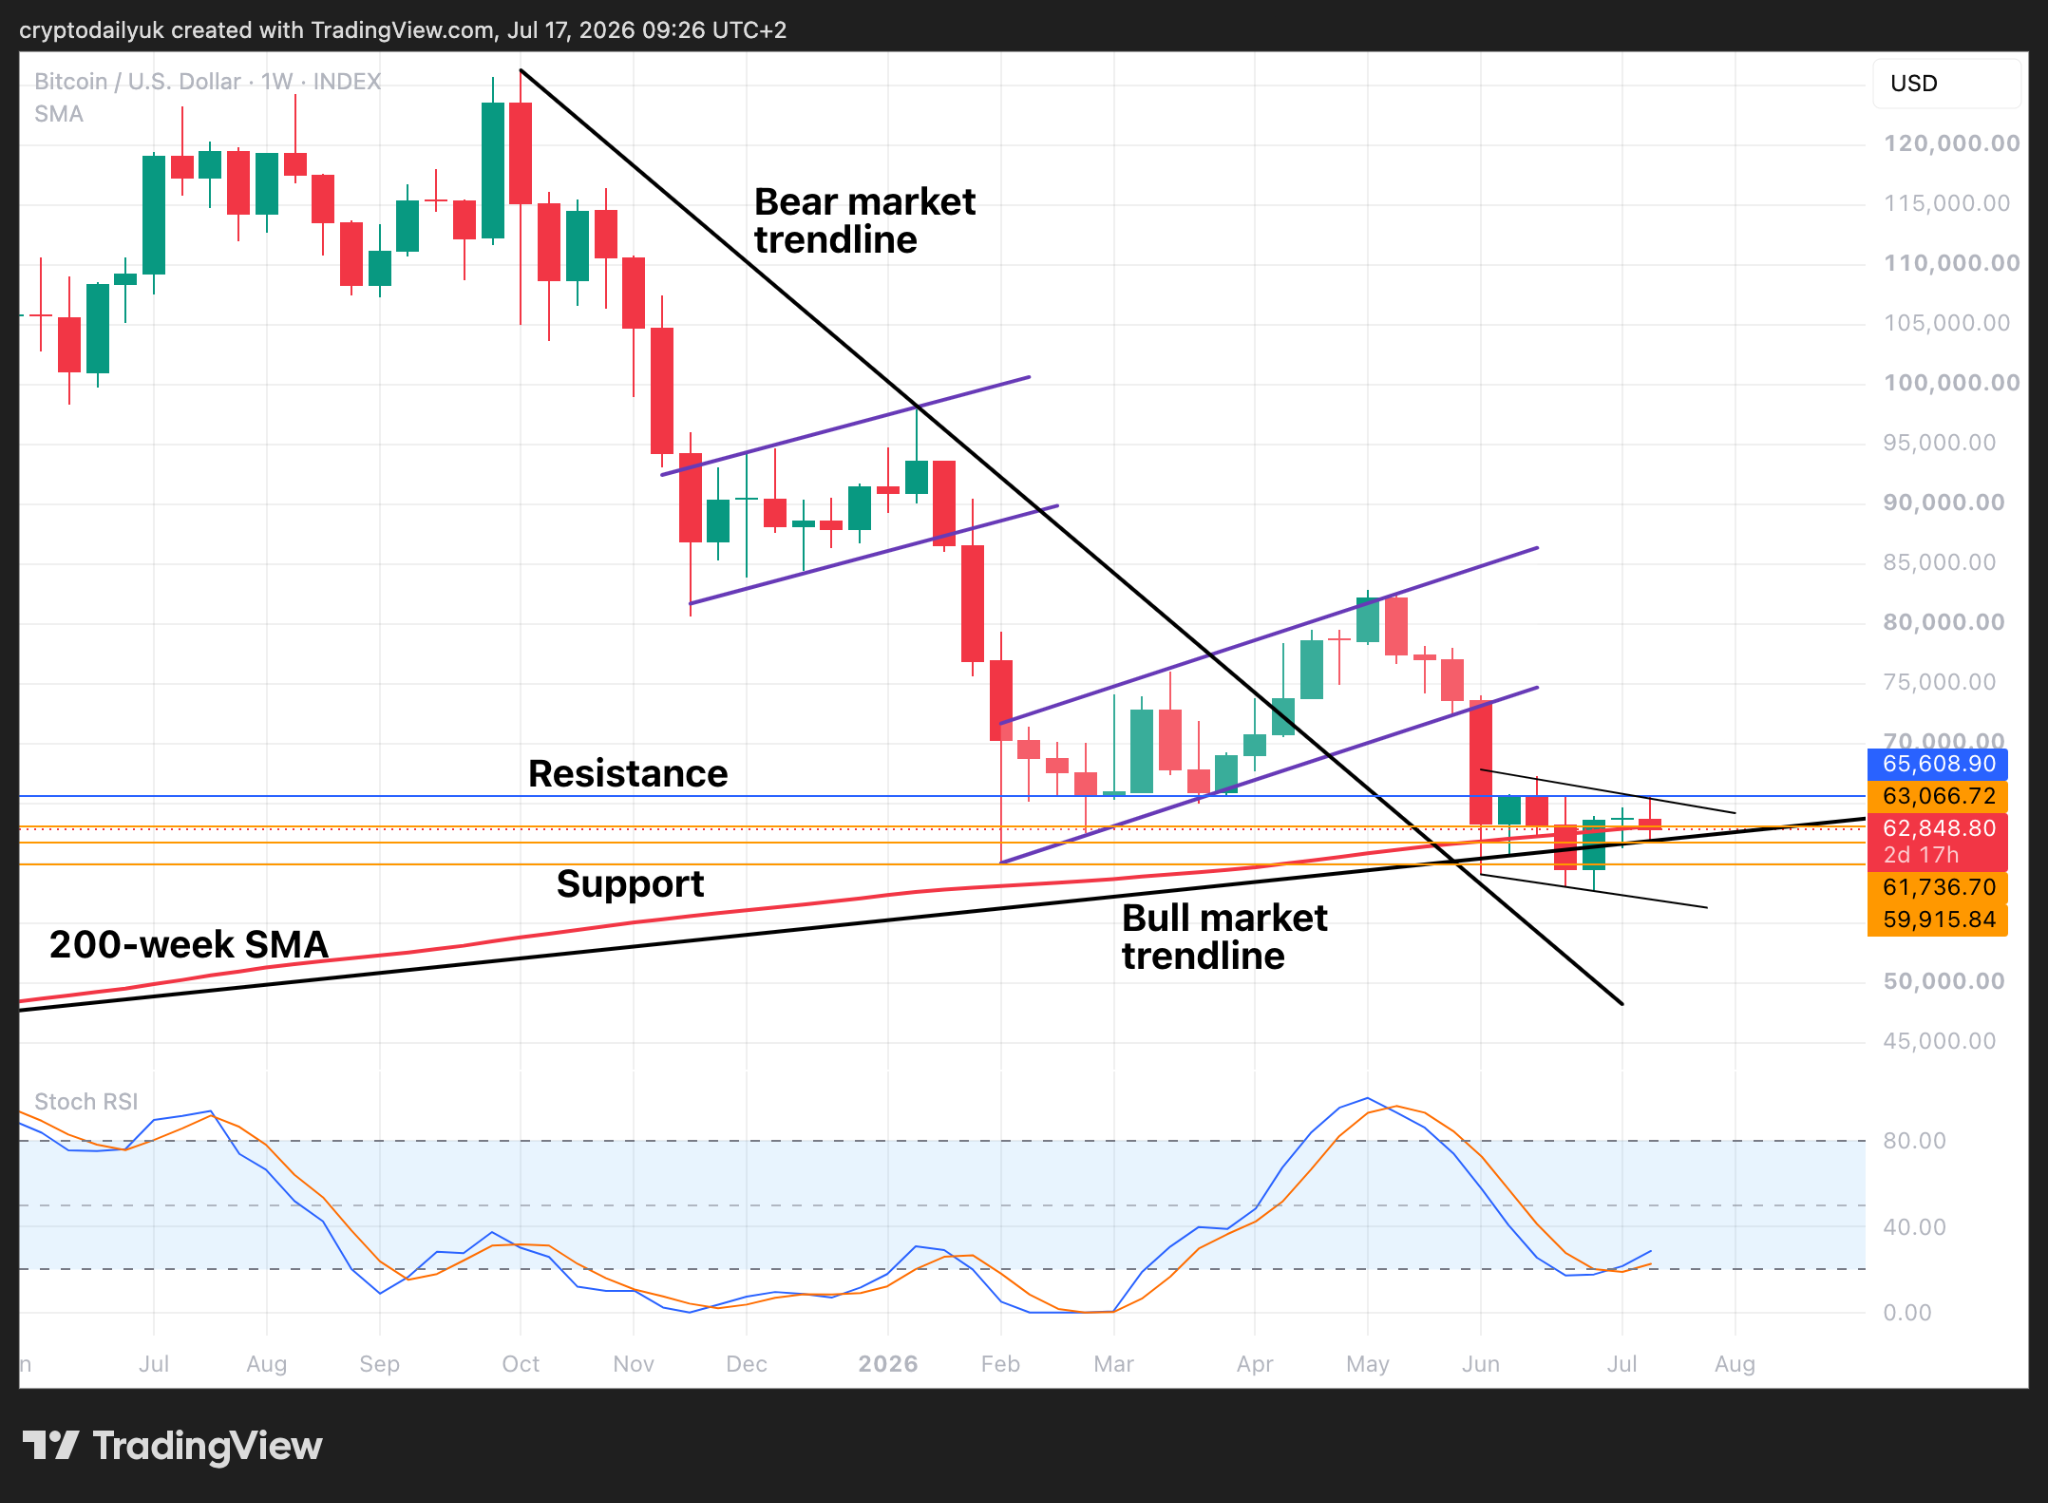
As we move into the last part of the week, it will be important for the bulls to defend the bull market trendline during this current corrective phase. If the price action is above at the end of the day on Sunday, the possibility increases that a bear market bottom might already be in.
It may well be that the $BTC price continues to go sideways from here. There is possibly another three or four weeks before the price has to either fall below the bull market trendline or break up through the key $65,600 horizontal resistance.
Whichever way it turns out, we are probably most of the way through this bear market now, and it might just require the price to grind sideways or downwards for two or three months longer in order to ensure a decent capitulation of holders. Will you be one of them?
Disclaimer: This article is provided for informational purposes only. It is not offered or intended to be used as legal, tax, investment, financial, or other advice.
Related Stories