Bitcoin Breakout About to Fail: Fakeout or Shakeout Dip to Clear the Longs?
 Laurie Dunn

Bitcoin continues to keep traders guessing as it recently dipped back below the key horizontal support of $66K. Is this an omen that the breakout is about to fail, or is this just market makers trying to throw off traders before the rally resumes?
Nothing more than a retest?
Source: TradingView
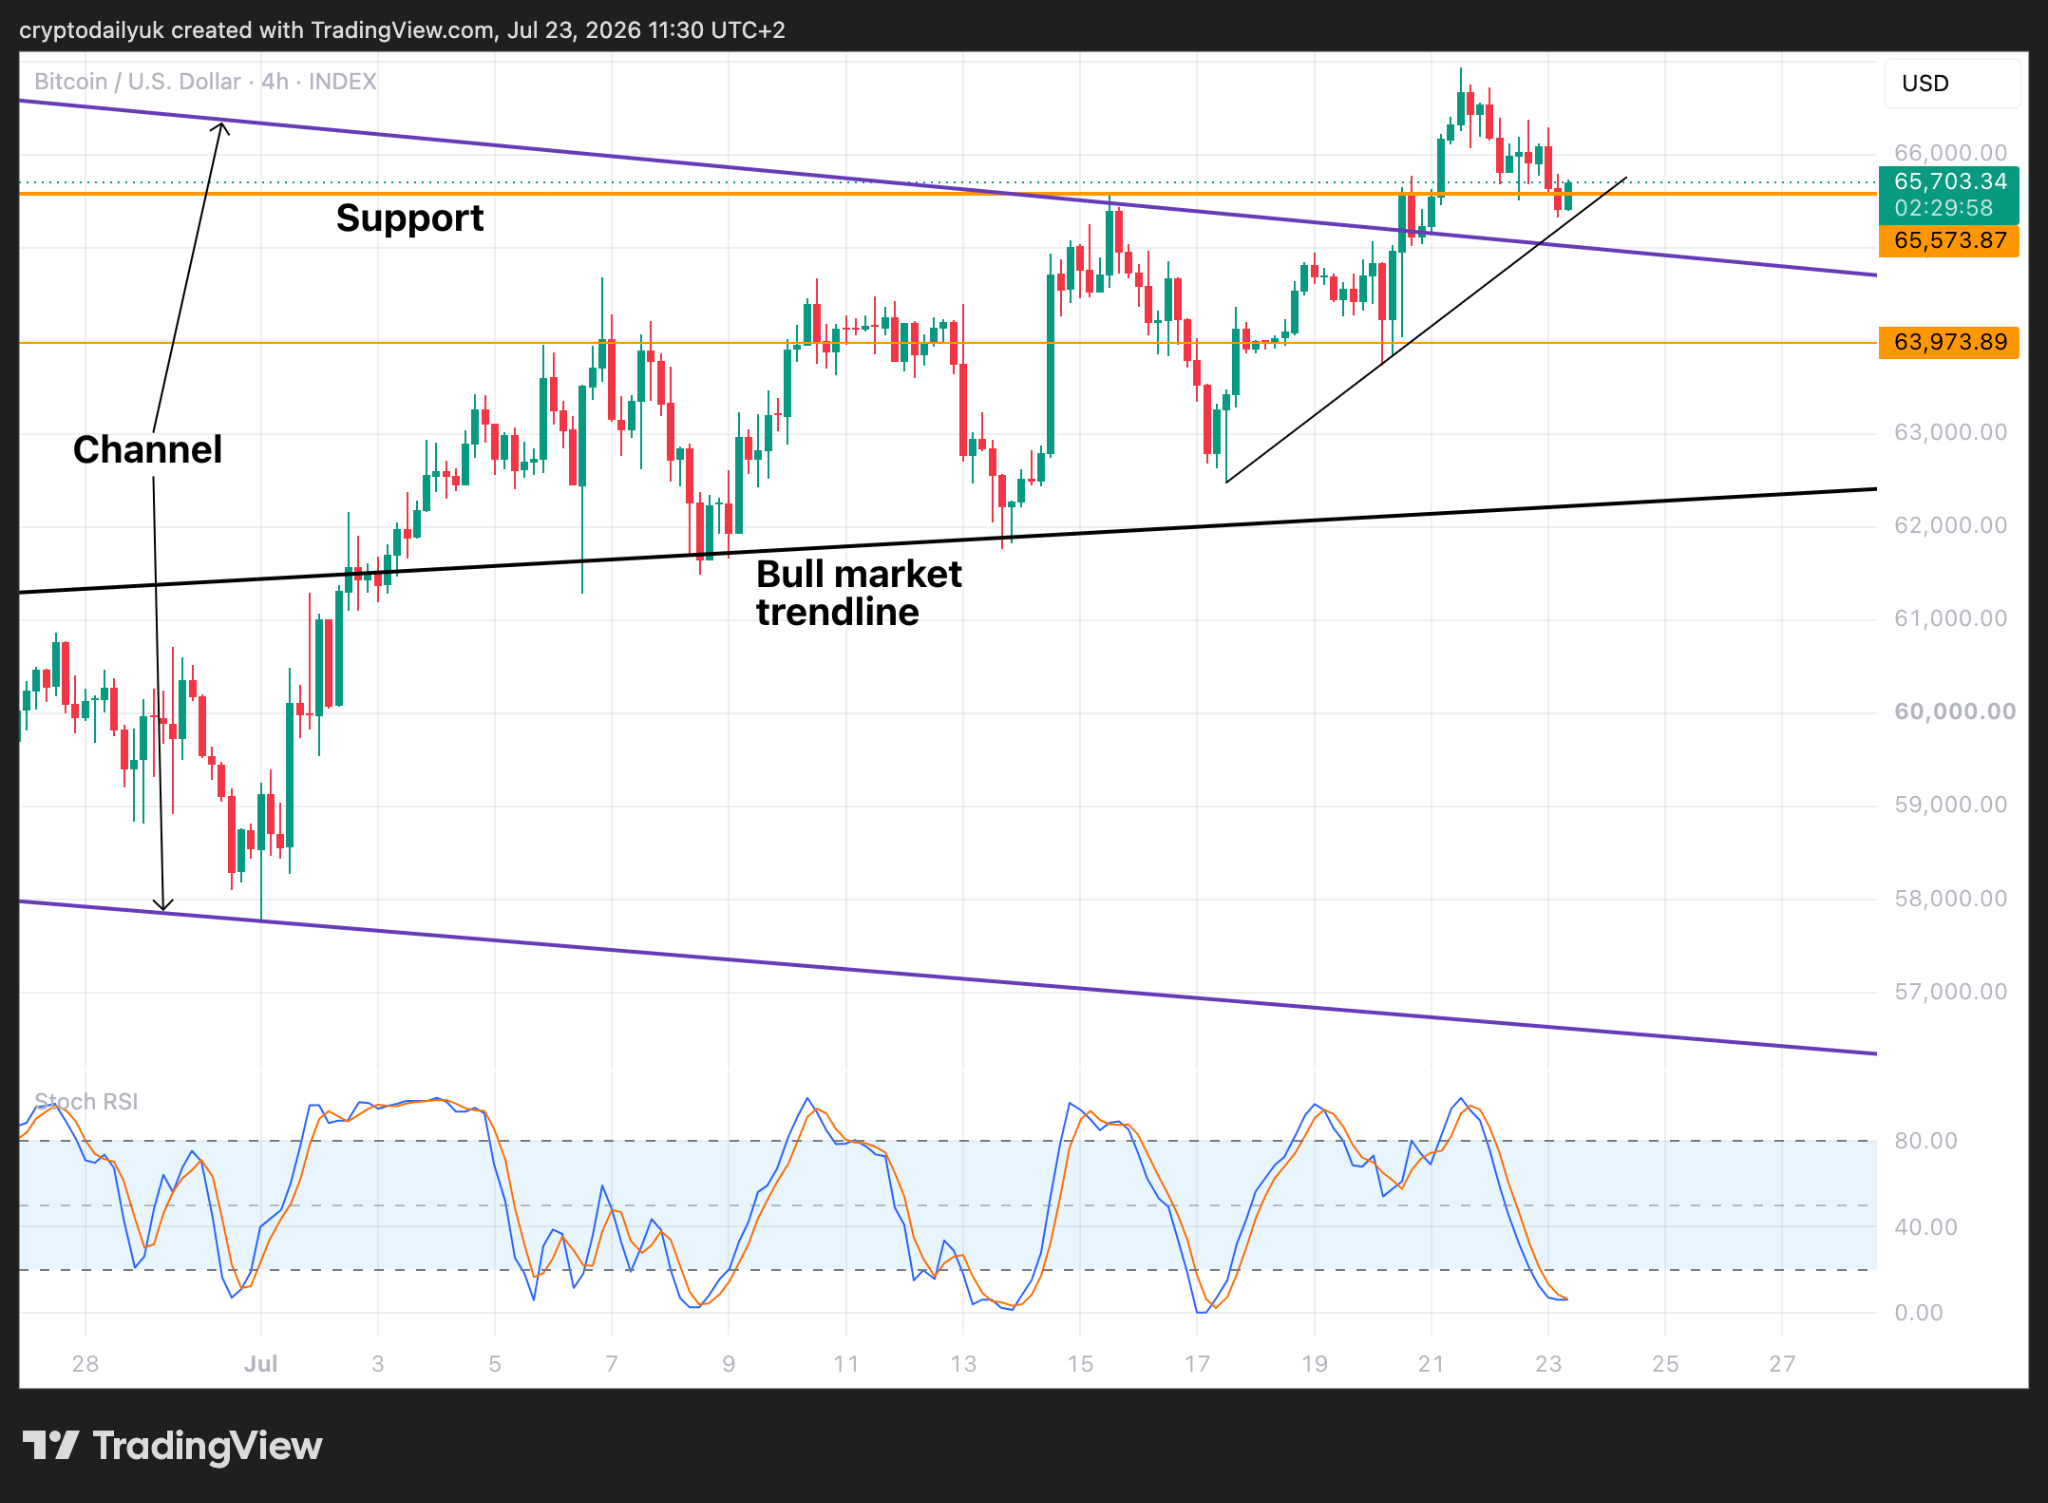
Despite the rather bearish title, the short-term time frame chart shows that the $BTC price is actually doing fine. Of course, if there is a sell-off here the price could go back to $64K and even down to $62K. However, as things stand, this recent small dip is probably nothing more than a retest of the key horizontal resistance. A small ascending trendline is still intact, and so a bounce from here is possibly the next move.
The Stochastic RSI indicator lines are posturing to turn back around. If they do so, look for a continuance of the rally.
No higher high yet
Source: TradingView
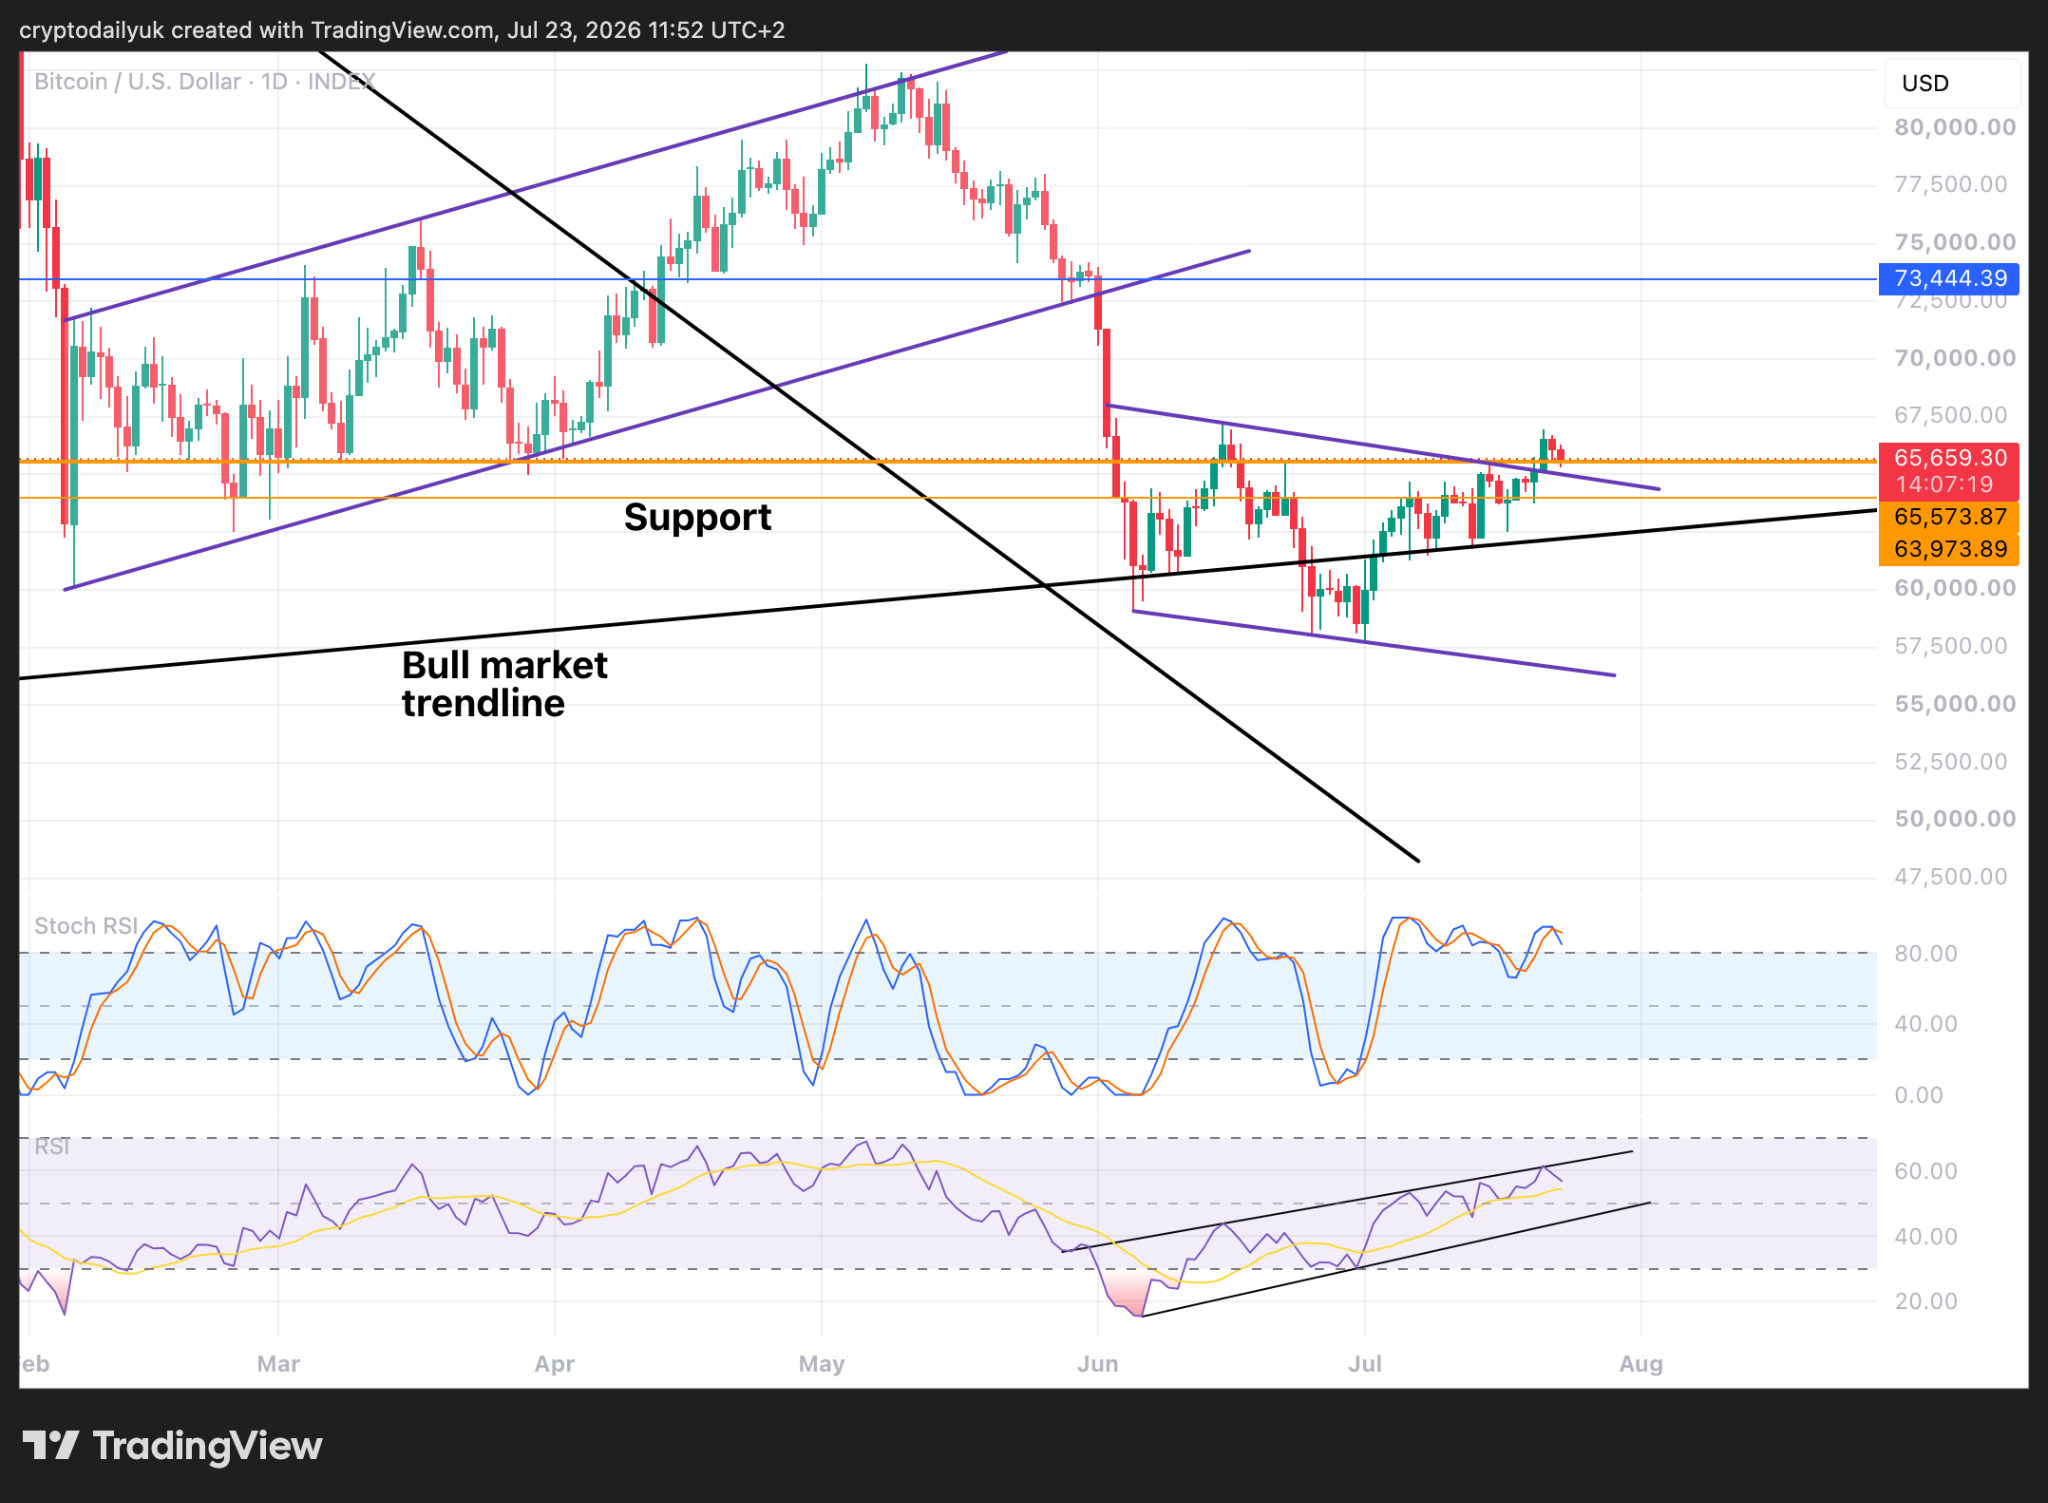
In the daily time frame things don’t look nearly as bullish. In fact, if it wasn’t for the fact that the $BTC price broke out of the descending channel, and also pierced through the key $66K resistance, one might be forgiven for seeing a slightly bearish slant here.
The $BTC price has so far failed to make a higher high, although if there is a continuance of the rally this wouldn’t be too far off.
In the Stochastic RSI, the indicator lines have turned down. There has been a good period of bouncing along while staying close to the key 80.00 level. This could persist, but the indicator lines will come down at some point.
Finally, in the RSI the indicator line has been rejected again from the top of the ascending wedge formation. The longer this formation climbs, the more likely it will be that the indicator line will drop out of the wedge to the downside. This will need to be watched.
All in the balance as weekly close gets nearer
Source: TradingView
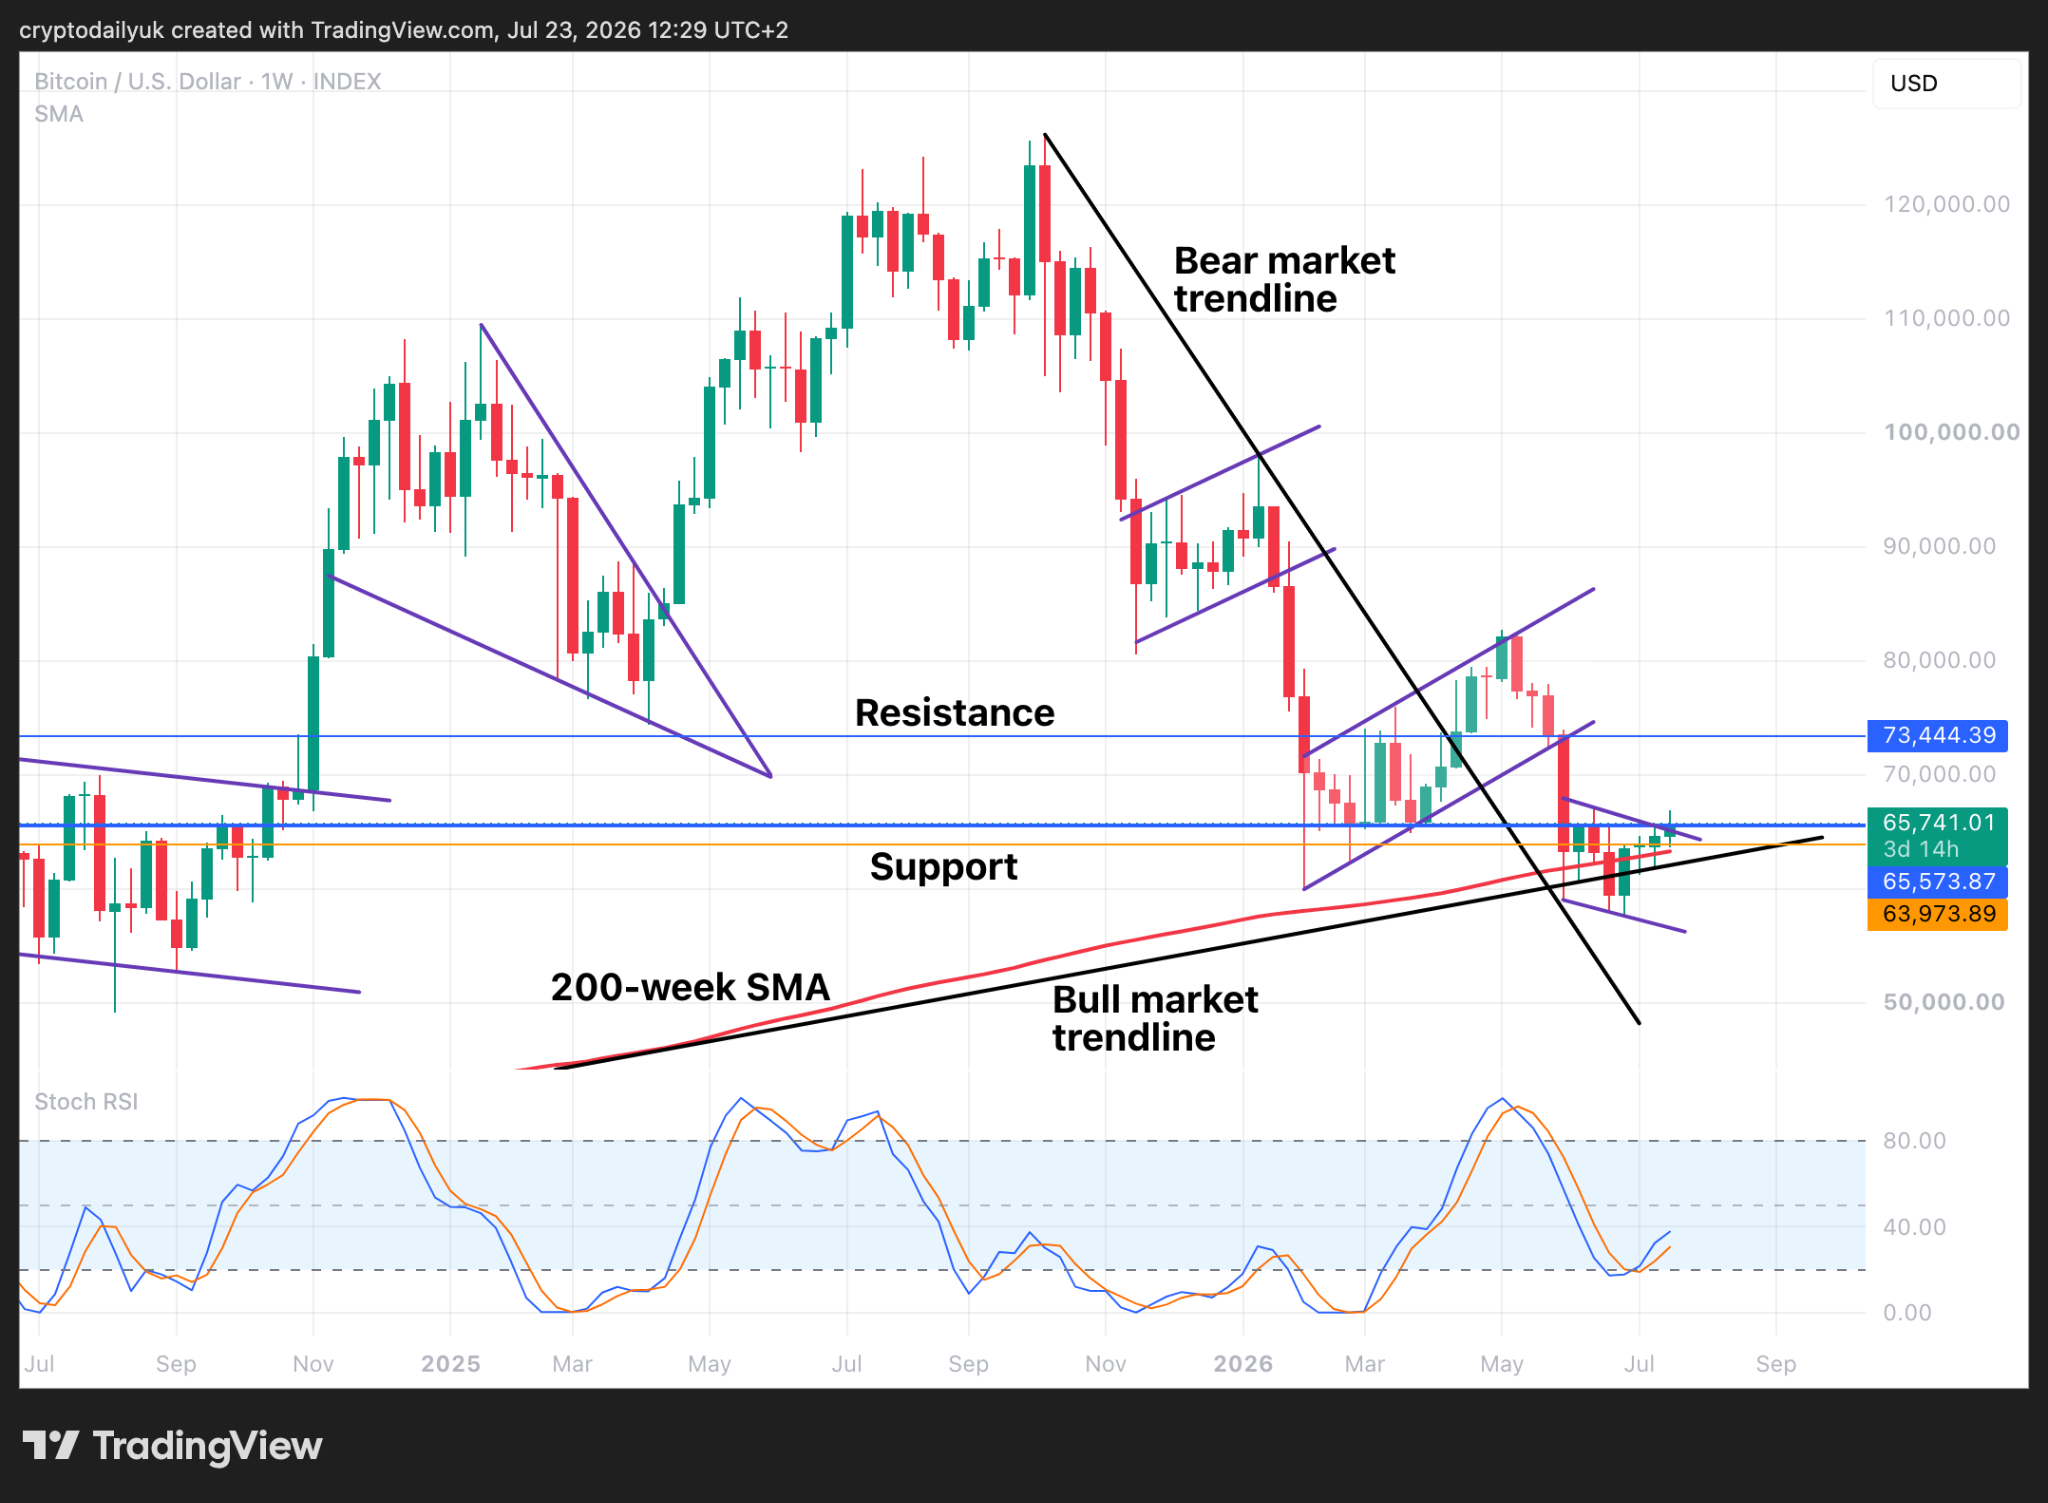
The weekly time frame tells us that neither the bulls nor the bears can be declared short to medium term winners yet. All hangs in the balance. Once again, the end of this week will give us the level of the candle close. If the candle closes above $66K then the bulls will have potentially overcome that major hurdle. If it closes below, indecision could reign, and both bulls and bears might chew on their fingernails for another week.
It’s crucial that the Stochastic RSI indicator lines continue to rise. If they start to roll over, a new bear market low comes back into the limelight. Those betting on a continuing rally will be crossing both fingers and toes.
Disclaimer: This article is provided for informational purposes only. It is not offered or intended to be used as legal, tax, investment, financial, or other advice.
Related Stories