BTC Drops Toward $64K as S&P 500 Forms Lower High – Correlation Strikes Again

The US and Iran may have reached agreement on stopping conflict, but the U.S. stock market is not taking part in any euphoria and is instead rather unsettled. A lower high in the S&P 500 is corresponding with a potential rejection of the major $66K level for Bitcoin.
Down to $63,700 support level?
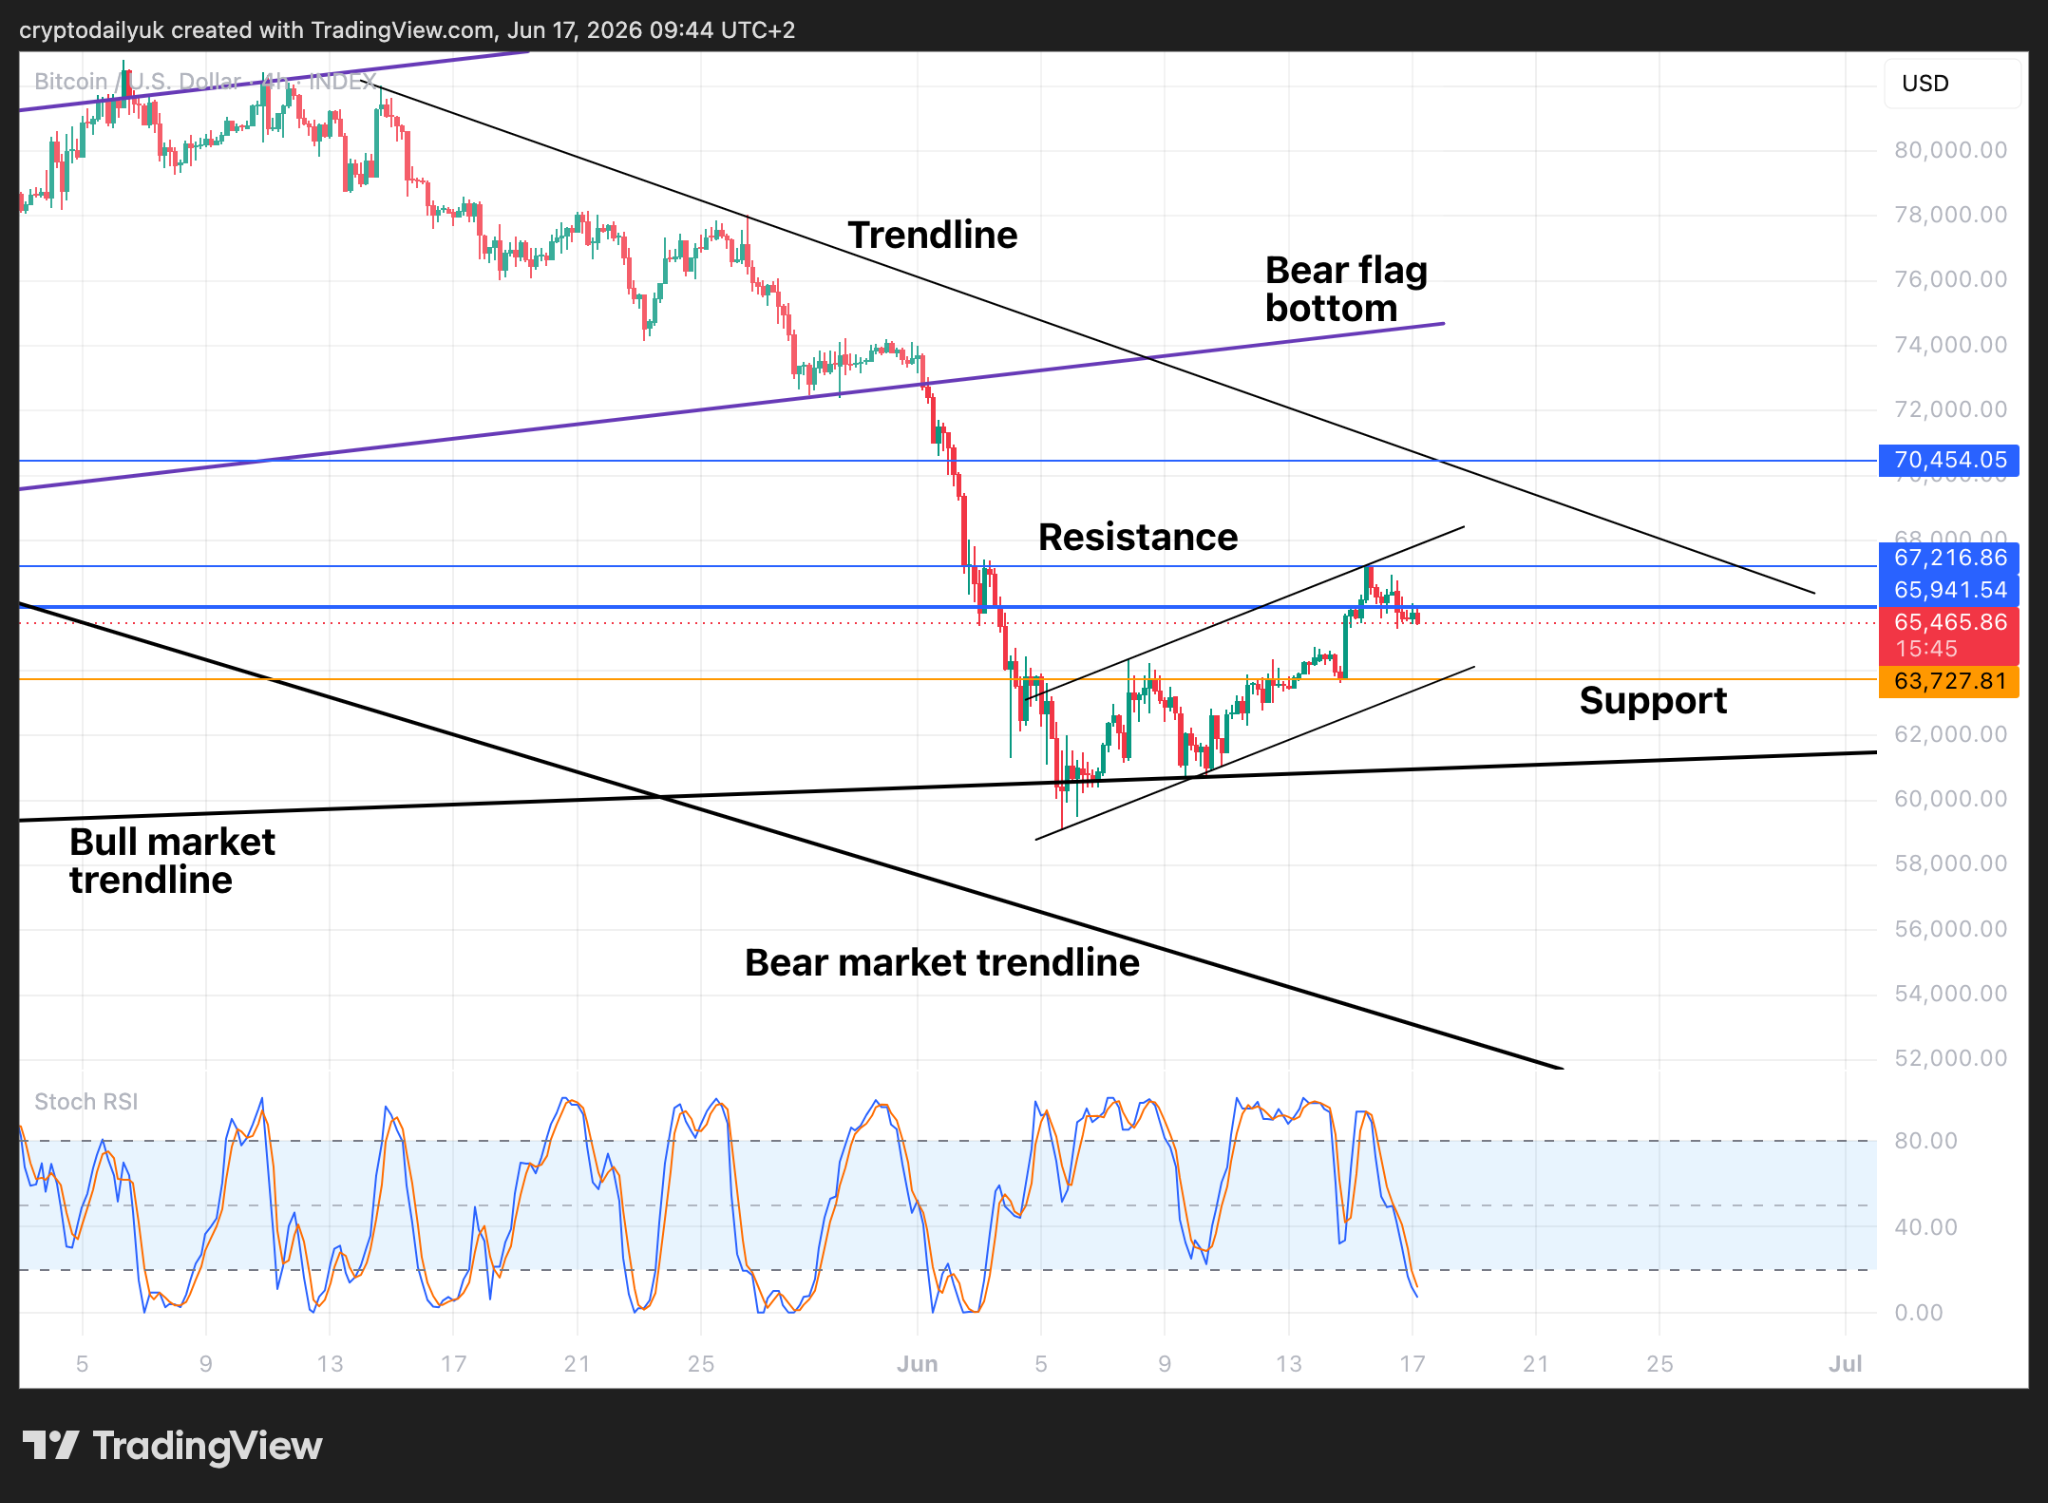
Source: TradingView
Looking at the 4-hour time frame the $BTC price can be observed moving within what appears to be a small bear flag. If the price is rejected from the $66K horizontal level, a fall to the $63,700 support and the bottom of the bear flag could be the next move.
If on the other hand the bulls can push the price back above the $66K level, the $67,200 resistance, and then the top of the bear flag and the descending trendline will form a major barrier to further upside price action.
Has the upward trend come to an end?
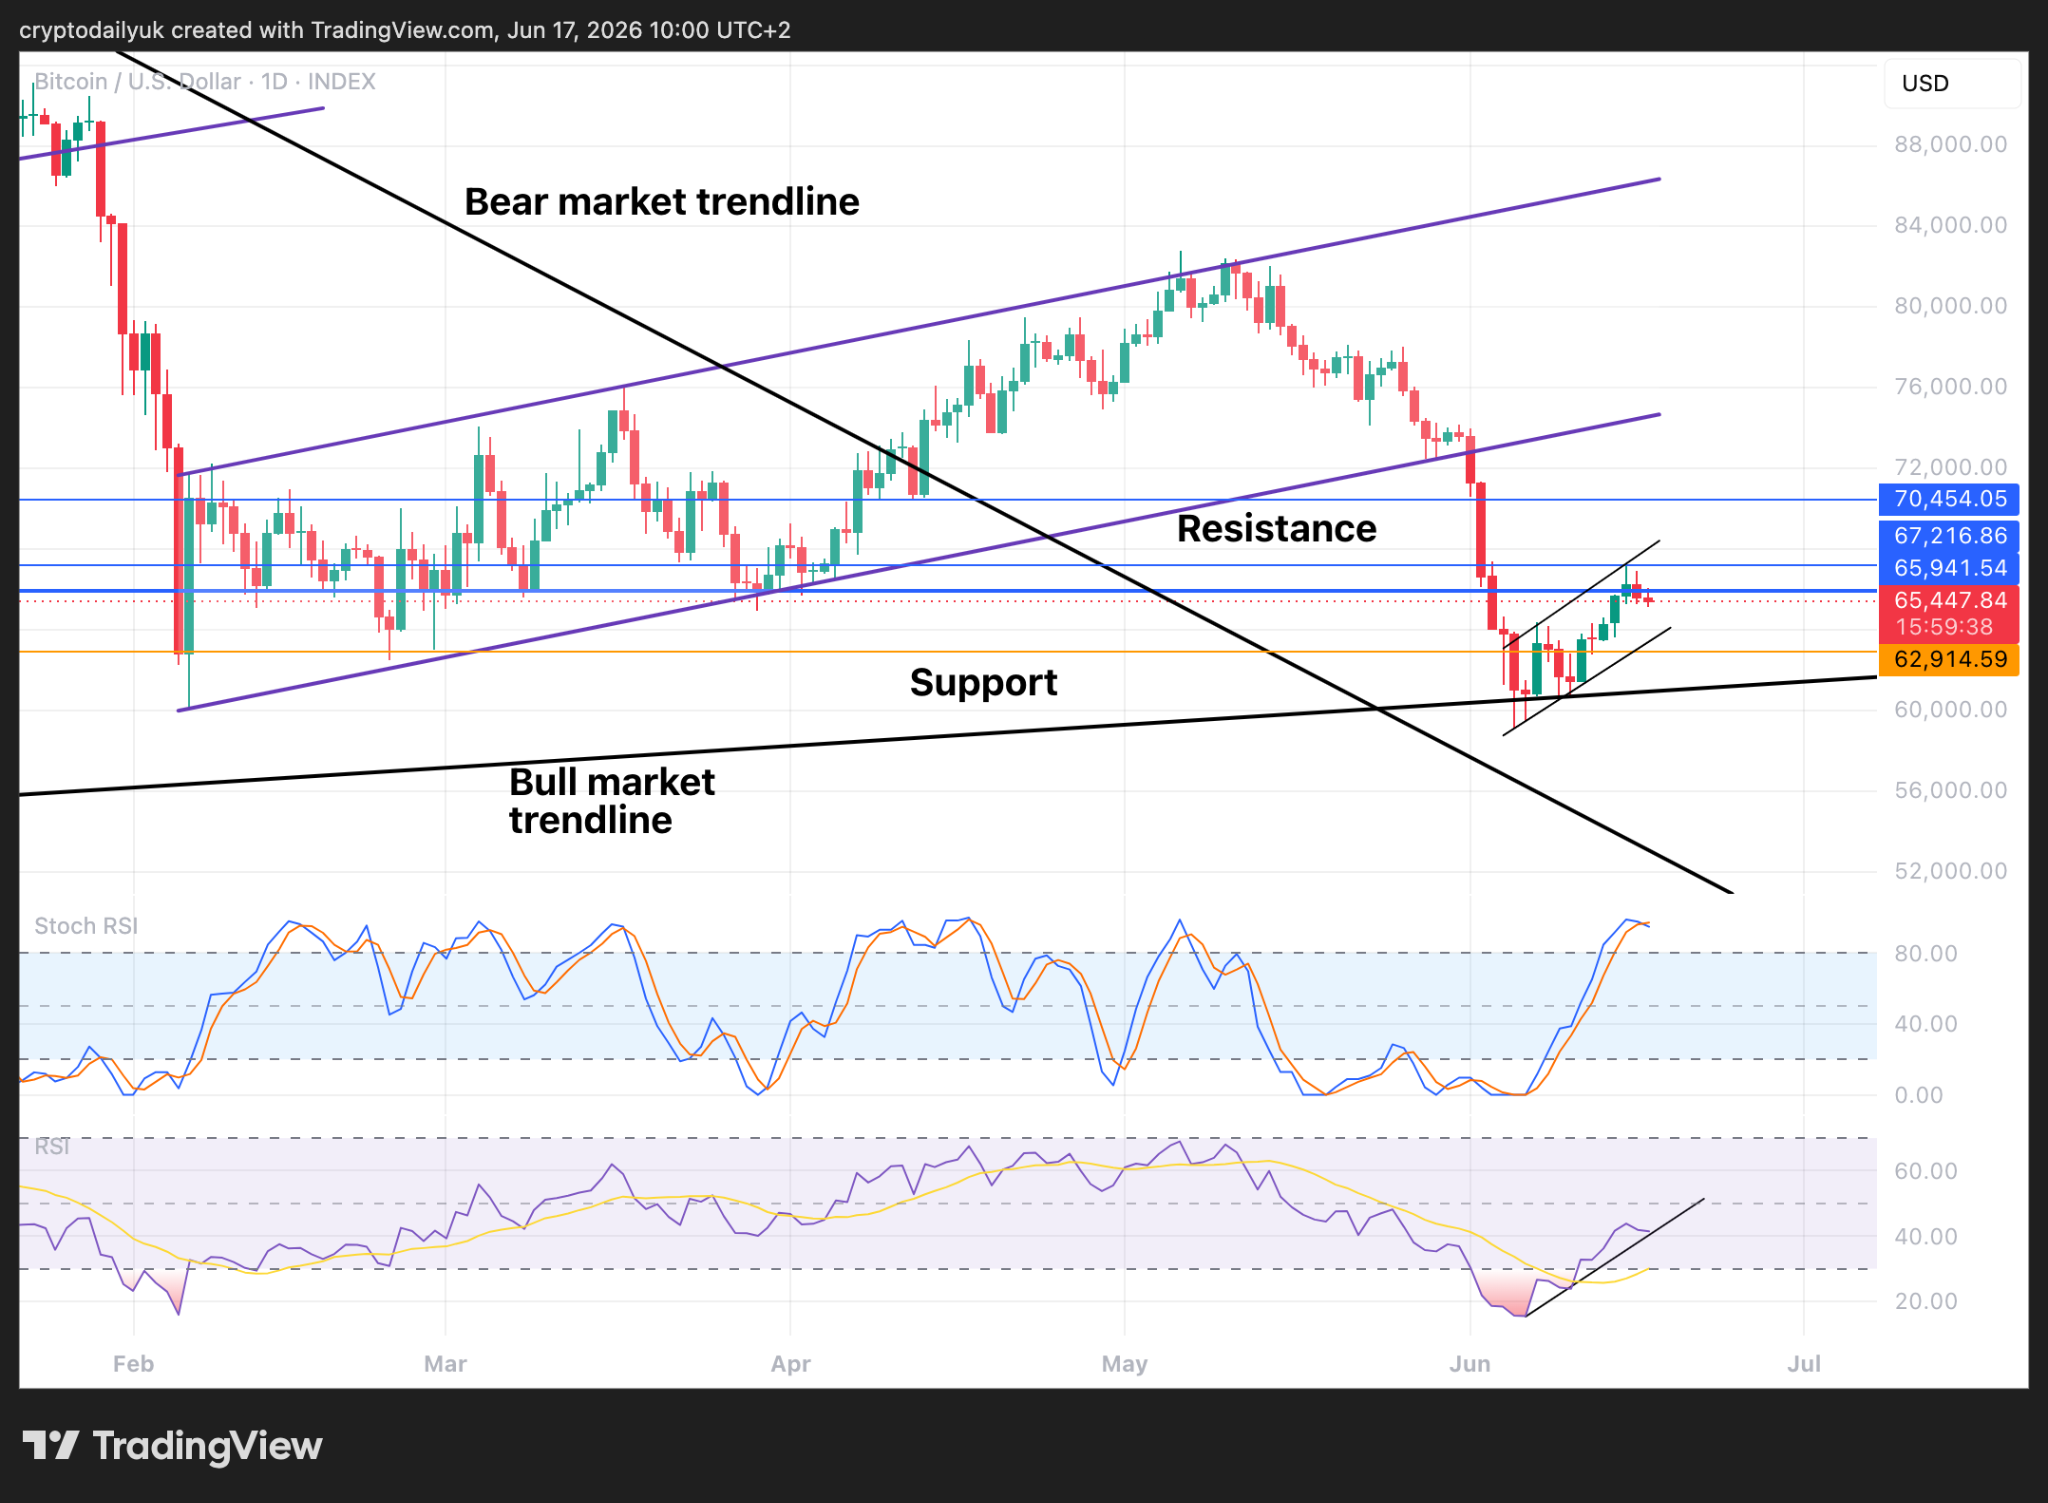
Source: TradingView
The daily chart provides a higher level view. Here the proposed bear flag can be compared with the hugely bigger 4-month bear flag. One notices immediately that the angle of the new flag is much more inclined to the upside. Also, there are so far only two touches of the top of this flag. These inconsistencies perhaps point to this not being a bear flag, therefore price action will need to be watched closely.
Favouring a roll-over of the $BTC price from here are the Stochastic RSI indicators, which have reached their top limit. Also, at the bottom of the chart, the RSI indicator could be about to pierce through the ascending trendline, potentially bringing this small upward trend to an end.
Another weekly candle rejection from $66K?
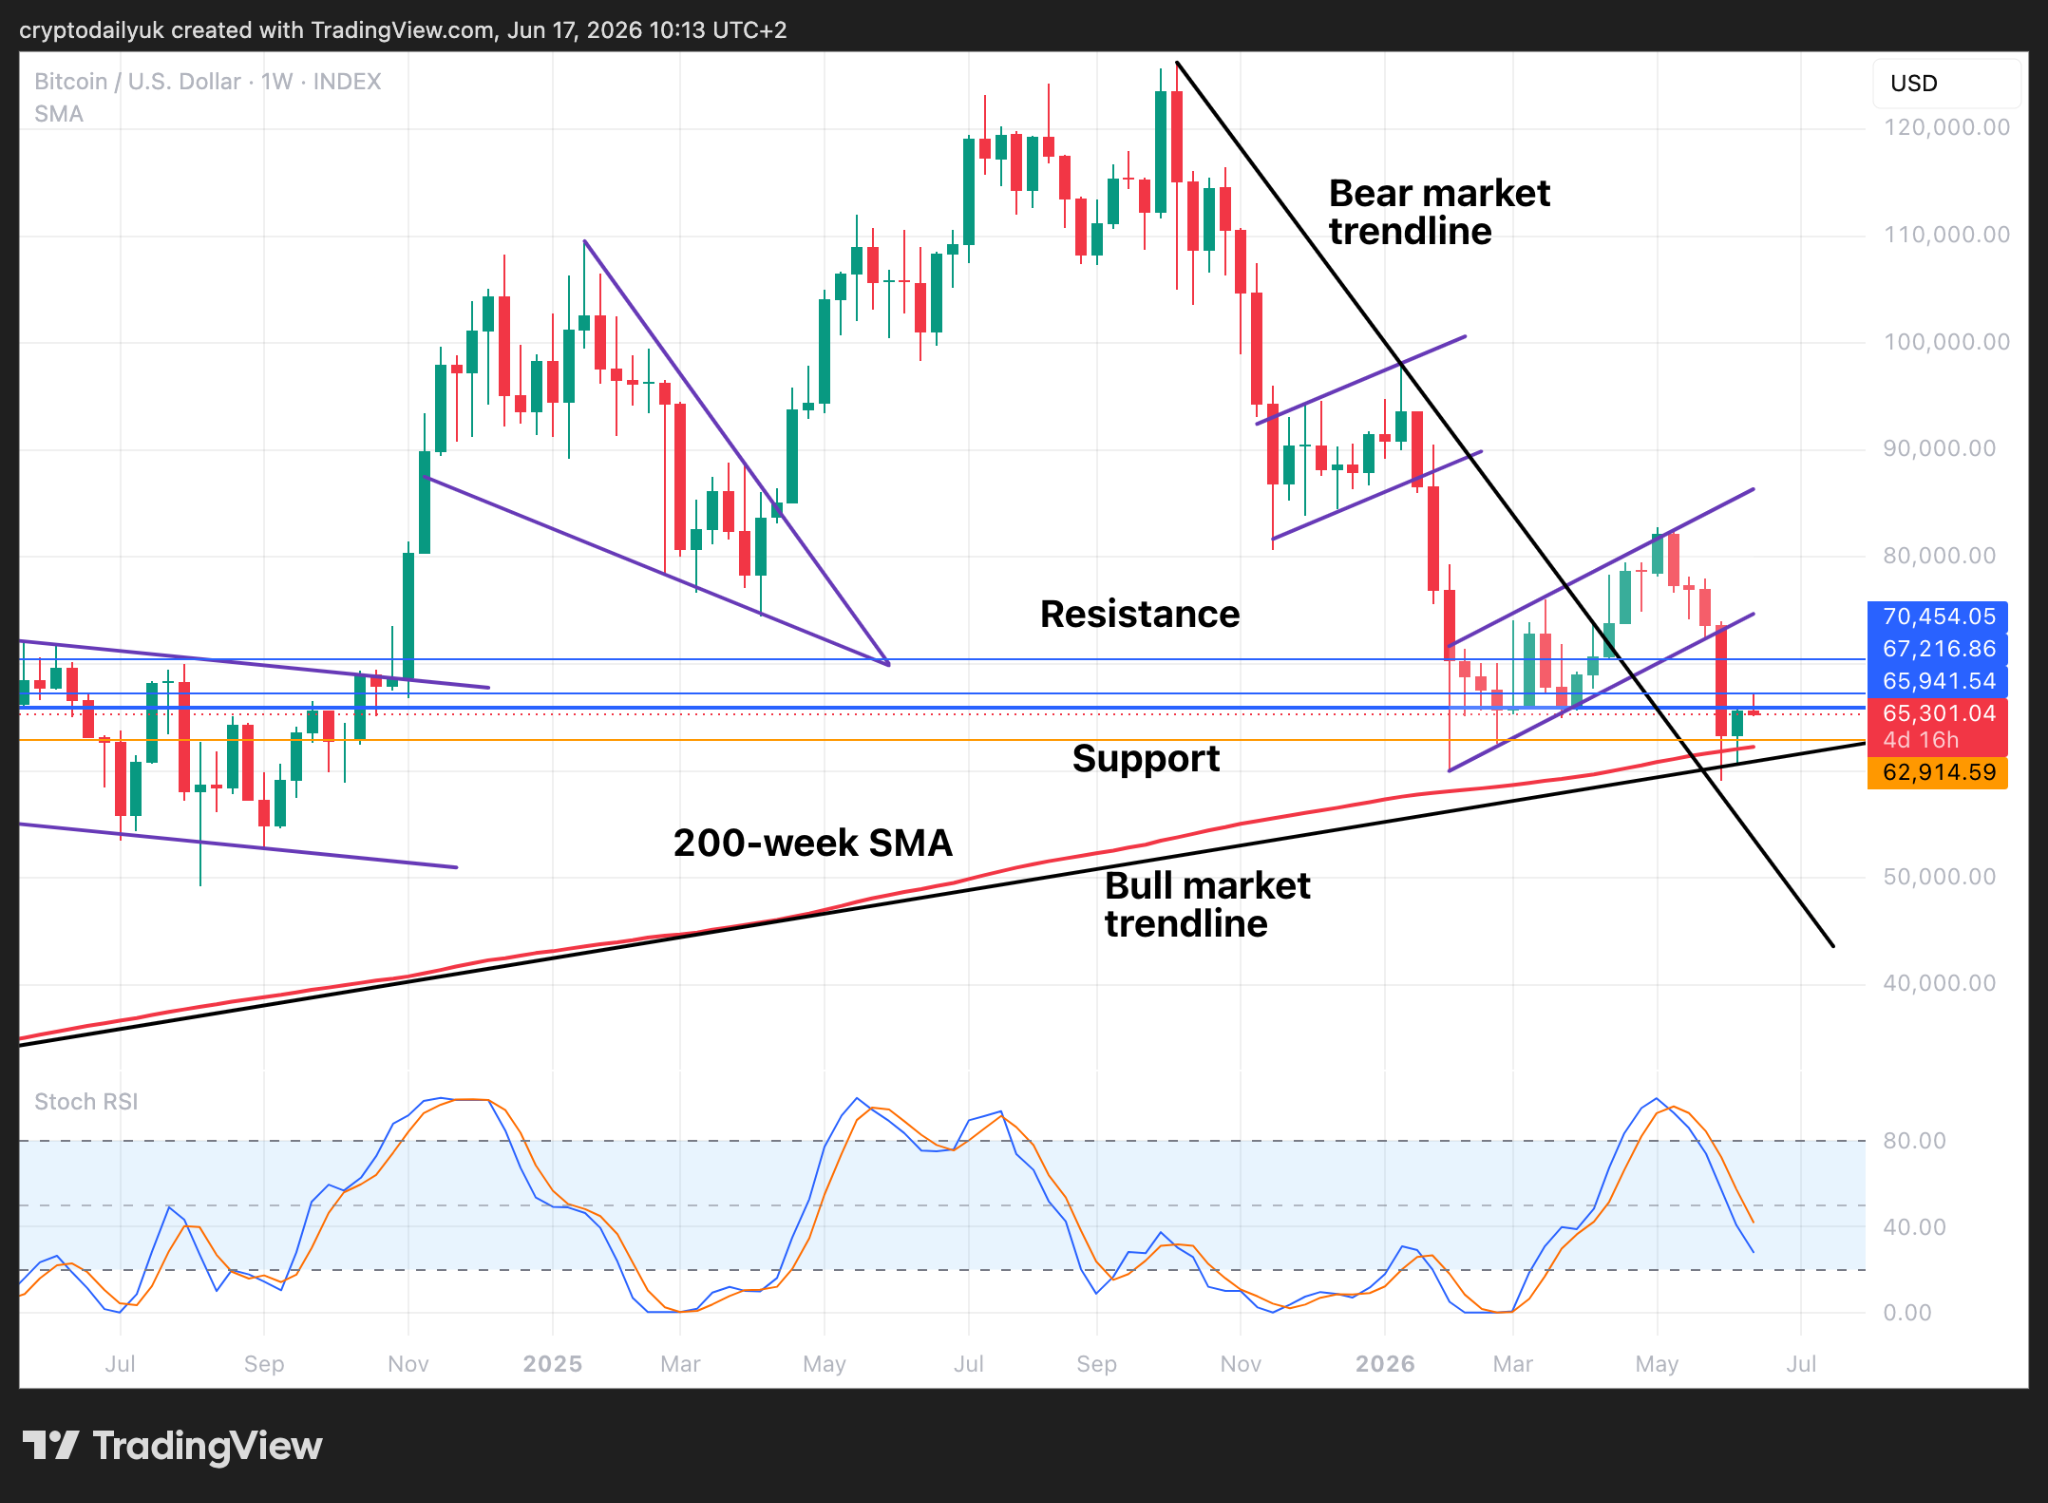
Source: TradingView
We are still not even halfway through the week, but the $BTC price is posturing to close another candle body below the very important battle ground of the $66K horizontal level. If this is indeed the case at the close of play this coming Sunday, another move down to retest the 200-week SMA and the bull market trendline is definitely on the cards for next week.
The bear market is not set to finish until Q4 this year if it runs a similar length to the two previous bear markets. Therefore, further downside price action might be expected. If the 200-week SMA and the bull market trendline fail, the downside could be more than a lot of commentators are expecting.
Disclaimer: This article is provided for informational purposes only. It is not offered or intended to be used as legal, tax, investment, financial, or other advice.

Related Stories