Crypto Price Analysis 6/24: BTC, ETH, SOL, AVAX, DOGE, TON, ICP, HBAR, RNDR

Bitcoin (BTC) has registered a considerable decline over the past couple of weeks, dropping from $71,119 to its current price level of $62,356. Over the past week, the asset has fallen by nearly 6%.
According to analysts, the cryptocurrency is gradually dropping toward its support level. They urged traders not to fall prey to factors such as boredom or mini pumps and dumps.
Bitcoin (BTC) Price Analysis
Bitcoin has been on a downward trajectory since June 6, after its price reached $70,979. Since then, bearish sentiment has increased significantly, with the price dipping below $70,000 the next day. Here, BTC found support thanks to the 20-day SMA, but sellers took control once again, dropping the price below the 20-day SMA to $67,376 on the 11th. The price managed to stage a recovery the following day but was back in the red on the 13th, dropping to $66,109. BTC saw some sideways consolidation at this point. However, by the 17th, BTC was back in the red and dropped below the 50-day SMA on the 18th.
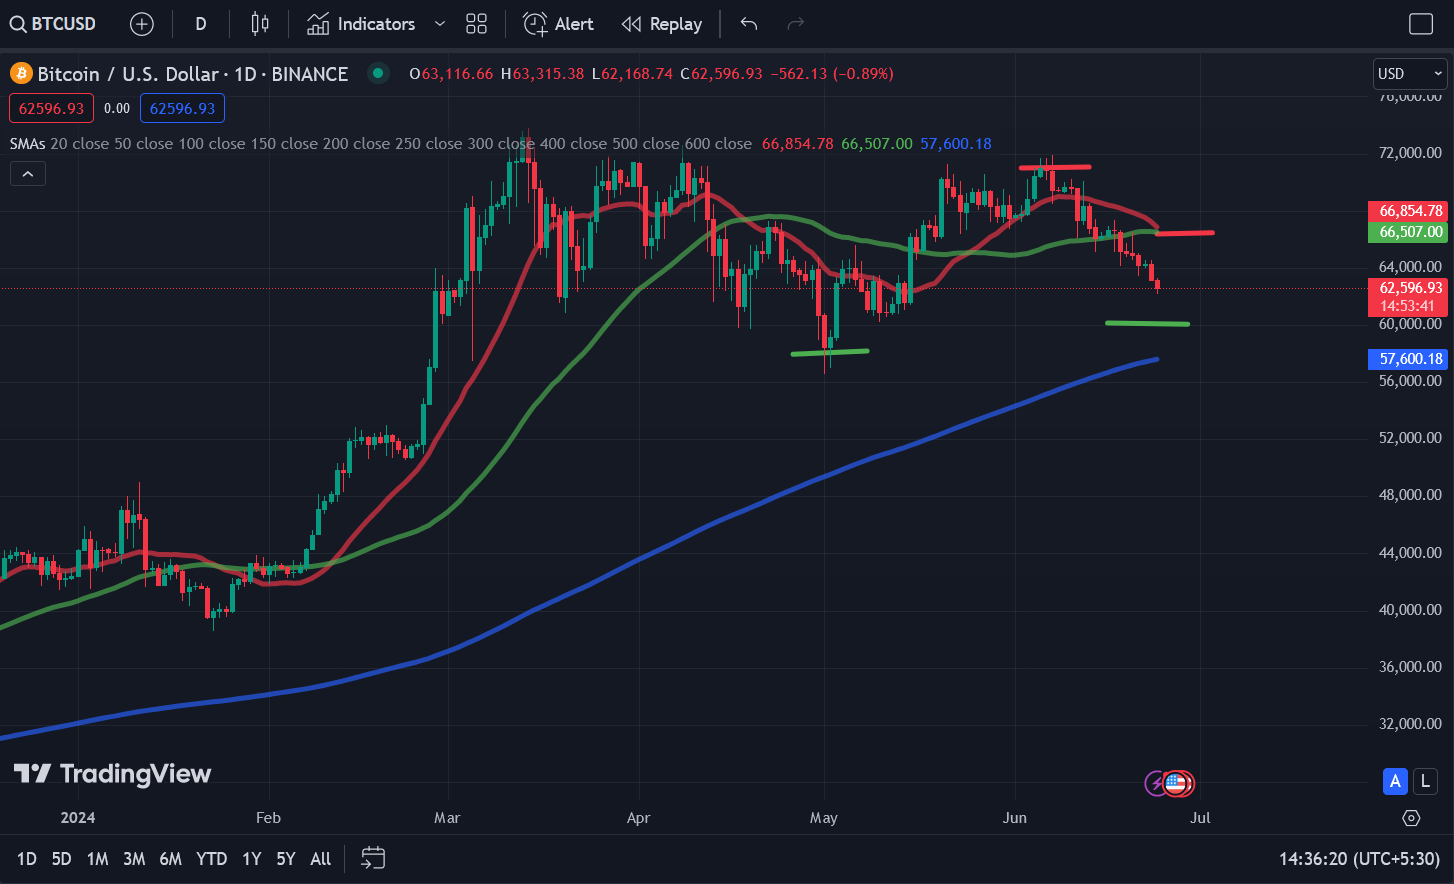
Source: TradingView
The price attempted a recovery on the 20th, as seen from the price chart, but failed to move past the 50-day SMA. Bitcoin’s recent decline has considerably impacted the market, with its dip below the 62,500 mark liquidating thousands of traders. Several reasons behind the recent decline, such as the drop in whale transactions. Outflows from spot Bitcoin ETFs have also impacted the market. Looking at current trends, Bitcoin could drop to $60,000 as it drops toward its support level. Any further drop from here could see BTC drop as low as $57,500.
Ethereum (ETH) Price Analysis
Like Bitcoin, Ethereum (ETH) has also been on a downward trajectory, having shed nearly 5% over the past week. ETH had recovered to $3,622 after dropping below $3,500 a day prior. However, it could not move past the 20-day SMA, falling by over 3% on the 17th to $3,510. Bearish sentiment intensified the following day, with ETH dropping as low as $3,359 before recovering and settling at $3,483.
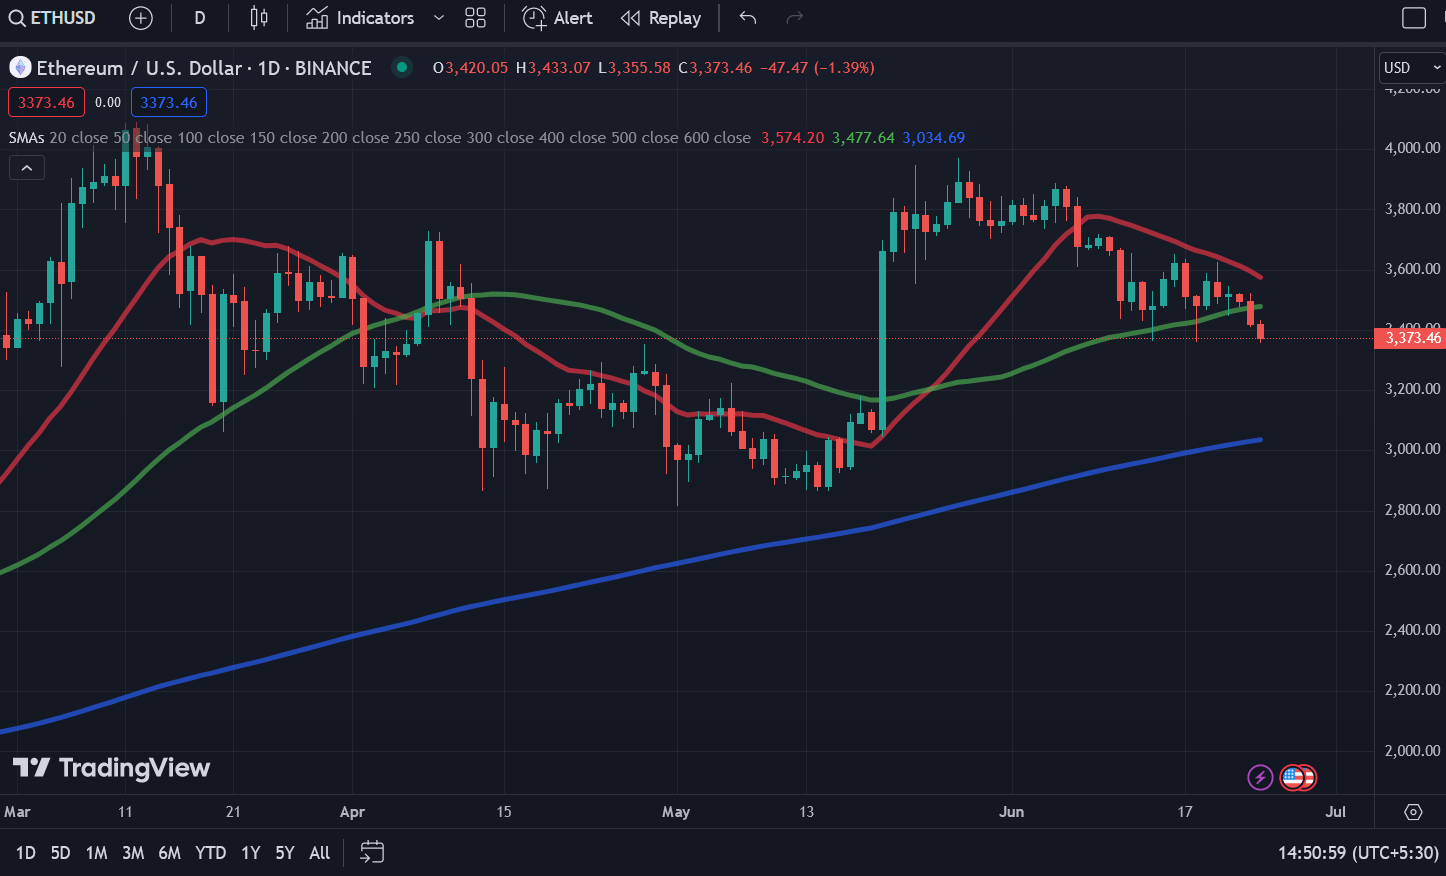
Source: TradingView
ETH made yet another recovery on the 19th, rising to $3,560, and attempted to move past the 20-day SMA on the 20th. However, it could not do so as sellers pushed the price down to $3,513. The past few days have seen selling pressure intensify, with ETH dropping below the 50-day SMA to its current level of $3,373. If selling pressure continues to intensify, ETH could drop to $3,000. To stop this from happening, buyers must reclaim the $3,500 level and push ETH above the 50-day SMA.
Solana (SOL) Price Analysis
Solana (SOL) has faced considerable selling pressure since it hit $150 on the 16th. Monday (17th) and Tuesday (18th) saw SOL by 5.23% and 4.10%, respectively, settling at $137. Sellers continued to dominate the market on the 19th and 20th, with SOL dropping to $133.59, a level where it had considerable support. However, sellers managed to breach this level of support on Sunday, with SOL dropping by nearly 4%, slipping below the crucial $130 mark to $128.63. The current session sees sellers firmly in control, with the price at $123.64.
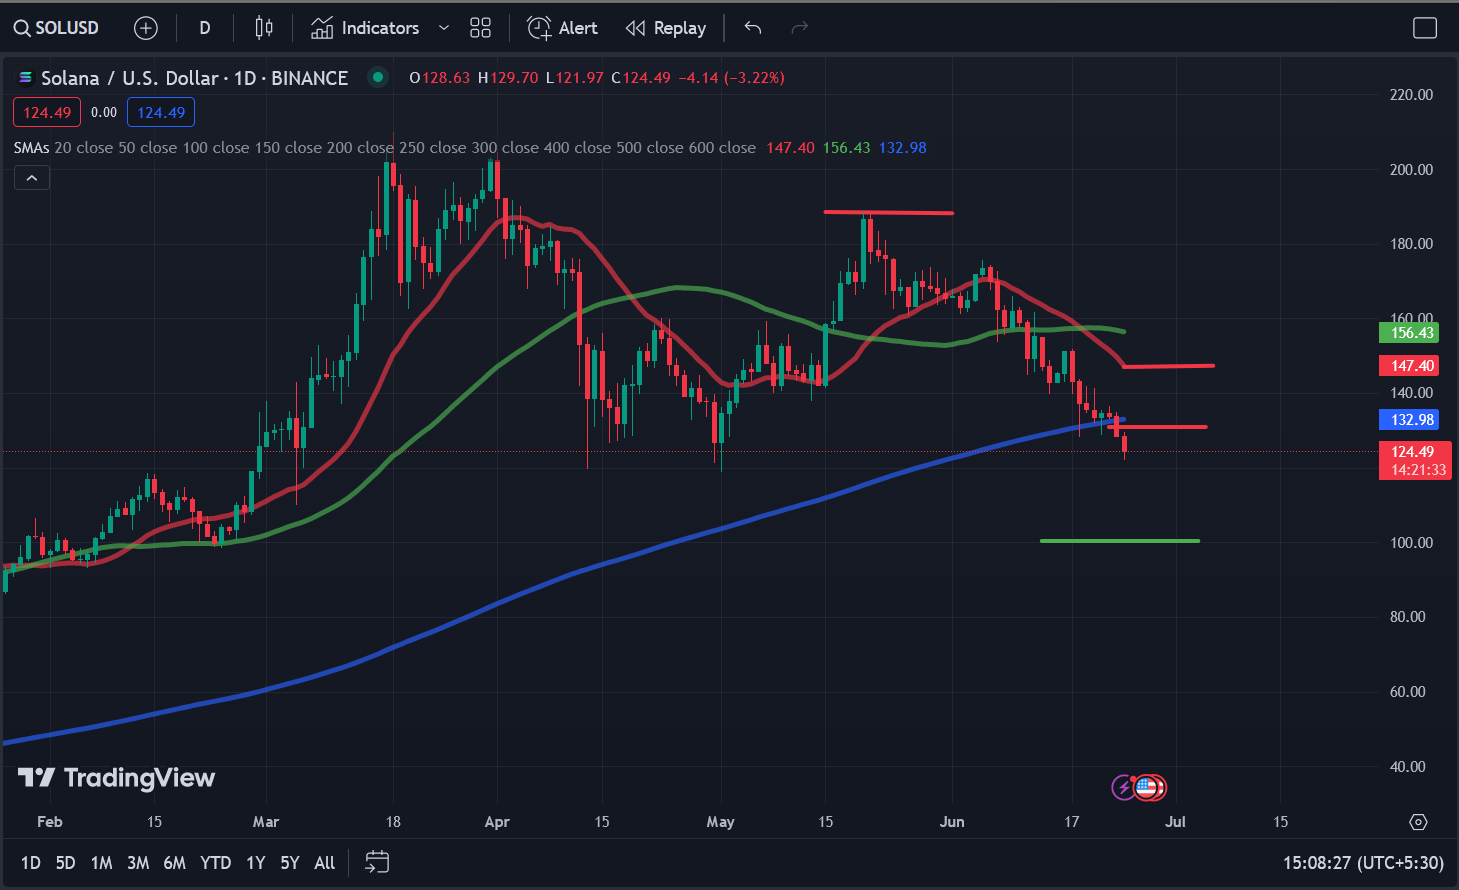
Source: TradingView
With the bearish trend expected to continue, SOL could drop to the crucial support level of $100 or below.
Avalanche (AVAX) Price Analysis
The Avalanche (AVAX) price hit a six-month low due to sustained selling pressure, with the price dropping over 16% in the past week and 35% over the past month. Looking at the AVAX price chart, we can see the extent of its bearish trajectory. AVAX has been in a downward spiral since it climbed to $41.20. By June 2, AVAX had dipped below the 20, 50, and 200-day SMAs, with selling pressure intensifying and pushing the price close to a key level at $30. This level was breached on June 15, with AVAX dropping to $29.99.
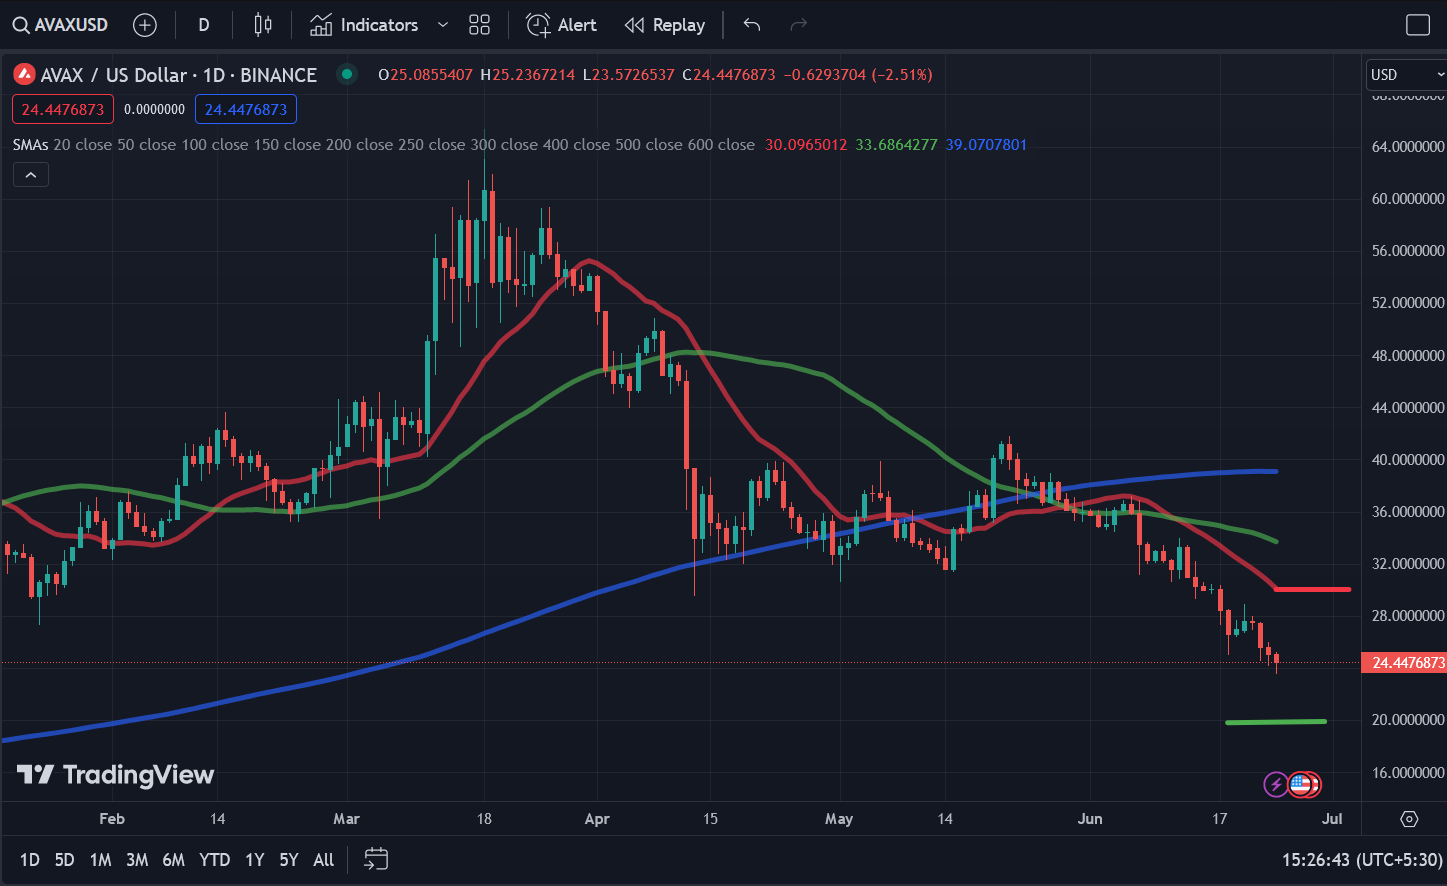
Source: TradingView
Currently, AVAX is trading at $24.50, with analysts expecting a further correction of between 40% and 60%, which will see AVAX drop below $20.
Dogecoin (DOGE) Price Analysis
Dogecoin (DOGE) has been consolidating above the crucial $0.12 level since dropping below the 200-day SMA on the 18th. Since then, DOGE has remained relatively stable, with the price registering minimal movement save for the 21st, when it saw considerable volatility. The consolidation came as a welcome relief after the cryptocurrency had faced a considerable decline since the beginning of the month when its price was above $0.16.
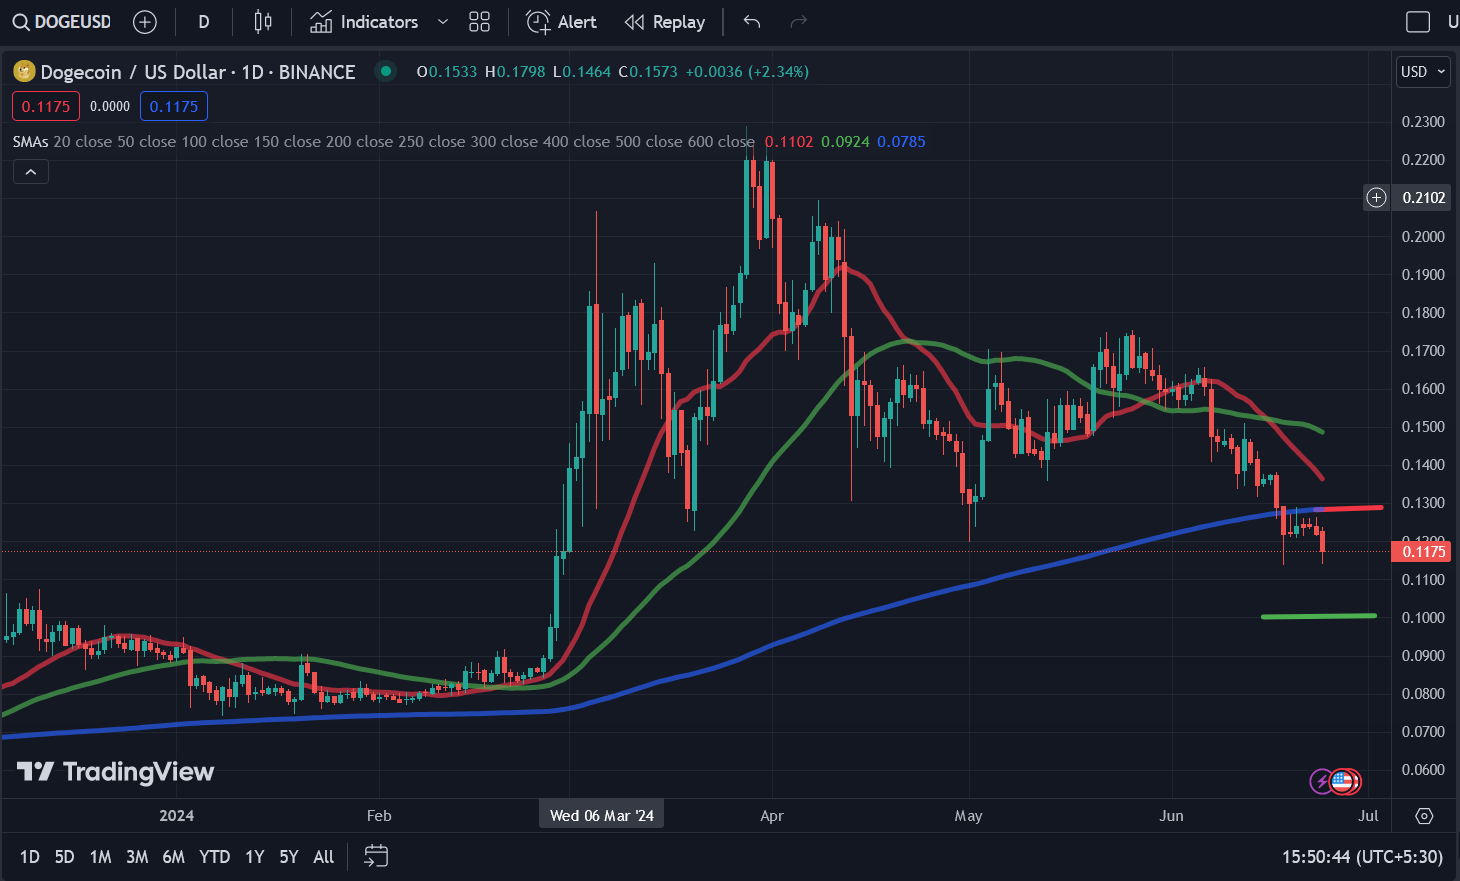
Source: TradingView
However, the current session has seen DOGE slip below $0.12. Analysts had predicted that if DOGE slips below $0.12, it could decline to $0.10 or even $0.08. Should DOGE recover, buyers will look to reclaim the $0.12 level and push DOGE above the 200-day SMA. DOGE’s current decline could be due to the fact that it was excluded from X payment filings.
TON Price Analysis
Toncoin (TON) has defied the larger cryptocurrency market and has been trading under a positive sentiment since the beginning of May. The bullish sentiment surrounding cryptocurrency is so strong that it set a new all-time high of $8.24 just nine days ago. As we can see from the price chart, TON has formed an ascending channel pattern, having registered an increase of nearly 16% over the past month.
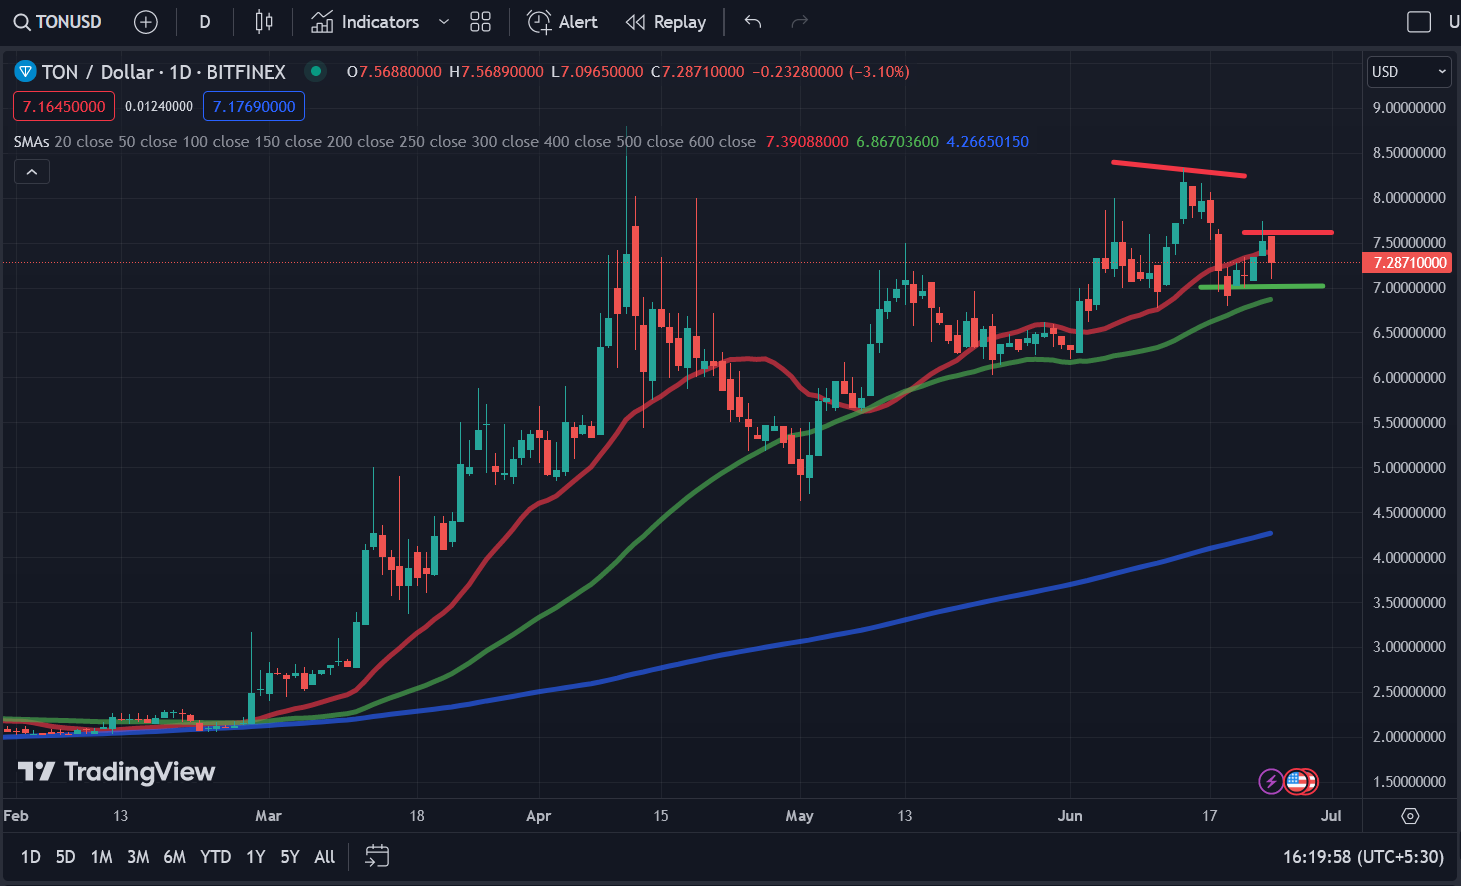
Source: TradingView
After reaching its all-time high, TON registered a sharp decline, dropping below the 20-day SMA on the 18th, a decline of almost 7%. However, buyers prevented TON from dropping below the 50-day SMA, indicating significant buying at this level. As a result, TON made a strong recovery, pushing up to $7.33 by the 22nd. An increase of 2.51% on Sunday (23rd) saw TON go past the 20-day SMA to $7.51. However, with strong resistance at this level, TON is down by 3.10% during the current session, with sellers in control. TON has support at $7, so the price could drop to this level should bearish sentiment persist. If sellers can regain control at this level, TON could test the 20-day SMA and the resistance at $7.50.
Internet Computer (ICP) Price Analysis
Internet Computer (ICP) has been on a downward trajectory, having shed 36% over the past month. The price has also seen considerable volatility, and with ICP trading below the 20, 50, and 200-day SMAs, it indicates strong bearish sentiment and a market in which sellers dominate, potentially leading to a further decline in price. Looking at the price chart, we can see ICP faces its first level of resistance around the $9.50 mark, which is where the 20-day SMA is currently placed. It also faces resistance at $11 and $12.50.
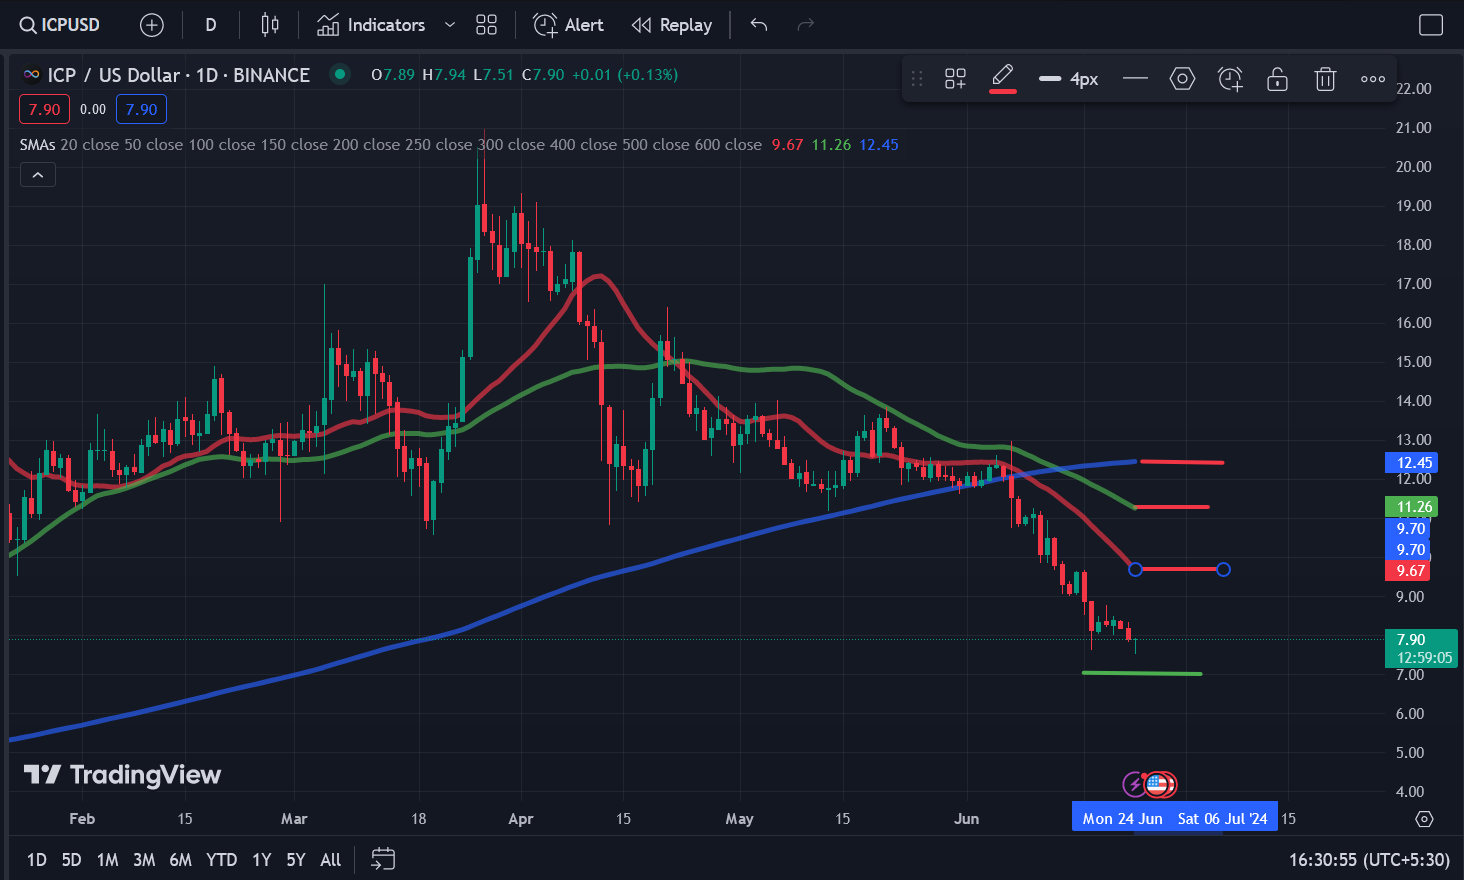
Source: TradingView
ICP’s drop in price also presents a buying opportunity for investors if they enter the markets at the opportune moment. A strong support level near the $7 mark could safeguard against further decline and may present an opportunity for buyers to enter the market.
HBAR Price Analysis
The HBAR price chart indicates a bearish market for the cryptocurrency as sellers look to retain control of the current session. HBAR has dropped by almost 30% over the past month and has been on a downward trajectory since mid-May. HBAR hit a low of $0.077 on the 23rd and dropped as low as $0.072 during the current session. If HBAR continues to drop, we could see a decline to $0.070.
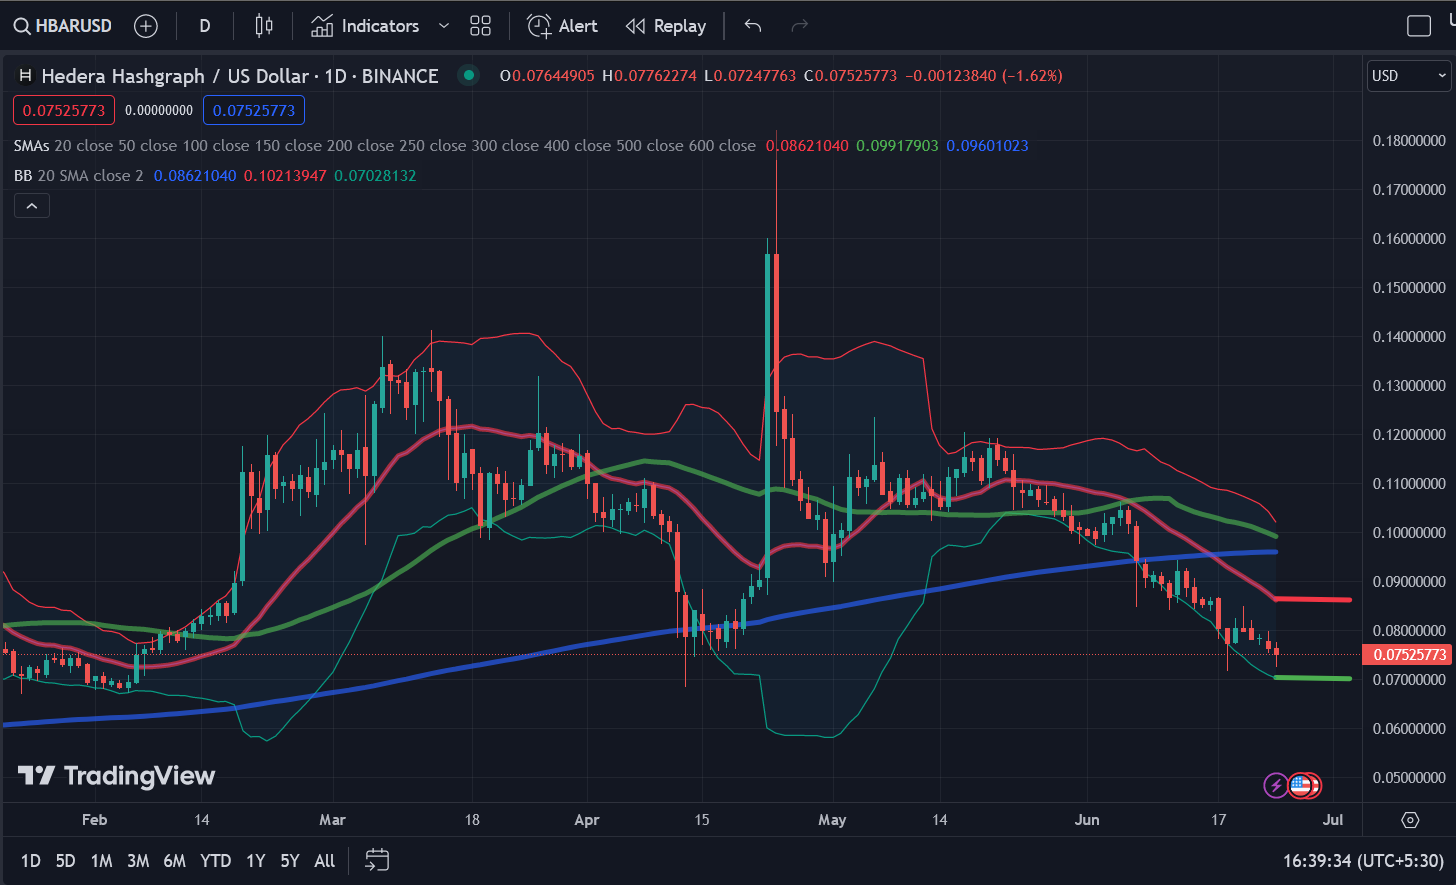
Source: TradingView
Render (RNDR) Price Analysis
Render (RNDR) had seen its price stall in the wake of the AI buzz waning. Since hitting $10.70 in the first week of June, RNDR has been on a downward trajectory that has seen sellers breach crucial support levels. A sharp decline on June 7 saw RNDR slip below the 20 and 50-day SMAs. Bearish sentiment has persisted through the month, with RNDR dropping from $9.57 to $7.02. The current session has seen buyers enter the market, with the price up by 1.47%. Should buyers continue to push the price higher, it could test the resistance at $7.50.
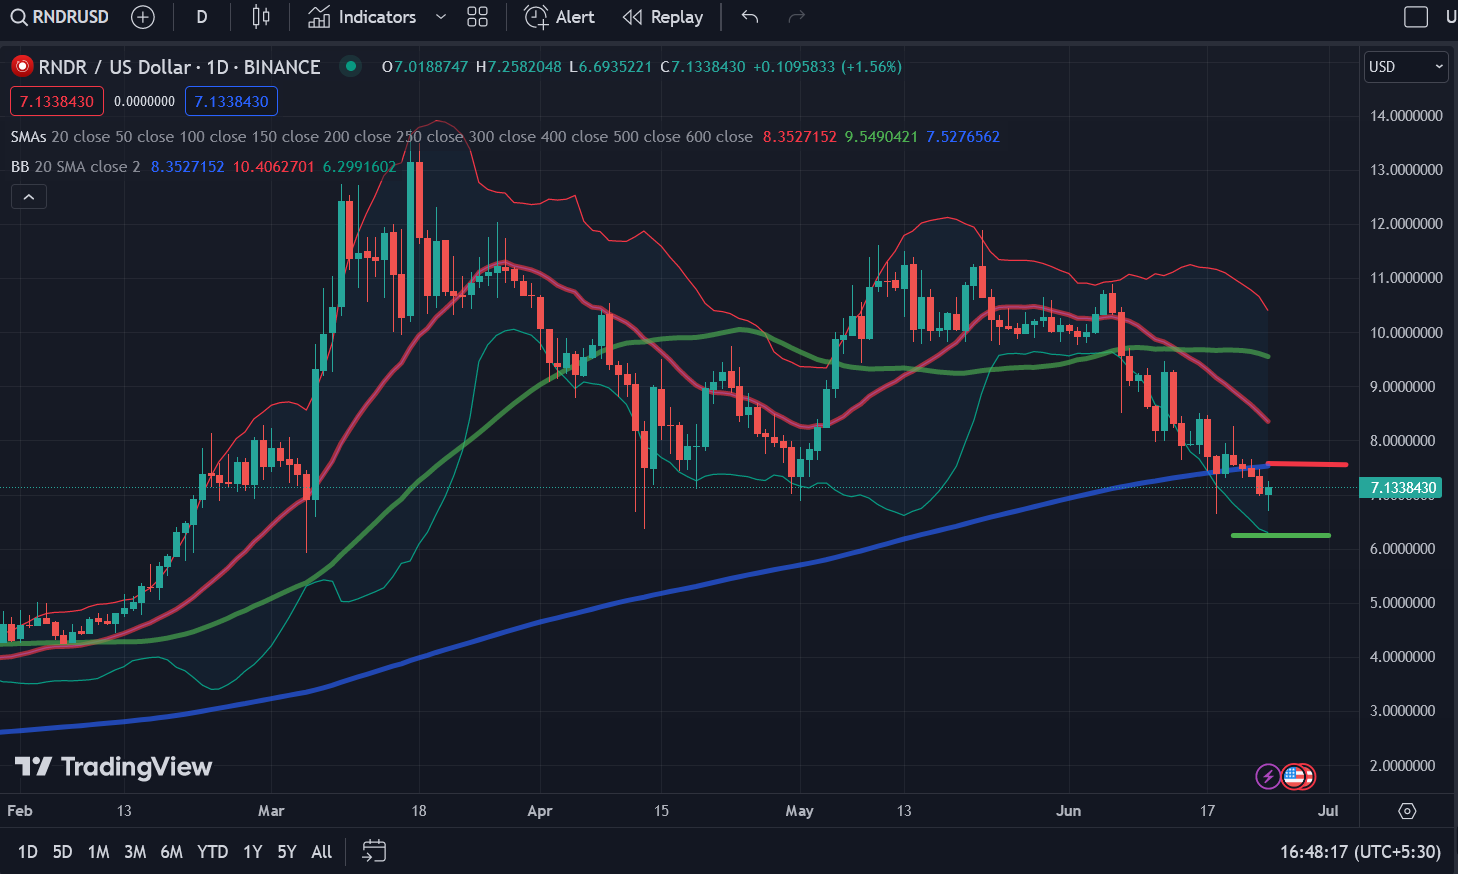
However, any return of the bearish sentiment could see RNDR drop below $7 and drop as low as $6.
Disclaimer: This article is provided for informational purposes only. It is not offered or intended to be used as legal, tax, investment, financial, or other advice.

Related Stories