Crypto Price Analysis 6/26 - BTC, ETH, SOL, BNB, TON, AVAX, ICP, APT, ATOM

The Bitcoin (BTC) price had rebounded above the $62,000 mark. However, traders are unsure if the cryptocurrency’s downturn is over. BTC is currently trading at $61,773.
BTC hit a six-week low on Monday, dropping as low as $58,474 before buyers propped the price to $60.330.
Analysts Predict Drop To $50,000
Some Bitcoin analysts have predicted the cryptocurrency could drop to $50,000. According to Markus Thielen, founder of 10x Research, Bitcoin appears to be following a double-top pattern and is currently testing its support level. A double-top pattern is formed when the price reaches two similar peaks, with a dip between them. The price maintains support above the common line, also known as the neckline, and typically falls by an amount equal to the distance between the two price peaks and the neckline.
“Bitcoin could shift from its current range trading (60,000-70,000) into a topping formation, potentially leading to a steeper decline. As we’ve observed over the past three months, range trading is a complex phase, often marked by several false breakouts.”
Thielen added that despite the potential positive impact of the US elections, BTC could experience an even steeper correction.
Bitcoin (BTC) Price Analysis
The Bitcoin price dropped to $58,474 on June 24, hitting a six-week low before buyers stepped in and pushed it back above $60,000. BTC eventually finished Monday at $60,330, down by 4.48%. However, Bitcoin has strong support at the $60,000 level, and with buyer interest rekindled at this level, the price rebounded on Tuesday, registering an increase of 2.52% and rising to $61,848. The current session sees BTC down marginally and trading at $61,628.
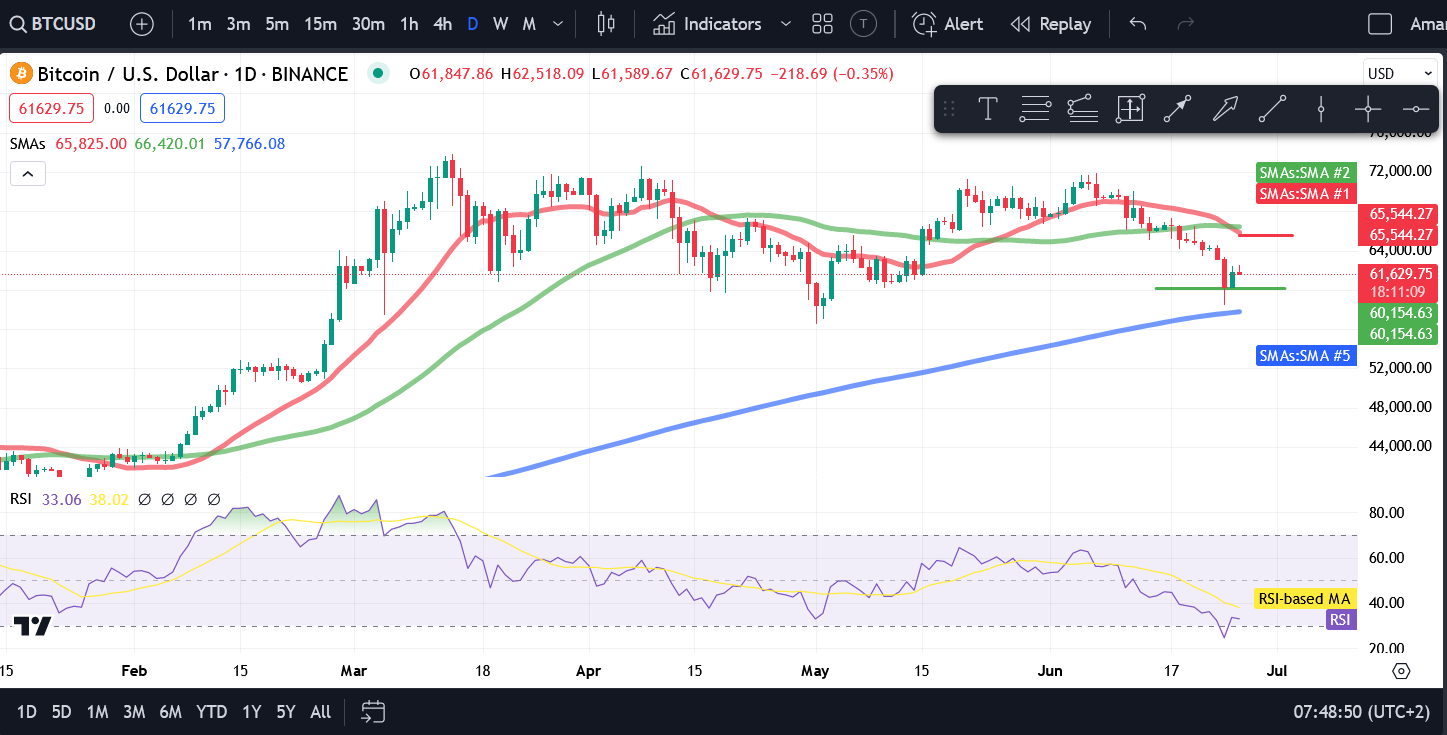
Source: TradingView
As mentioned earlier, Bitcoin has a strong level of support at $60,000. Should sellers take control, BTC could drop to $60,000, and the price could stabilize as buyers enter the market. A drop below $60,000 could lead to a greater correction, which could see the price drop to $58,000, a level where the 200-day SMA could support the asset. Conversely, if bullish momentum returns to the market, BTC could climb to $65,000. For the moment, BTC is looking to reclaim the $62,000 level. Looking at the RSI, we can see it had dipped below 30 briefly, indicating oversold conditions.
Bitcoin’s recent drop can be partly attributed to Mt.Gox announcing plans to repay its creditors in July.
Ethereum Price Analysis
Ethereum (ETH) had a fairly bearish weekend, dropping to $3,420 on Sunday and slipping below the 50-day SMA. The current week began with the bearish sentiment intensifying as ETH dropped as low as $3,241 before buyers stepped in and pushed the price back above $3,300, with ETH eventually ending Monday at $3,352. Tuesday saw ETH rebound from the $3,350 level, registering an increase of $1.30% to move to $3,395. The current session sees buyers and sellers struggling to take control, with ETH down marginally.
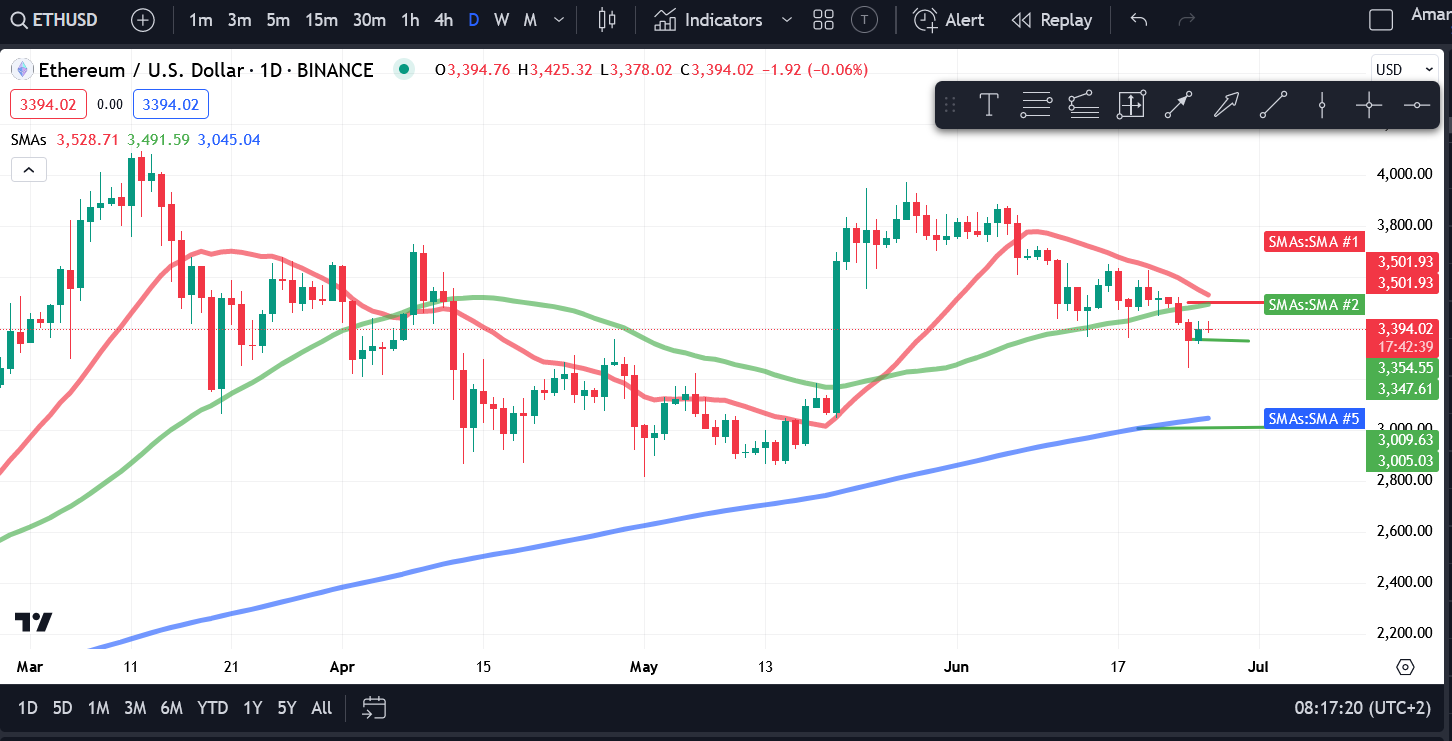
Source: TradingView
So, where does ETH go from here? As we can see from the price chart, ETH has strong support at $3,000. There is also a level of support at $3,350 and resistance around the $3,500 level. Should sellers take control of the market and breach $3,350, ETH could see a significant drop to the $3,000 mark, where the 200-day SMA could act as support and buyers could enter the market. If this level of support is breached, ETH could drop to $2,800. However, buyers could push ETH to $3,500 should bullish sentiment return. Should ETH get past this level, it could move to $3,600 if the resistance can be flipped to support.
Solana (SOL) Price Analysis
Has Solana (SOL) hit a turning point? SOL has dropped over 16% in the past month. However, the past couple of days have seen a strong showing by the Ethereum killer’s native token. SOL faced considerable selling pressure all of last week, ending it by dropping below the 200-day SMA on Sunday after registering a decline of 3.82%. This saw SOL drop below the crucial support level of $130, with the cryptocurrency settling at $128.63. As we can see from the price chart, this support level has been tested twice, with SOL rebounding both times. This time has been no different, with SOL posting impressive gains during the week.
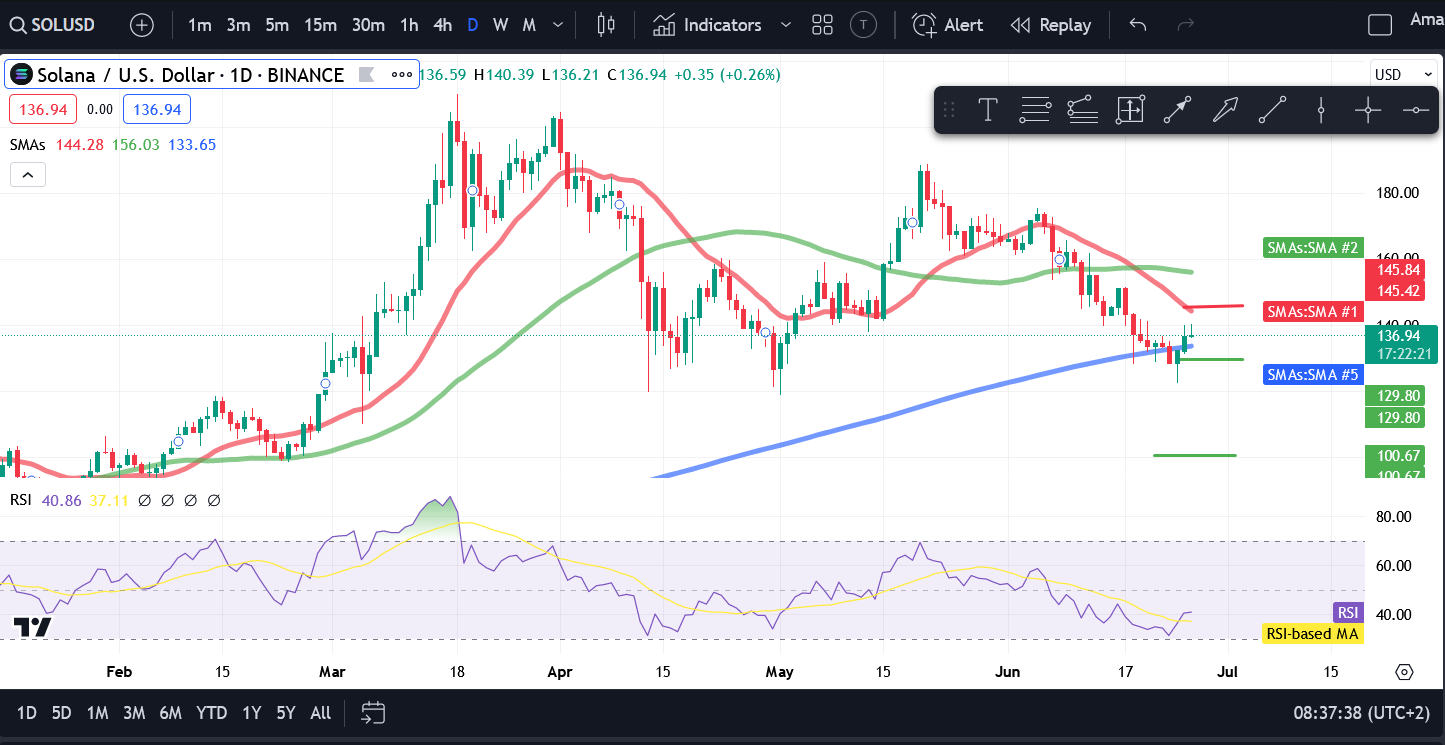
Source: TradingView
SOL started the current week facing intense selling pressure as sellers pushed the price as low as $122.38. However, buyers were able to stem the drop, pushing SOL back above $130. SOL eventually ended Monday at $132.33, just below the 200-day SMA. SOL’s bullish momentum picked up on Monday, as an increase of 3.22% saw SOL climb above the 200-day SMA and settle at $136.59. SOL had climbed to a high of $139 before sellers pushed the price back down. The current session sees SOL at $137.28, as it looks to move past $140. However, sellers are defending this level, as can be gauged from the price chart.
SOL’s recovery began on Monday after the price dipped below $130, prompting buyers to flood the market. $130 is a crucial level of support for the asset, with the 200-day SMA also acting as a dynamic level of support. Should SOL’s recovery continue and it gets past $140, it could climb to $150, where it faces its next level of resistance. A break above this level could set SOL on the path to $200 by the end of the year. However, sellers will attempt to counter this momentum. If they can push SOL below $130, we could see a drop to $100.
Binance Coin (BNB) Price Analysis
Binance Coin (BNB) has faced a steady decline since the middle of June, when it slipped below the 50-day SMA on June 16. That drop also saw BNB drop below $600. The previous week ended with BNB breaking below the ascending trendline support, indicating a strong bearish sentiment. Monday saw BNB drop to a low of $551.1 before buyers pushed the price back above $560, eventually settling at $568.2. BNB Tuesday saw BNB rebound, registering a 1.78% increase and settling at $578. The current session sees buyers and sellers struggling to control the market, with BNB down by 0.33%.
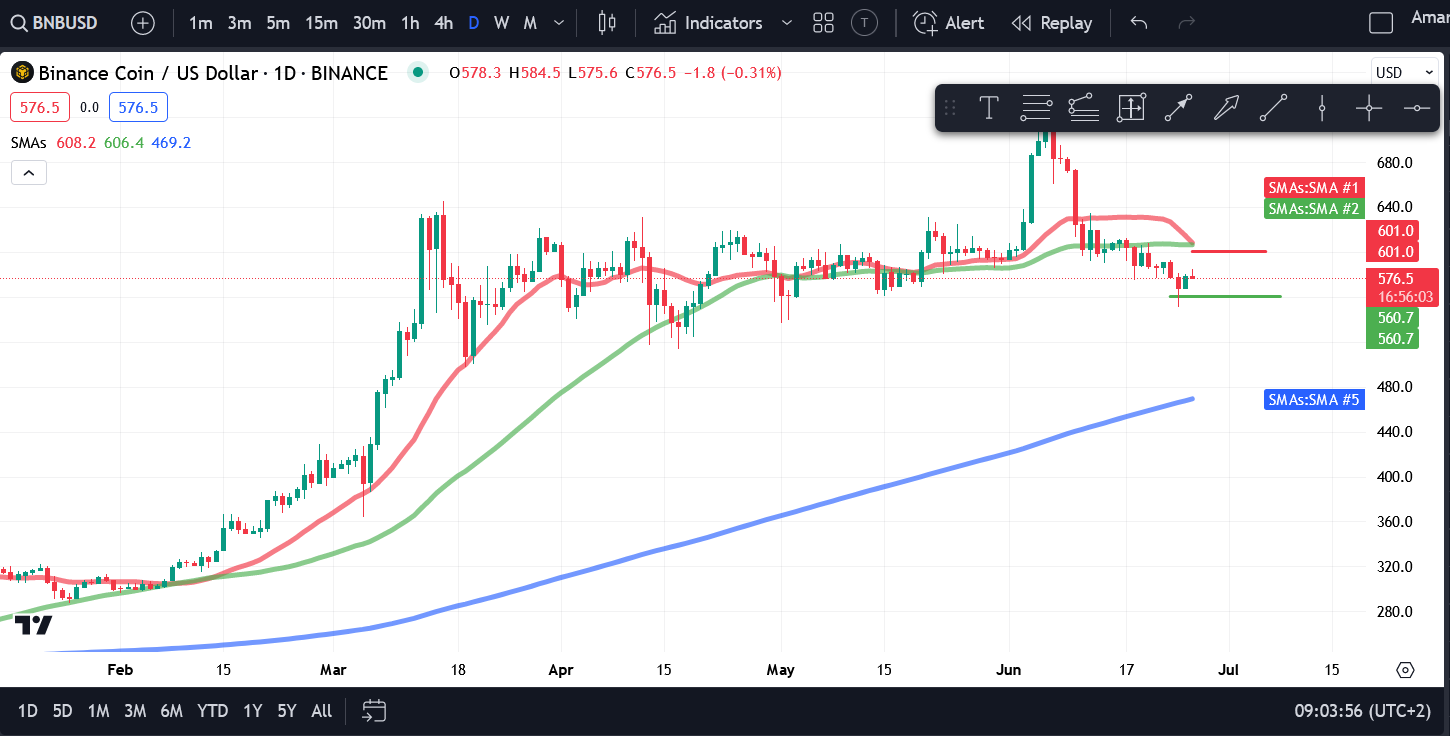
Source: TradingView
The price chart shows that BNB has support at $560, which was breached on Monday. However, buyers appeared to be around $550, allowing BNB to recover. Should bullish momentum build, we could see BNB test the resistance at $600. However, sellers will defend this level aggressively. Should bearish sentiment dominate, BNB could drop back to its support level. If this level is breached, BNB could drop to $500, or as low as $460, where the 200-day SMA could act as support.
Toncoin (TON) Price Analysis
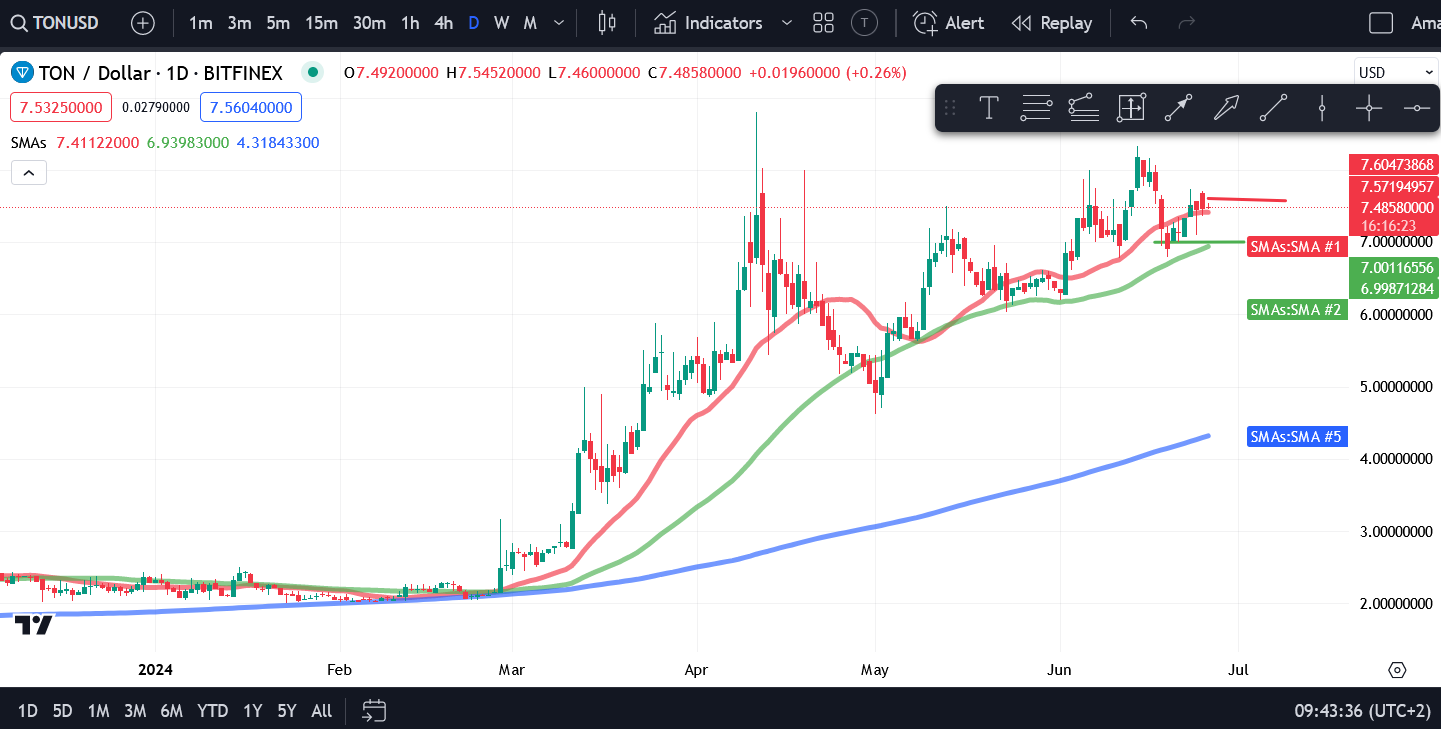
Toncoin (TON) set a new all-time high on June 14. Following that, TON witnessed a significant decline, dropping below $7 by June 19. Following this drop, TON made a strong recovery, rising above $7 and settling at $7.33, just below the 20-day SMA. Sunday saw TON push above the 20-day SMA, settling at $7.51. TON had reached a high of $7.73 on Sunday, but with strong resistance around $7.60, it could not sustain its bullish momentum, falling back to $7.51. This suggests sellers are aggressively defending this level.
Source: TradingView
As a result, the price dropped on Monday, falling to $7.46. TON has support at $7, where the 50-day SMA is also present. Should the price drop below the 20-day SMA, TON could see a drop to this level and rebound. Any upward momentum requires TON to move past $7.50 and $7.60. Should the price achieve that, we could see an uptick to $8 and a potential test of its all-time high.
Avalanche (AVAX) Price Analysis
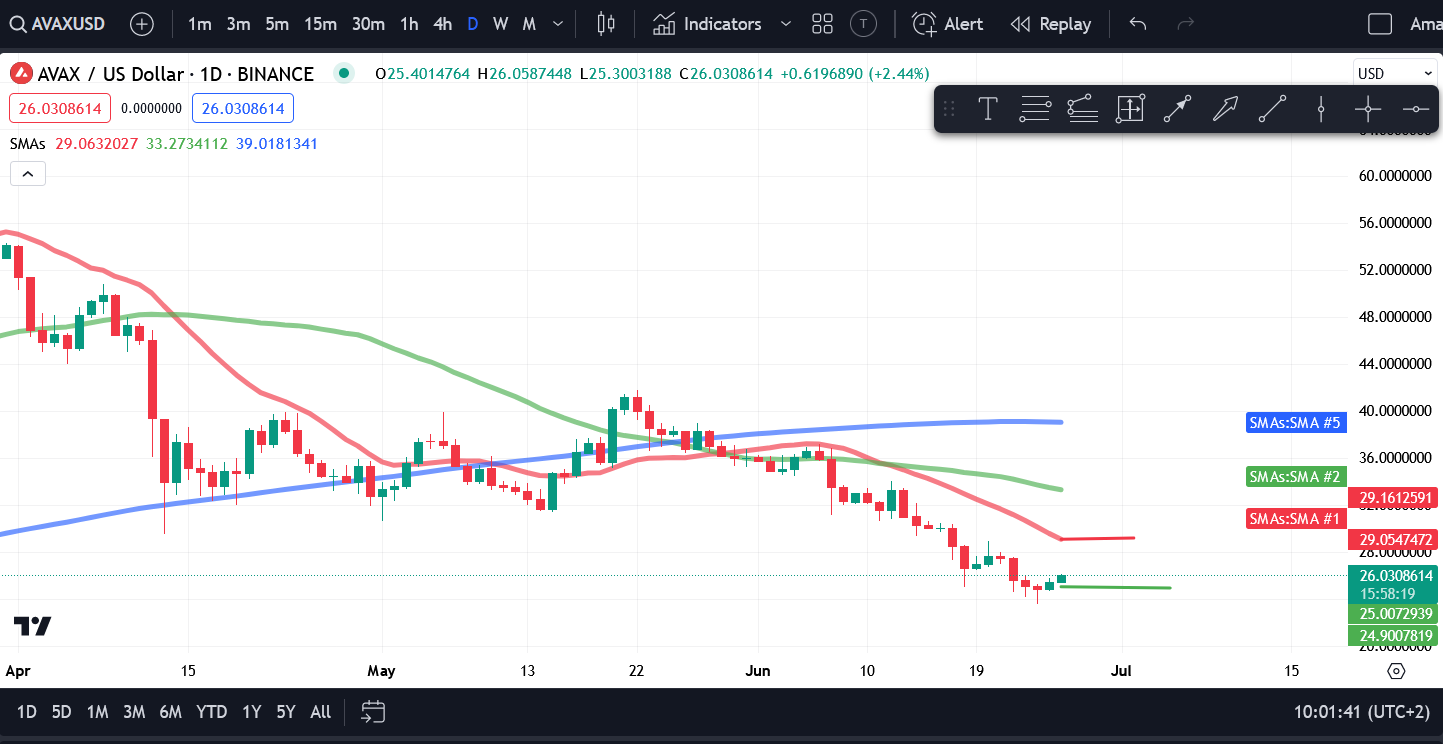
Avalanche (AVAX) has registered a decline of over 31% in the past month. This has seen the price drop from $41 to its current level of $25. The decline has also seen AVAX slip below the 20, 50, and 200-day SMAs, indicating significant selling pressure. AVAX dropped by nearly 7% on Saturday, dropping to $25.61. This drop pushed AVAX to test a critical support level at $25. Sunday and Monday saw drops of 2.12% and 1.07%, respectively, pushing DOT to $24.80. This is a low not seen since December 2023.
Source: TradingView
However, AVAX rebounded from this level, rising by 2.43% on Tuesday, pushing back above $25 and settling at $25.41. The current session sees AVAX up by 2.41%, with buyers firmly in control. But will AVAX be able to sustain this momentum? If AVAX continues its upward trajectory, we could see an increase to $29, where the 20-day SMA could act as resistance. Should AVAX move past this level, it could move to $30. However, should sellers breach the support at $25, AVAX could see a slide to $20.
Internet Computer (ICP) Price Analysis
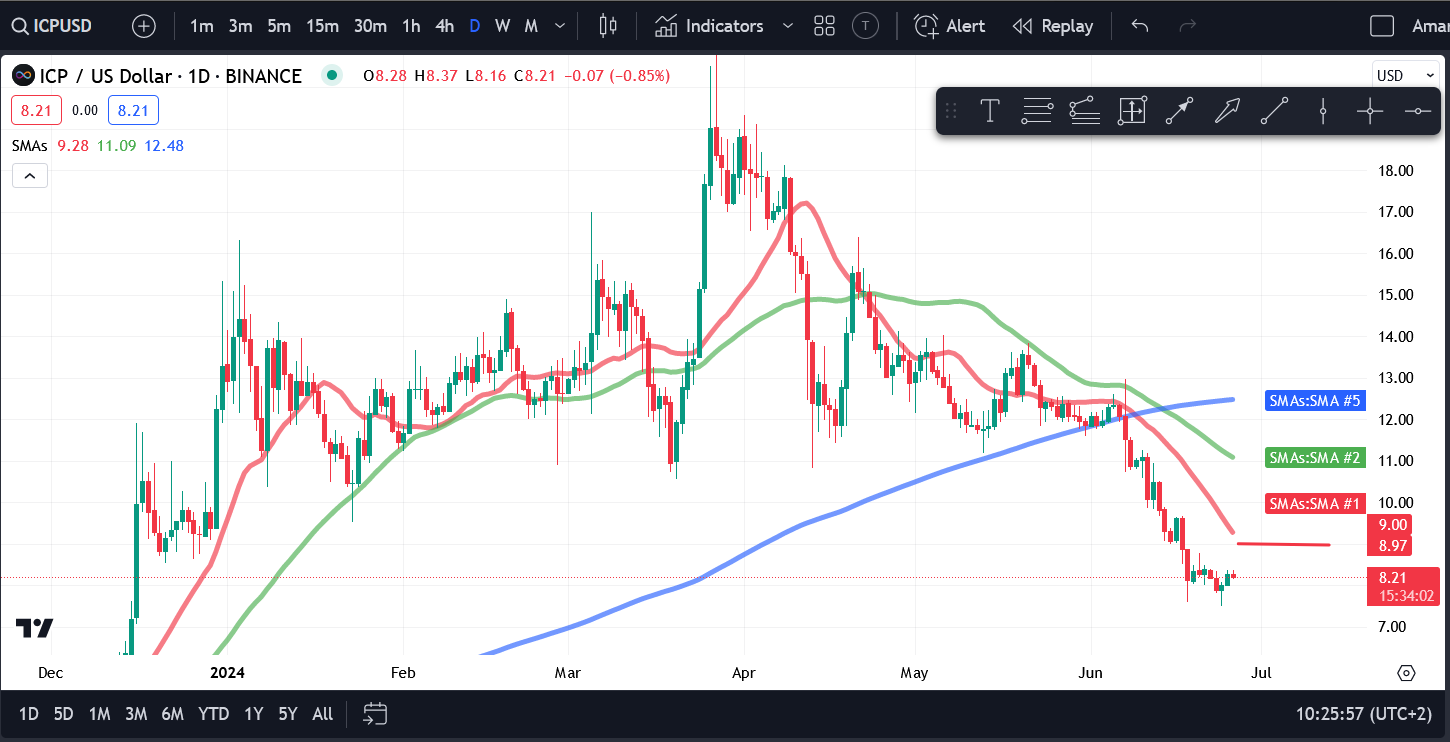
Internet Computer (ICP) has been on a downward trajectory since hitting $19.02 in March. The cryptocurrency has seen a drop of 33% over the past month, indicating considerable bearish sentiment. On Sunday, ICP slipped below $8 after registering a drop of 3.66% to settle at $7.89. It also faced considerable selling pressure on Monday, dropping to a low of $7.51. However, buyers entering the market at this level were able to push the price back above $8. ICP’s upward momentum continued on Tuesday, registering an increase of 3.24%. The current session sees the price down by 0.85%.
Source: TradingView
ICP faces a strong level of resistance at the $9 level. Any significant upward momentum would require a move past this level. Should this happen, we could see the price go back above $11. Any bearish momentum could result in the support at $8 being tested again. Should this fail to hold, a drop to $7 is likely. A strong level of support at $7 could prevent further drops and allow buyers to enter the market.
Aptos (APT) Price Analysis
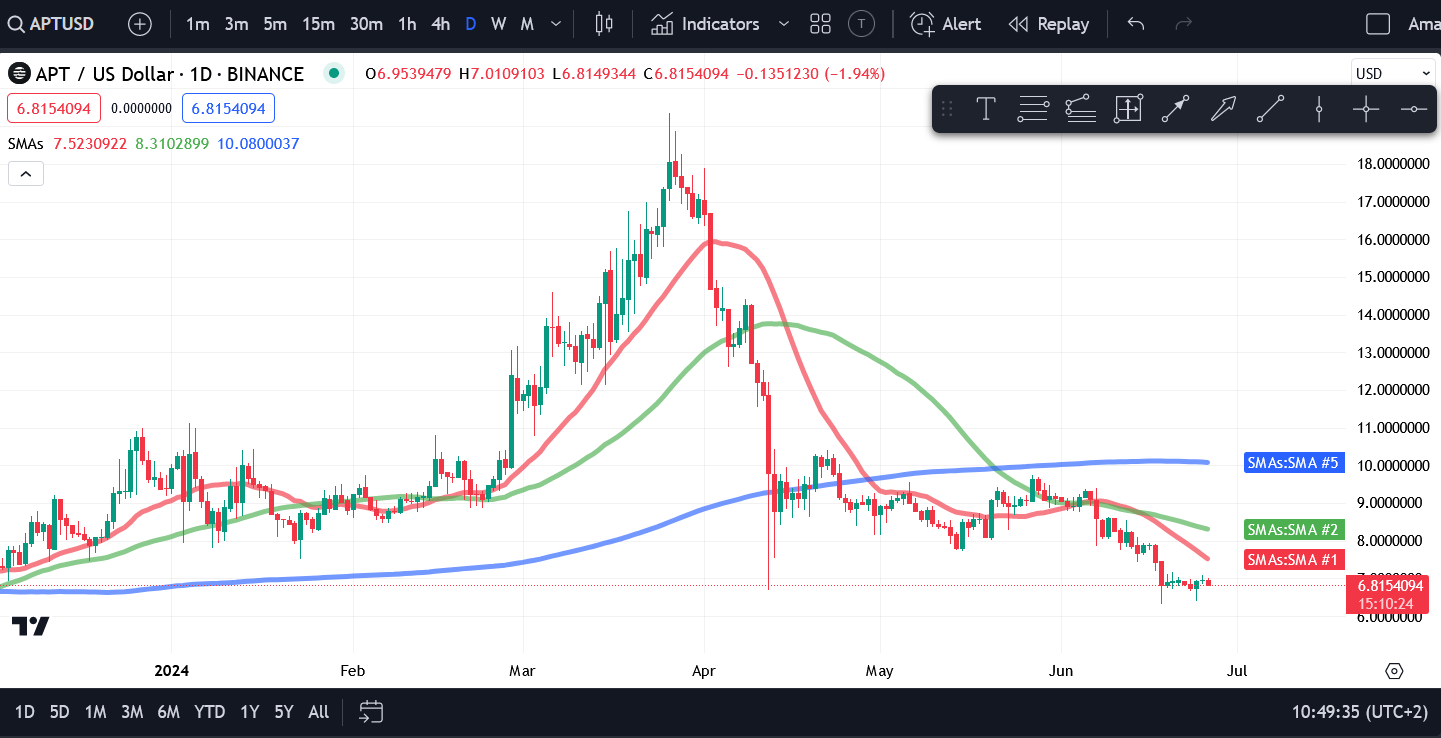
Aptos (APT) is another cryptocurrency on a downward trajectory, in line with the rest of the market. APT had hit a high of $19.34 in March, nearly testing its all-time high. However, it could not get past $20 and had fallen below $10 by the middle of April. The asset encountered a period of choppiness, with the price oscillating between $7.50 and $10. The first week of June saw selling pressure intensify, with APT dropping from $9.13 to below $7 by June 18.
Source: TradingView
Since then, APT has seen some consolidation, with the price hovering between $6.50 and $7. Should bearish sentiment intensify again, we could see a drop towards $6. However, analysts are quite bullish on APT, predicting it could reach $13 by the end of the year. Any significant movement towards this scenario would require APT to reclaim the $10 level.
Cosmos (ATOM) Price Analysis
Cosmos (ATOM) is currently trading around $6.83, having shed almost 20% over the past month after remaining range-bound since April. After dropping to $6.69 on Sunday, ATOM registered an increase of 2.11% on Monday, rising to $6.83. However, this came after the cryptocurrency faced significant selling pressure, dropping to a low of $6.40 before recovering. Tuesday saw buyers continue to push the price higher, with ATOM rising to $6.94.
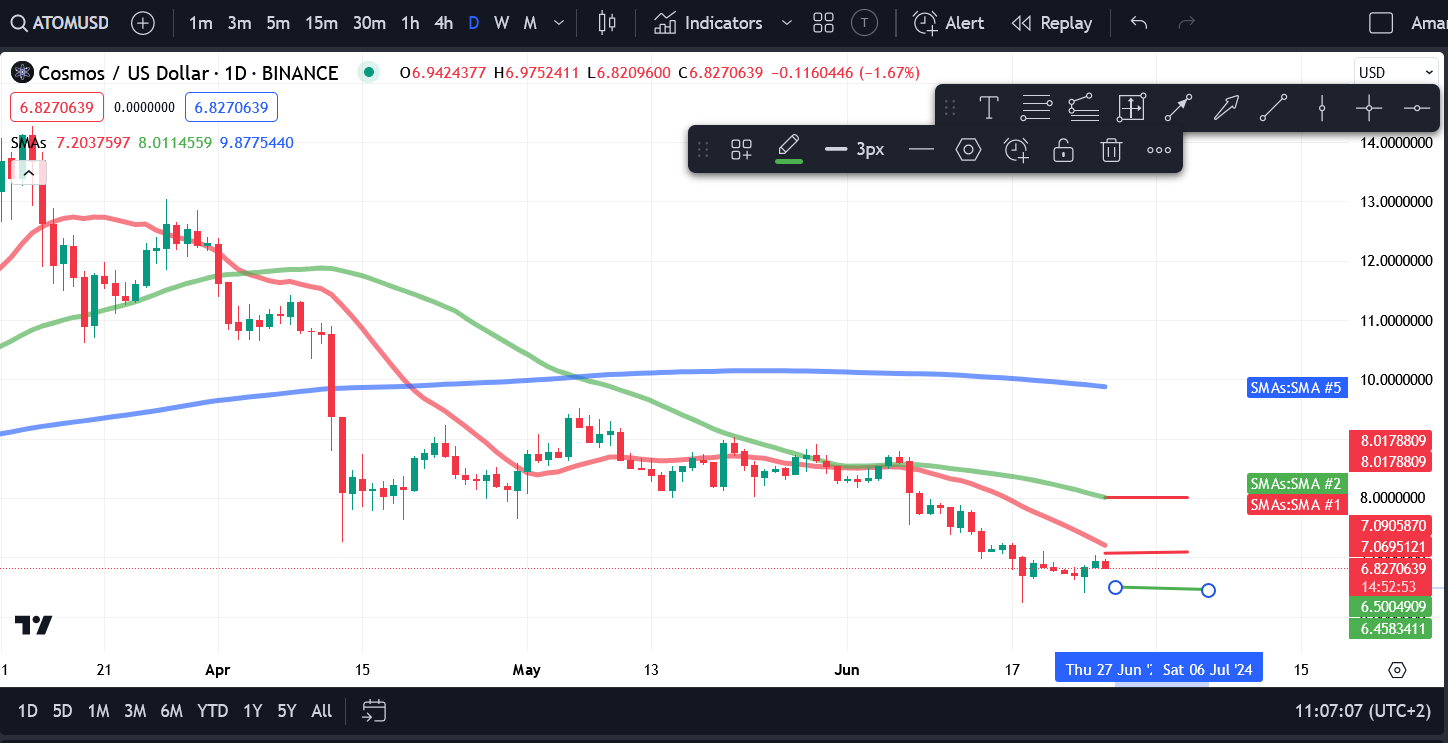
Source: TradingView
ATOM is facing resistance at $7, with the 20-day SMA also acting as a dynamic resistance level. If ATOM wants to flip the current bearish sentiment, it must move past $7 and the 20-day SMA. Should this happen, ATOM could test $8 and the 50-day SMA. There is support at $6.50, which has been tested twice this month and has held both times, indicating strong buying pressure. Should this level be breached, ATOM could drop towards $6.
Disclaimer: This article is provided for informational purposes only. It is not offered or intended to be used as legal, tax, investment, financial, or other advice.

Related Stories