Polkadot Price Analysis: DOT Sits Above Crucial Support With Upside Locked By 20-Day SMA

Polkadot (DOT) is facing bearish pressure, with bearish sentiment prevailing for most of the current week.
Polkadot has registered a significant surge in user growth, with new users being onboarded at a considerably high pace. Analysts hope this could help revive the recent slide in the DOT price.
Is DOT In A Downward Trend?
Looking at the DOT price chart, we can see that it has been on a downward trajectory since the 15th of March when it hit a recent high of $11.80. In fact, DOT has registered a decline of over 22% over the past month. However, if we look at its fundamentals, Polkadot has been onboarding users at a frenetic pace, according to data from its Parity Data dashboard. While network activity has remained subdued in recent months, onboarding new users makes a strong case for the growing adoption of the Polkadot Network.
New Additions
The network saw a significant spike in new users, with active wallets exceeding 600,000 in March and unique accounts hitting a staggering 5.59 million, primarily thanks to Polkadot’s developer-friendly Parachains such as Moonbeam. However, transaction volumes have yet to mirror the growth in user numbers. With the lack of user engagement, it can be speculated that users are holding or staking their DOT tokens instead of actively using them for transactions.
DOT Price Analysis
DOT is currently trading at $8.37, indicating a decline of $1.27% over the past 24 hours. DOT started its last major uptrend in October last year, seeing its price go from $3.70 to $9.19 by the 25th of December. Following this, DOT entered a bearish phase and saw its price drop to $6.33 by the 22nd of January. However, bearish sentiment returned as DOT entered another major uptrend that culminated on the 14th of March, with its price hitting $11.80. However, sentiment has changed considerably since bears began dominating the market. This bearish turn can be seen in the price chart shown below, with DOT facing considerable downward pressure since its recent high.
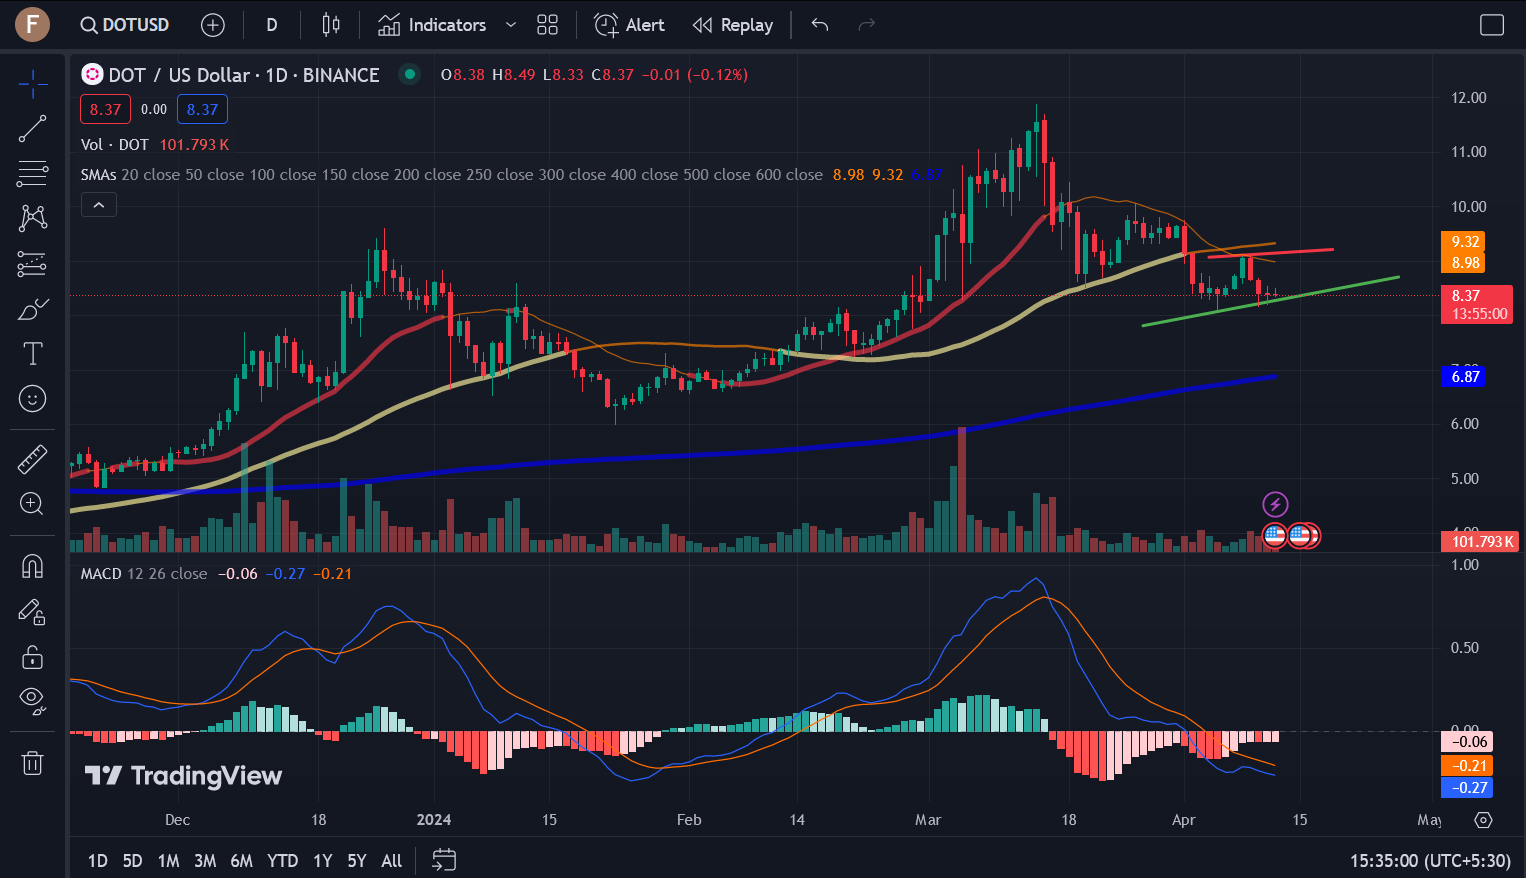
By the 16th of March, DOT had dropped below the 20-day SMA, falling to $8.77. The 50-day SMA acted as support, helping DOT make a marginal recovery. However, with the 20-day SMA acting as resistance, DOT could not sustain its recovery, dropping to $8.58 and then below the 50-day SMA to $8.43, where the price found support.
Thanks to the 20-day SMA, DOT is facing resistance at $9. Support at $8.40 is also being tested. Should the price drop below this support level, DOT could slump to $8. However, should DOT recover, it could test the resistance at $9 once again.
Will Bullish Sentiment Return?
Buyers and sellers are struggling to take control of the current session, with DOT having found support at $8.40. However, the markets are currently bearish, as indicated by the MACD. So, will bullish sentiment return? At present, it seems unlikely. However, if DOT is able to recover and move past the resistance at $9, we could see the bulls swoop in and push DOT toward $10.
Disclaimer: This article is provided for informational purposes only. It is not offered or intended to be used as legal, tax, investment, financial, or other advice.

Related Stories