Bitcoin (BTC) rejected from $73,000 - next attempt inbound

Bitcoin just failed to claim another all-time high when the $BTC price was rejected from $72,600 on Monday. A 4.5% pullback has resulted. Will the price pull back further, or is bitcoin ready to make its next attempt at a new all-time high?
Strong ETF outflow on Monday drags on $BTC price
Perhaps bitcoin needed to draw breathe for its next assault on $73,800, or maybe it was the strong red day for the Bitcoin ETFs on Monday which saw a large outflow from the Grayscale ETF (GBTC) of $303 million, which Blackrock (IBIT) was not able to match. The net outflow for the day was $223 million.
$BTC price returns to confirm top of bull pennant
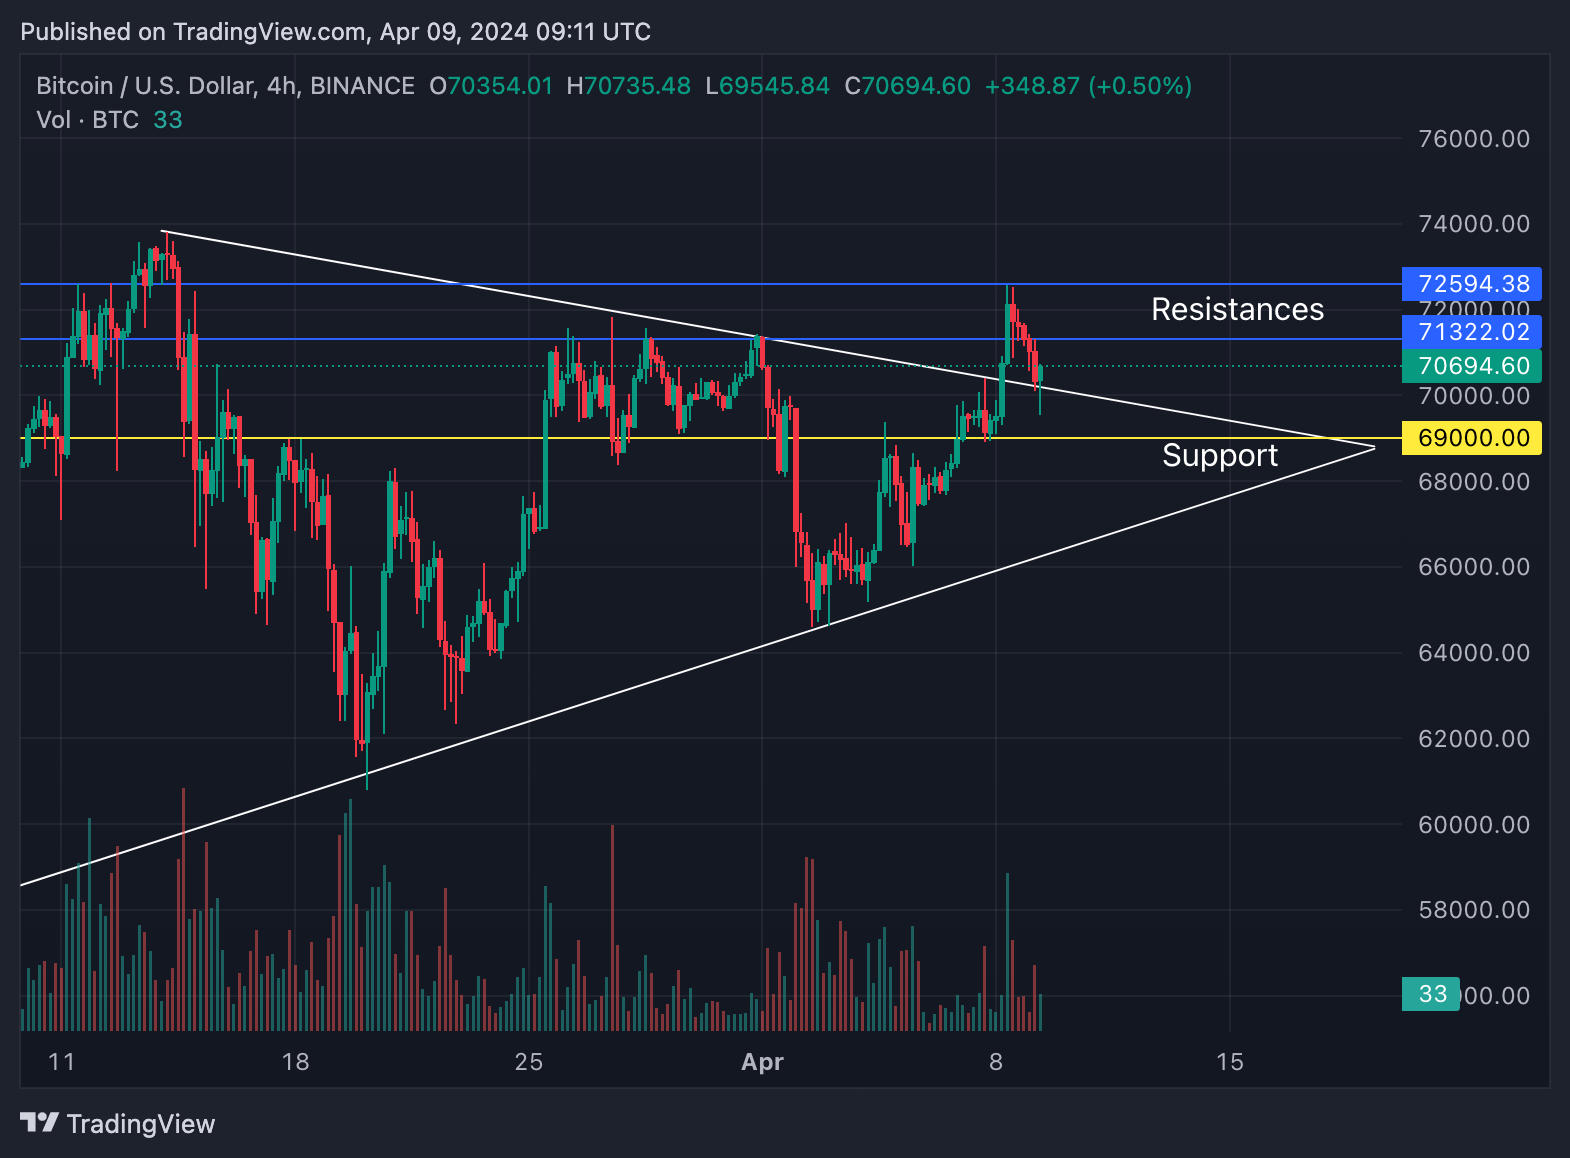
Source: Coingecko/Trading View
Observing the short term, 4-hourly time frame, what has happened to the $BTC price looks quite straightforward. The rejection from the resistance at $72,600 was a reasonable thing to happen, and the price went all the way back to confirm the top of the breakout triangle.
The $69,000 main support awaited inside the triangle, but this was not needed given that the upper triangle trend line held the price. It now remains to be seen whether the $BTC price will see some sideways price action for a while, in order to give the shorter term stochastic RSI momentum indicators time to reset.
Weekly candles indicate tug of war between bulls and bears
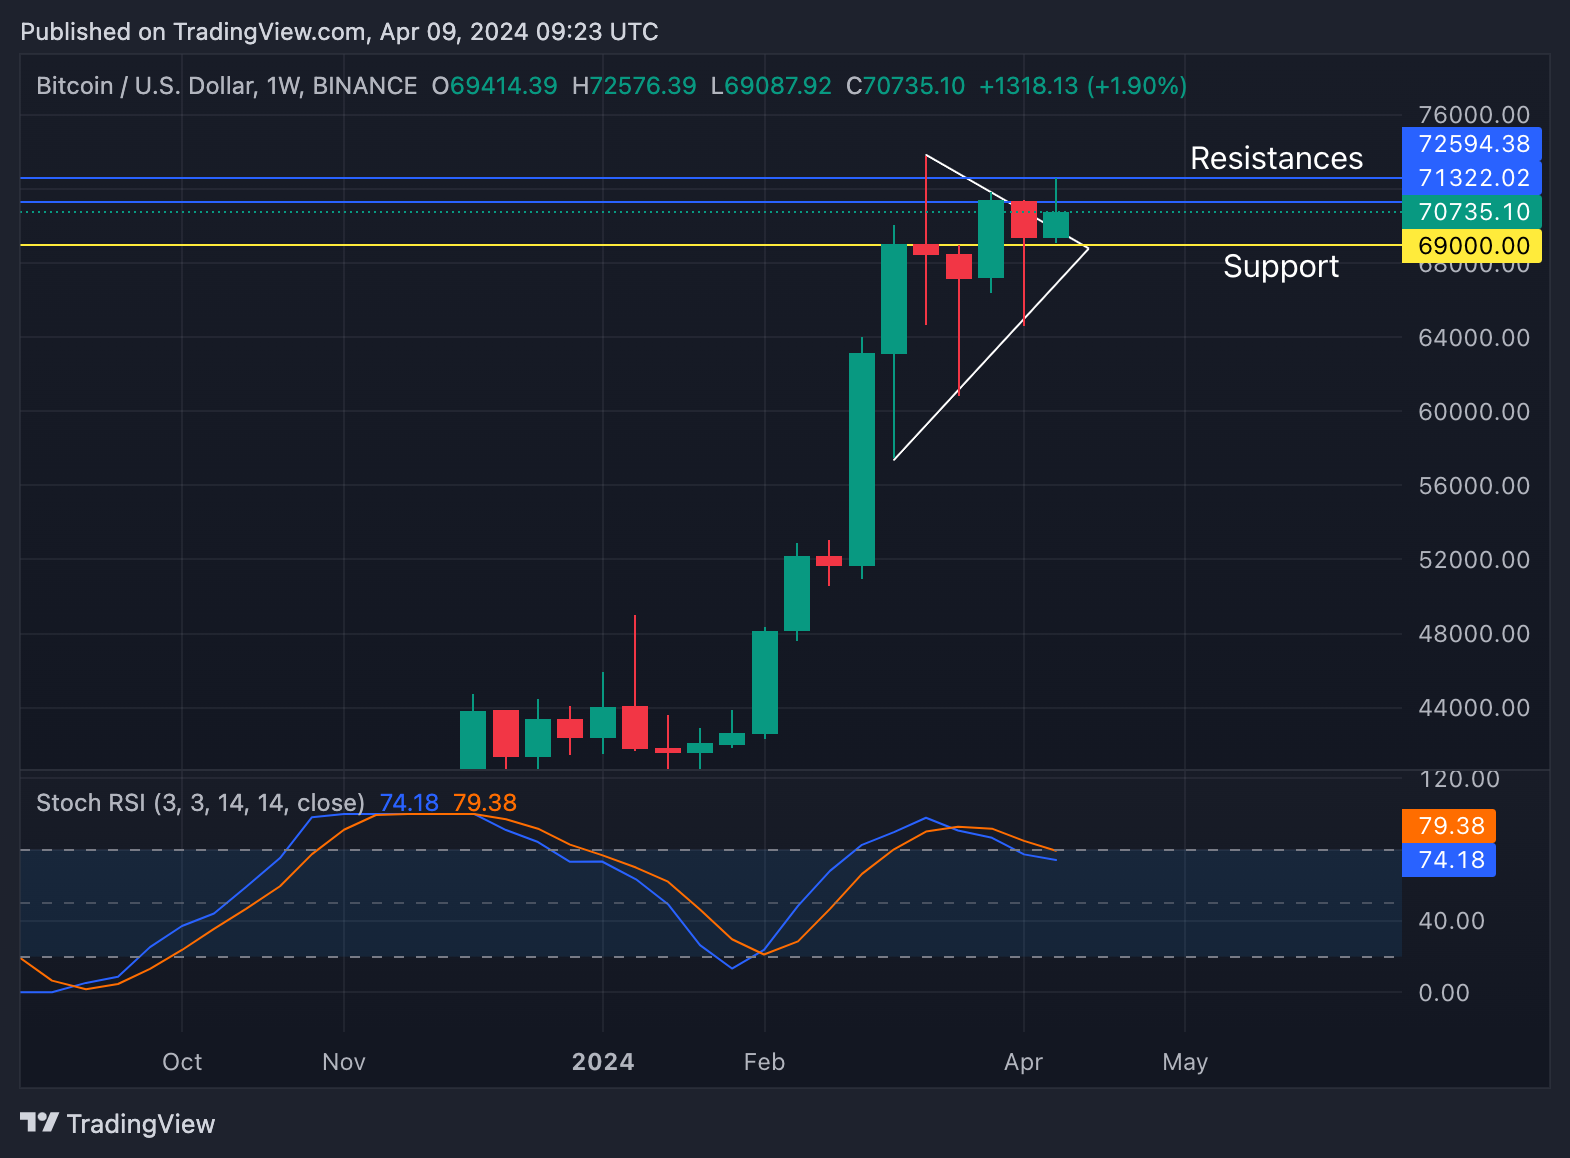
Source: Coingecko/Trading View
The larger time frame of the weekly tells quite a story via the candles. The red candle that marked the new all-time high suggests a battle royale between the bulls and the bears, and ended in indecision. The next candle wrested control from the bears given that it was a bullish hammer candle. The long wick below shows how rapidly the price was bought up by the bulls.
The next candle was a green engulfing candle, which gave the bulls continued time in the driving seat, and then last week a hanging man candle was printed. This possibly gives the bears a chance to regain control because this is usually a reversal candle.
Therefore, much depends on this week’s price action. A close above the hanging man candle can nullify it, and possibly signal a break upwards out of the current consolidation phase.
Much can also be made of what happens with the stochastic RSI on the weekly. It currently looks like the signal lines are flattening, which could be a sign that they are going to turn back up. If this takes place, a very likely continuation of the bullish trend can be the result.
Disclaimer: This article is provided for informational purposes only. It is not offered or intended to be used as legal, tax, investment, financial, or other advice.

Related Stories