Bitcoin ETF inflows regain strength - $BTC trend remains up

The five successive days of $BTC outflow, driven by the Grayscale Spot ETF selling, have now been cancelled out by a $418 million inflow on Tuesday. It’s now just a matter of time before the Grayscale outflows diminish drastically, and the bitcoin buying picks up pace again.
For five straight days the Grayscale Bitcoin Spot ETF (GBTC) sold $BTC massively into the market, at the same time as inflows in the other 9 Spot Bitcoin ETFs dried up. What did the bitcoin price do? It went up.
Who else is buying bitcoin?
Much of the $BTC buying and selling focus is on the Spot Bitcoin ETFs, and Grayscale has sold more than $500 billion in $BTC since 11 January, which equates to nearly half of all the $BTC it held. What is amazing to think, is that this amount of $BTC has been sold in a matter of two months.
Despite the fact that the other Spot Bitcoin ETFs have bought dramatically more than this amount, (Tuesday saw a $418 million net inflow) it must be wondered who was buying over the five days when these 9 ETFs were making very low purchases?
The answer is that adoption is beginning. The smartest people in the world are now probably fully cognizant of bitcoin, and they will know that it will not take very many billionaires to start buying before the supply starts to disappear rapidly.
Already, the daily mined supply of bitcoin is bought up many times over, and that is just by the Spot Bitcoin ETFs. Throw Mr 100 into the mix, and the fact that the supply is about to be cut in half in April, and you have a truly explosive supply shock in the making.
Bitcoin’s next move taking shape
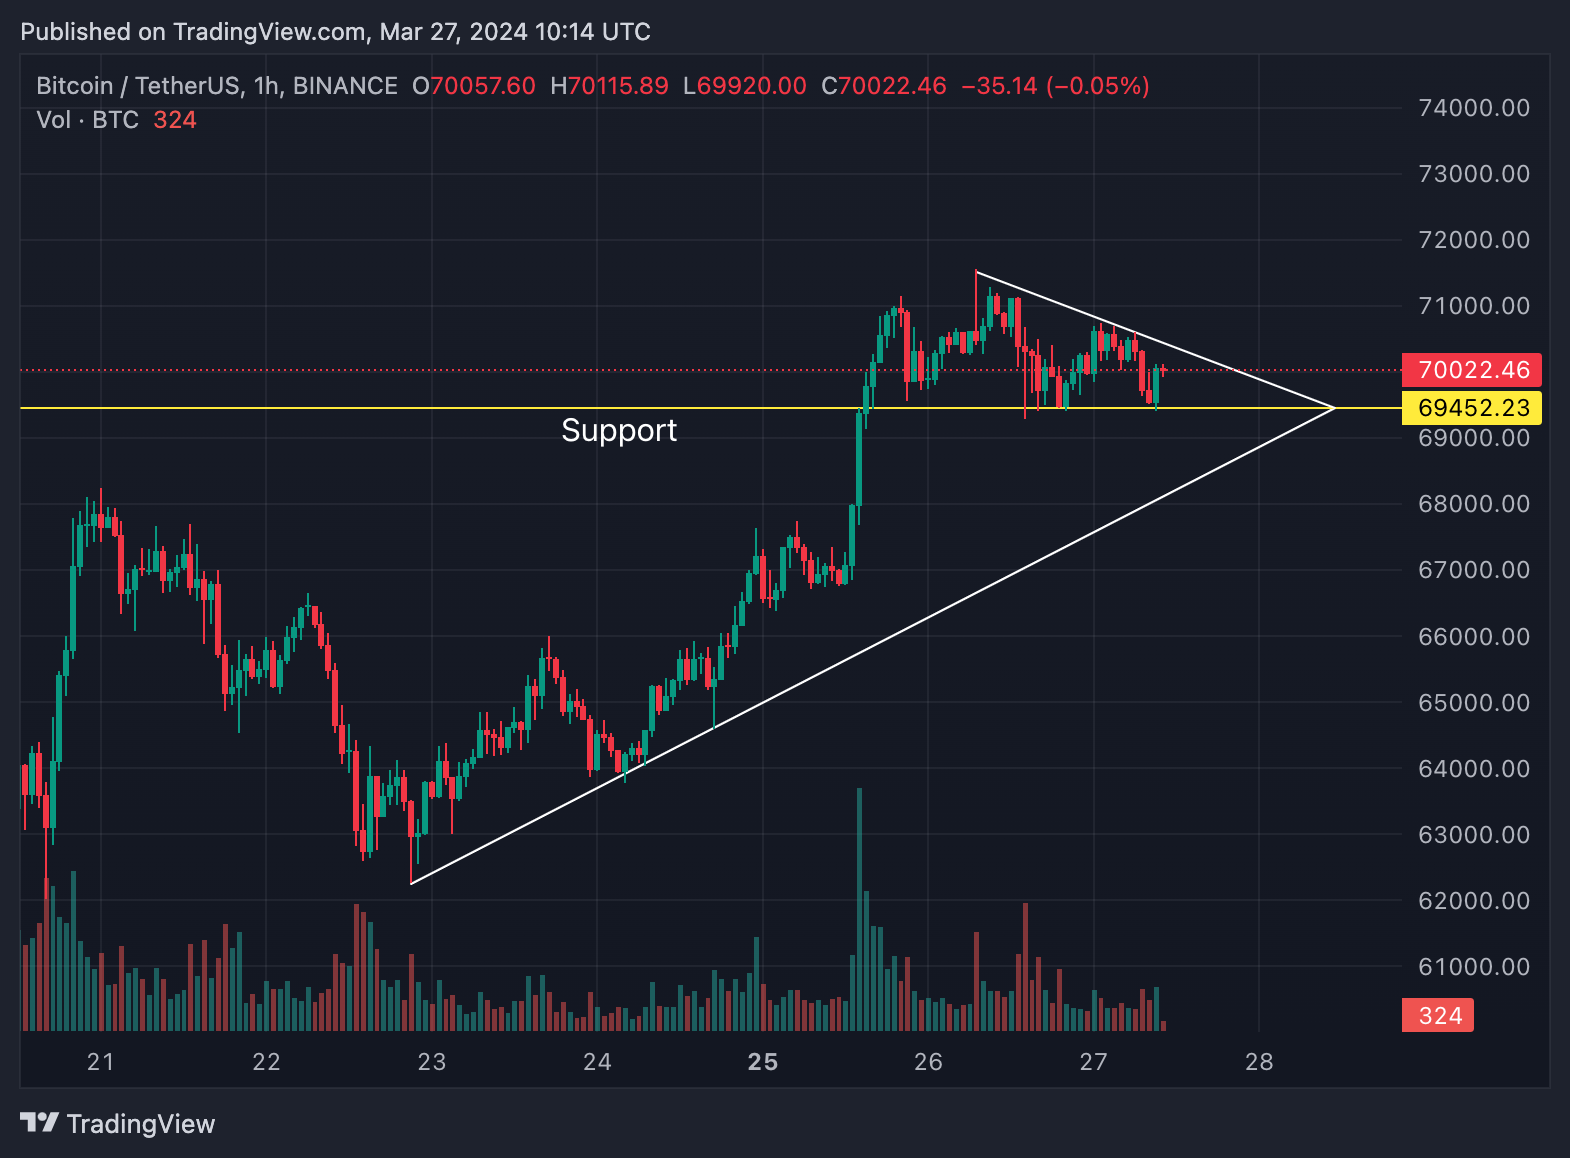
Source: Coingecko/Trading View
Looking at the $BTC price in the very short hourly time frame, it can be observed that the price is traversing along support at $69,450. However, the price is being squeezed down by the trend line above, and this is forming a descending triangle, which is a bearish chart pattern.
The price could possibly break down below the support, but then be held up by the trend line, plus further support below. As long as the price were to remain within this bigger triangle, and not fall through and take hold below $68,000, an upside break could be a distinct possibility.
Bitcoin inverse head and shoulders pattern playing out
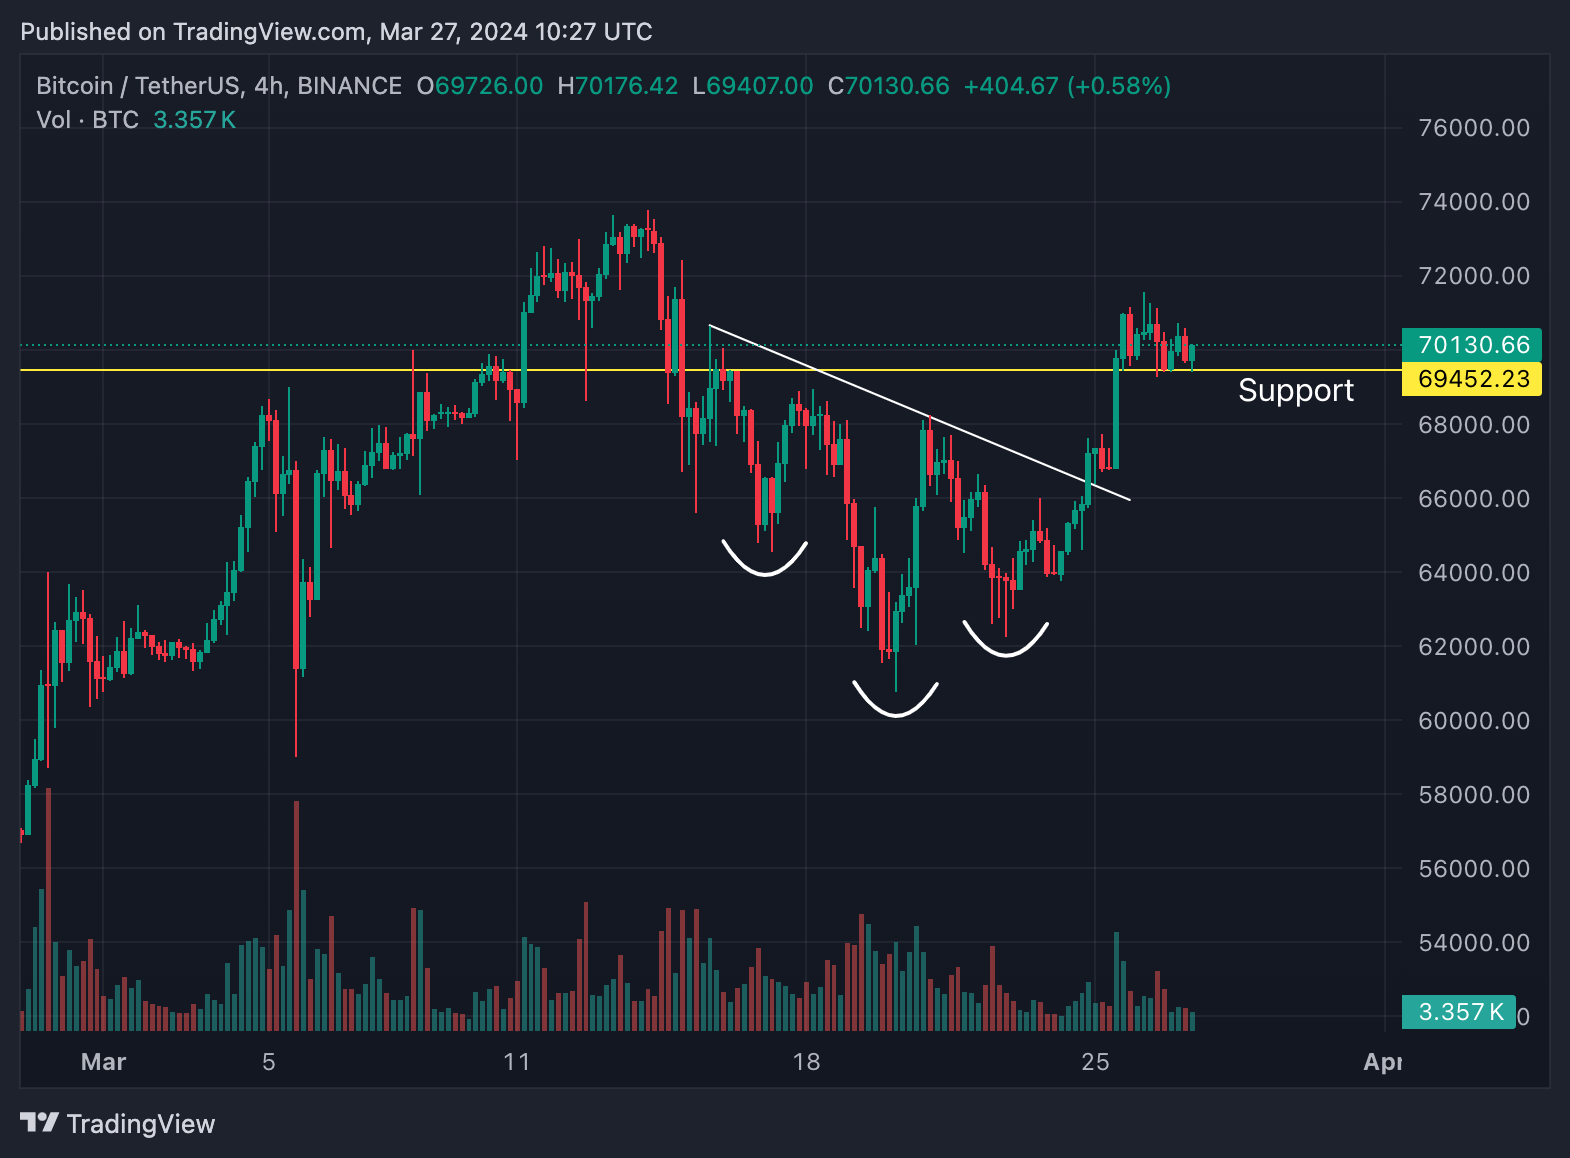
Source: Coingecko/Trading View
Zooming a little further out into the 4-hour time frame, it should be noted that the bitcoin price is also currently playing out a bullish inverse head and shoulders pattern. The neckline has been broken to the upside, and it just remains for bitcoin to complete the pattern, which would take it to just over $74,000, and consequently, another new all-time high.
If $BTC can get to $74,000 and form a base range from here down to $69,000, the resulting price structure could be built upon for the next stage of this bull market, which could be another sharp move to the upside.
Disclaimer: This article is provided for informational purposes only. It is not offered or intended to be used as legal, tax, investment, financial, or other advice.

Related Stories