Bitcoin (BTC) Price Analysis: Clouded Technical Bias – 18 January 2024
Bitcoin (BTC) Price Analysis: Clouded Technical Bias – 18 January 2024
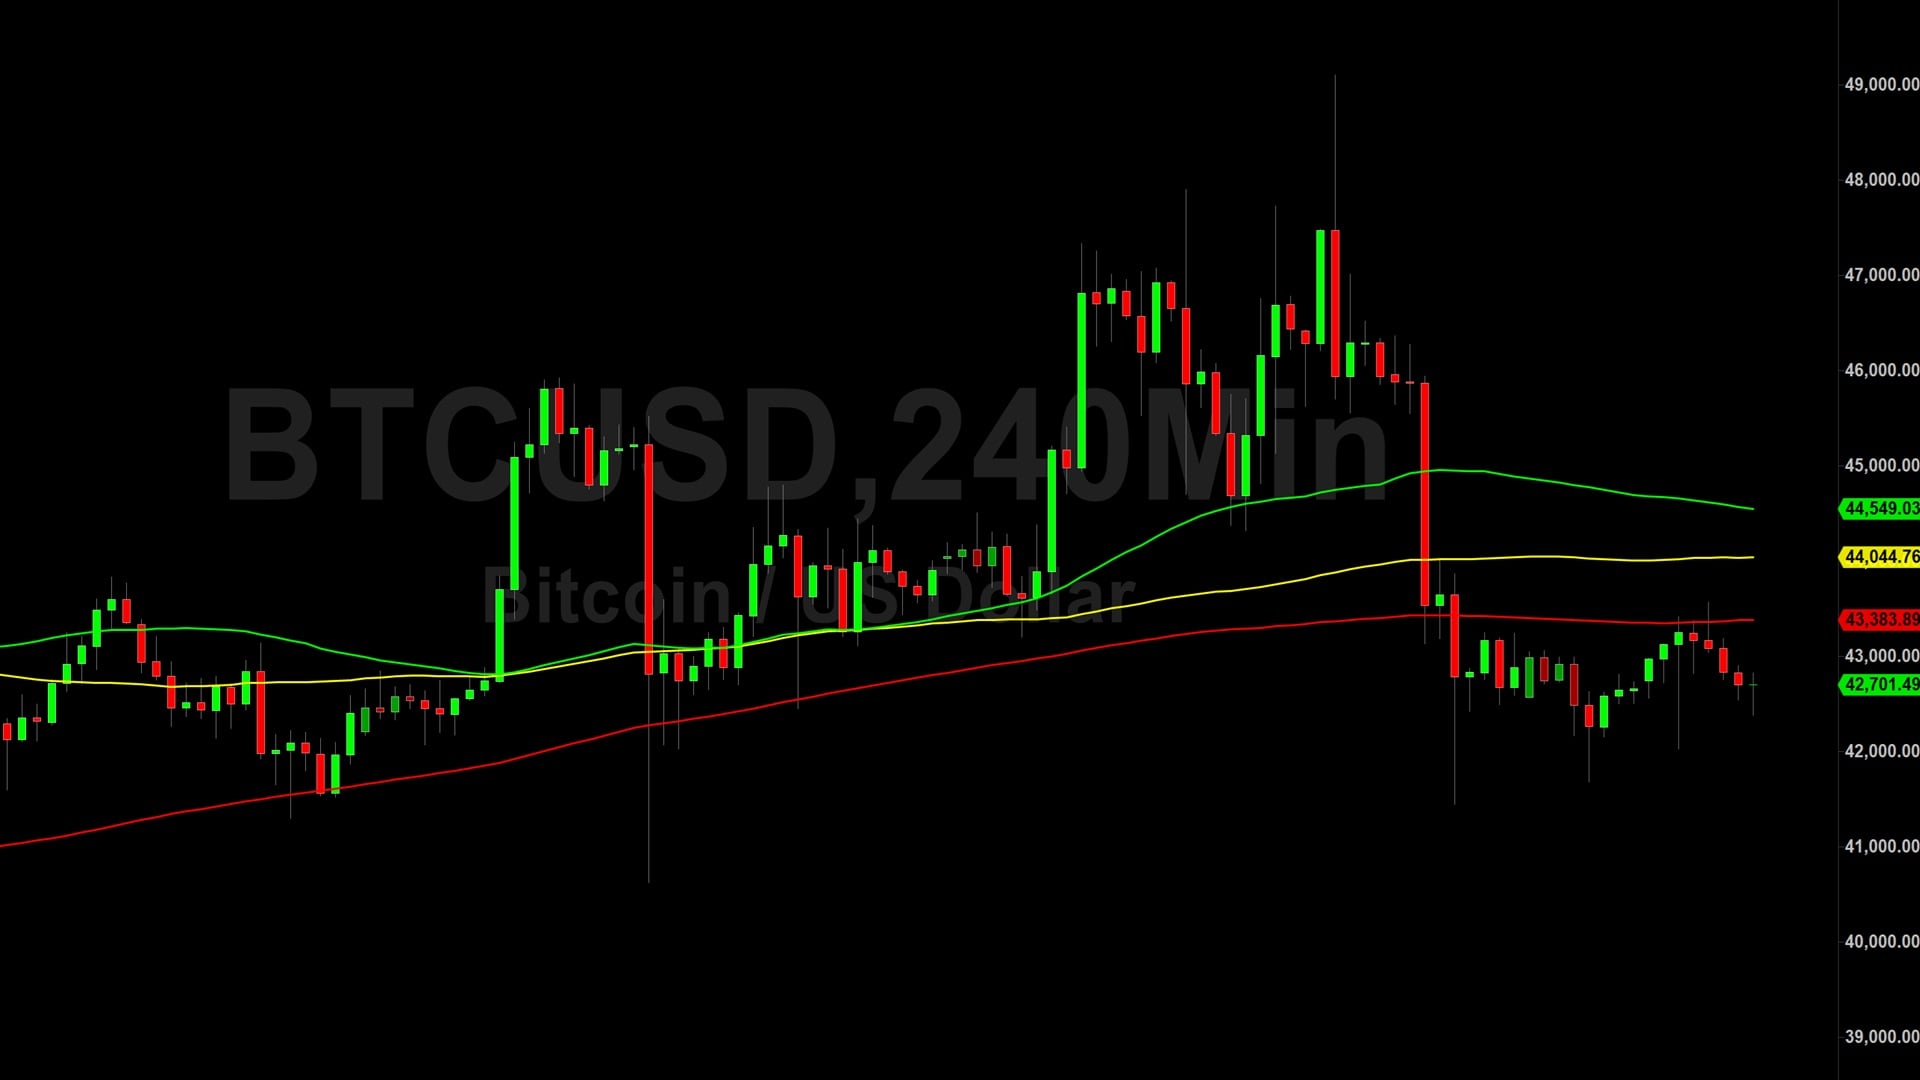
Bitcoin (BTC/USD) awaited new technical guidance early in the Asian session as the pair continued to trade above the 41661.16 area, a recent upside price objective related to buying pressure around the 25983 and 29328 levels. The recent high around the 49102.29 area was BTC/USD’s strongest print since late December 2021. Trading activity has orbited the 42715.80 area for several trading sessions, a downside price objective related to recent selling pressure around the 49102.29 and 46368.67 areas. After BTC/USD recently depreciated and tested a downside price objective around the 41208.59 area, buying pressure emerged around the 42495 area, a test of a recent upside price objective related to recent buying activity around the 24900 and 34758.64 levels.
Large Stops were elected above the 47934, 48466, and 48647.72 levels during the recent appreciation to multi-year highs, significant technical levels related to historical buying pressure and the all-time high of 69000. Upside price objectives include the 51701, 52121, 52971, and 53370 levels. Following the move to new multi-year highs, areas of technical support and potential buying pressure include the 41208, 39343, and 36329 levels. Traders are observing that the 50-bar MA (4-hourly) is bullishly indicating above the 100-bar MA (4-hourly) and above the 200-bar MA (4-hourly). Also, the 50-bar MA (hourly) is bearishly indicating below the 100-bar MA (hourly) and below the 200-bar MA (hourly).
Price activity is nearest the 200-bar MA (4-hourly) at 43384.03 and the 50-bar MA (Hourly) 42764.89.
Technical Support is expected around 40625.68/ 37321.80/ 34950.00 with Stops expected below.
Technical Resistance is expected around 51707.77/ 52121.96/ 53370.28 with Stops expected above.
On 4-Hourly chart, SlowK is Bearishly below SlowD while MACD is Bullishly above MACDAverage.
On 60-minute chart, SlowK is Bullishly above SlowD while MACD is Bearishly below MACDAverage.
Sally Ho’s Technical Analysis
View Yesterday’s Trading Analysis
Disclaimer: Sally Ho’s Technical Analysis is provided by a third party, and for informational purposes only. It does not reflect the views of Crypto Daily, nor is it intended to be used as legal, tax, investment, or financial advice.

Related Stories